Hints of Energy Dependences in AGASA Extremely High Energy Cosmic Ray Arrival Directions
Abstract
A correlation and probability analysis of the distribution of arrival directions for a sample of AGASA events reported to have energies above eV shows the small scale clustering to remain significant at the CL and to be consistent with previous results. For the sample taken as a whole, there are no departures from either homogeneity or isotropy on angular scales greater than 5 degrees. The sample of events with eV contains no pairs with separations degrees. Cross correlating subsamples partitioned by energy reveals three uncorrelated distributions in the intervals eV, eV, and greater than eV. The partition with eV is correlated with the supergalactic equatorial plane while the other two groups are statistically consistent with isotropic distributions. The presence of three distinct energy-partitioned groups of events could reflect possible changes in primary composition, different source distributions, differing levels of GZK losses, or deflection effects of magnetic fields.
PACS number(s): 95.85.Ry, 98.70.Sa
Accepted for publication in Phys. Rev. D
1 Introduction
Investigating cosmic ray airshowers induced by extremely high energy cosmic rays (EHECRs, eV) remains an area of intense interest because of an apparent paradox posed by the onset of the Greisen-Zatsepin-Kuzmin (GZK) effect at these energies. The GZK effect provides an efficient energy loss mechanism for sufficiently energetic cosmic ray protons interacting with cosmic microwave background (CMB) photons [1, 2]. Specifically, for cosmic ray primaries of energy eV, photopion production is greatly enhanced through the excitation of the (1232 MeV) resonance. As the mean free path for this process is few Mpc, it is virtually impossible for a proton of initial energy eV to travel distances greater than Mpc without losing a large fraction of its energy [3]-[6]. This distance forms the boundary of the so-called “GZK sphere”. As is well known, the apparent paradox is that several cosmic ray experiments have detected a total of approximately 15 events apparently having eV but with no currently obvious astrophysical source within the local GZK sphere.
Due to the small data sample presently available, relatively little is known with certainty concerning these trans-GZK events. In particular, unresolved are the fundamental questions concerning the composition/charge of the primaries and how the distribution of arrival directions is related to the spatial distribution of sources. Since there is no quantity analogous to galactic redshift to indicate relative distances, statistical analysis of the arrival directions of cosmic ray induced airshowers is necessarily restricted to two dimensional tests over angular areas. And while the angular distribution is obviously the projection of an underlying spatial distribution, the danger of inferring spatial properties from angular characteristics is well known due to the impossibility of deconvolving independent projection effects.
What have been called “small scale anisotropies” as manifested by the apparently nonrandom clustering of EHECR arrival directions in multiplets (doublets and triplets) may or may not be correlated with 3-dimensional inhomogeneities. Small scale angular anisotropies in the distribution of galaxies are associated with localized spatial inhomogeneities, and this is similarly true for EHECRs if they originate from sources embedded in a matter distribution (luminous or dark). While it is reasonable to speculate this is the case, there is as yet no concrete evidence to support even this basic hypothesis. At this time, an equally viable hypothesis is to associate the clustering with magnetic focusing in which case there is no correlation with a 3-dimensional density distribution. It is also possible that the observed distribution of arrival directions results from both (or other) causes.
For this study, we analyze the AGASA data for airshowers with zenith angles contained in references [7] and [8] plus three additional events with eV listed on the AGASA website [9]. Inclusion of the three newest high energy events listed on the website is desirable in order to increase the statistics of the tests used here, but is admittedly not optimal since it is currently not possible to include the additional events between eV that will be part of the next AGASA update. Where a bias is possible due to this selective inclusion of events, the sample is restricted to only the 57 events contained in reference [8]. Although it forms a doublet with a higher energy event and is close to the threshold cutoff of eV, we specifically exclude the event with eV because it is impossible to assess the significance of this additional pairing without having the positions of all other events of energies eV. In addition, although there are data for Haverah Park, Volcano Ranch, and Yakutsk events above eV, for the most part, we choose not to include them here since a large part of our analysis involves energy cuts, and it remains uncertain as to how closely the energy estimates match between the various experiments. This limits the significance of the results, but it is probably best to be conservative until, at the least, revised energies are published from the re-analysis of the Haverah Park data [10].
Previous investigations of AGASA data have found statistically significant clustering on small scales with no apparent clustering or anisotropy on large scales; a representative sample of model-independent studies are references [7] and [11]-[17]. For the present analysis, a robust angular correlation estimator is applied to the AGASA EHECR arrival directions to probe for possible departures from homogeneity on all angular scales. The grouping of EHECR arrival directions into doublets and triplets is re-analyzed with the Monte Carlo simulations used here yielding larger probabilities for the presence of small scale clusters but with similar significance compared to previously reported results. A cross correlation estimator is then applied to energy-partitioned subsamples of EHECRs with the result that for the AGASA sample there appear to be three distinct (uncorrelated) distributions with one being preferentially located near the supergalactic equatorial plane.
2 The Two Point Angular Correlation Function
The two point correlation function is an effective and commonly used statistic to measure departures from homogeneity of an observed distribution of points. With no distance information available for cosmic ray events, the starting point is the two point angular correlation function representing the projection of the spatial correlation function on the celestial sphere. It is defined in terms of the joint probability for finding two points separated by an angle ,
| (1) |
where and are solid angle elements containing two points separated by angle and is the mean surface density of points; for a homogeneous (uncorrelated) distribution of points (for a detailed development of correlation functions see [15]). As a practical matter, is computed from the ratio of counts of pair separations for the data sample, DD, and the average pair separations from a Monte Carlo generated test model, RR,
| (2) |
Previous investigations utilizing this estimator for analyzing cosmic ray arrival directions include references [16] and [17]. However, as shown by Landy and Szalay, the estimator in (2) generally exhibits variances larger than the values expected when the pair counts follow a Poisson distribution [18]. They analytically developed a modification that possesses a variance naturally free of a higher order term present in the variance of the estimator in (2). In addition, the Landy-Szalay (LS) form for is robust in reducing spurious correlations resulting from inaccuracies in the assumed test model. The LS form for is
| (3) |
where it can be seen that the data/random cross-term in (3) is responsible for the self-correcting and stabilizing feature that reduces both the effects of modeling errors (including boundary effects) as well as the spurious correlations due to large data fluctuations intrinsic to small samples. When boundary effects are small, the data sample sufficiently large, and the test model faithfully reproduces the actual average background distribution, the results of using equation (2) are accurate and agree with (3). If the test model is approximately correct, highly significant features will appear the same regardless of whether (2) or (3) is utilized. Here it is safest to use the LS form for since the data sample of AGASA EHECRs is still relatively small and the mean density of the underlying source distribution is unknown.
The Monte Carlo sampled distribution of EHECR arrival directions is constructed to be uniform in right ascension and follows the observed declination distribution for AGASA events with zenith angles as presented in [7]. The test model therefore corresponds to a both isotropic and homogeneous source distribution convolved with the sky coverage and detector acceptance of the AGASA experiment. Detailed examination shows that the Monte Carlo random catalogs accurately reproduce the polynomial fit to the declination distribution over the entire interval of .
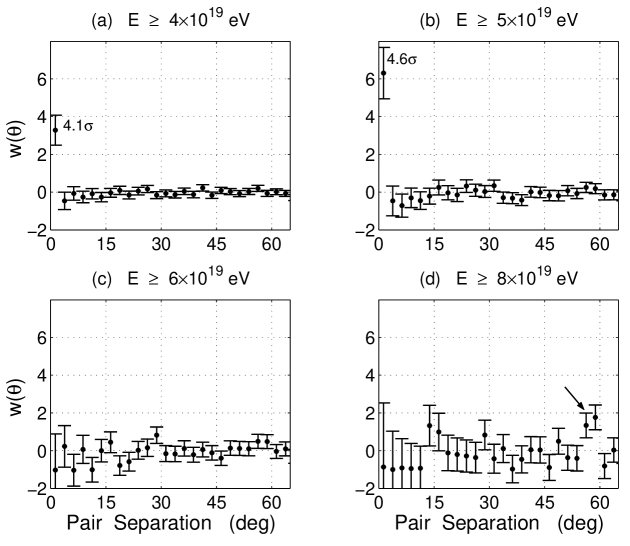
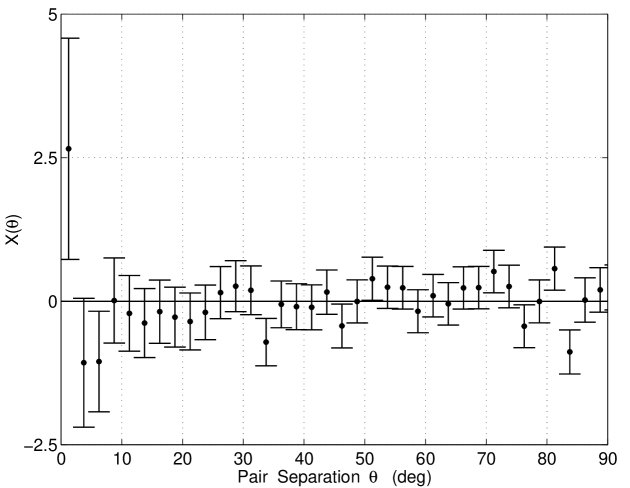
The two point angular correlation function is shown Figure 1 for a bin size of and for various energy cuts. The small angle clustering in Figures 1(a,b) is apparent from the positive correlation in the first bin (with MC probability of ). As shown, the plots extend only to pair separations of , but there are no significant correlations at larger separations for any of the samples. For a bin width of , the values of for the first bin are slightly reduced but with similar significance to those with the bin size. The positive correlation in the first bin drops very rapidly and disappears when the bin width reaches . The null correlations for bin sizes of approximate the results obtained from perturbing the positions around their stated values with a Gaussian error distribution. The lack of any statistically significant structure at the larger angles demonstrates that when the sample is considered in its entirety, the AGASA EHECR distribution of arrival directions is statistically homogeneous on all angular scales except for those .
A further comparison of Figures 1(a,b) shows that while there are three additional pairs in the entire sample compared to the sample cut at eV (7 versus 4), the value of and the significance of the small scale clustering is somewhat greater in the latter sample due to the smaller total number of events (35 versus 60). The change in significance is related to the fact that, for example, the probability for having zero pairs in a random sample is less for the larger sample ( for N = 60 and for N = 35). This result serves as a reminder that while the clustering seen in the AGASA dataset is statistically significant, it is quite possible that some of the pairing in the sample of 60 events is due to chance projection. Also of interest is the lack of clustering of events with eV for the AGASA sample analyzed here (0 pairs with separations degrees, 1 pair with separation degrees). However, with only 25 events in this subsample, it is not possible to form any conclusions relative to this result.
The two bins highlighted by the arrow in Figure 1(d) combine to form a result in a bin at for events with eV. As discussed previously, one of the strengths of the LS estimator is that similar features appearing in results obtained from using the estimator in (2) are naturally suppressed by the cross term in (3). We have checked that this feature is not the result of an average density anisotropy between different parts of the sky where the highest energy events are located, but is due to the formation on the celestial sphere of two essentially equilateral triangles with event arrival directions located at the vertices. Shifting the bin center or increasing the bin size to strongly suppresses the correlation. Inclusion of the three newest AGASA high energy events has no effect on the significance of the point, but removal of the three events between eV reduces the correlation to insignificance. While the Monte Carlo probability for such an occurrence is only , it is suspected that this feature is just an unusual chance alignment in the data. Thus, although it seems unlikely this is a true correlation indicating structure, it is worth noting for further study as larger event samples become available.
3 Multiplet Counting and Probabilities
Evaluating the true significance of the observed clustering requires additional consideration of the probability of occurrence. The two point correlation function involves pair counts regardless of whether the pairs occur in doublets, triplets, quadruplets, etc. However, since the probability of random occurrence for three doublets can be very different than for one triplet, it is important to analytically or numerically determine probabilities for various multiplet configurations. This implies that the first bin of the autocorrelation function may or may not represent the actual probability of a given clustering configuration. This is an expected result since the two point correlation function is only the lowest order term in a Taylor series expansion of the characteristic function of the probability distribution. The presence of triplets and higher order multiplets requires higher order correlation functions to accurately estimate their probability of occurrence; however, the two point function is sufficient for exposing departures from homogeneity.
Specific values of clustering probabilities depend on the definition of a multiplet. In the existing data from AGASA, Haverah Park, Yakutsk, and Volcano Ranch, there are two triplets, each having all pair separations less than . Thus, in computing the probabilities presented here, a multiplet is defined as a set of points within a covering circle of diameter equal to the experimental uncertainty in angular position. This implies that the error circle of radius of each point in the multiplet intersects the estimated positions of all the other points, or, equivalently, that all distinct pairs are separated by .
Based on probabilities computed from simulation, the approach used here to estimate the significance of small scale clustering into multiplets is similar, but not identical, to that employed by others (e.g., see [11]). In both the data and the Monte Carlo catalogs, only distinct multiplets are used in the final results. That is, our counting algorithm first identifies all multiplets from doublets through sextuplets for a specified opening angle (pair separation), and then correction factors are applied to each count to remove the contributions of higher order multiplets on lower orders. This is straightforward, but sometimes unexpectedly subtle as, for example, when four points combine to form two distinct triplets instead of one quadruplet requiring five instead of six doublet pairs to be subtracted from the raw doublet count. Depending on the sample size simulated, between 100,000 and 500,000 Monte Carlo trials are used to obtain numerically converged probabilities. The random catalogs are constructed in the same way as for the correlation functions. Details of our Monte Carlo sampling routines together with a comparison of our results with [11] are contained in reference [19].
Analytical estimates of clustering probabilities based on Poisson statistics have been presented previously in, e.g., Dubovsky et al. [12]. Goldberg and Weiler constructed analytical formulas for exact probabilities and asymptotic forms that differ naturally from the pure Poisson estimates due to the presence of system constraints [13]. Further results from using the Goldberg-Weiler formulation are contained in Anchordoqui et al. [14]. The method is based on calculating the probabilities of bin occupation numbers for specified bin widths and numbers of bins, and yields probabilities for distinct occupation configurations under the assumption that all bins have equal occupation probabilities (an approximation to the non-uniform acceptance of ground array detectors such as AGASA). The bin area is chosen to be for a correlation (opening) angle of (leading to a bin diameter of ).
For exclusive doublet configurations with zero higher order multiplets, the pair separation definition of a multiplet used in this study is equivalent to the bin occupation probability given by the Goldberg-Weiler formula. For a simulated uniform declination distribution, the exclusive doublet probabilities differed by less than 10% from the analytically computed values and were within 30-40% when using the AGASA declination distribution. Exclusive triplet probabilities from simulation were also consistent with the analytical results as were the joint exclusive doublet/triplet probabilities although differences begin to appear more significant when compared with the non-uniform AGASA declination distribution. In general, with an appropriate choice for the total solid angle used in the analytical formula, the differences between the two approaches can be less than a factor of two for all doublet/triplet configurations. As expected, by requiring all distinct pair separations to be , the quadruplet probabilities shown in Figure 4 are smaller by factors of 5-10 compared to those computed analytically where the bin diameter is .
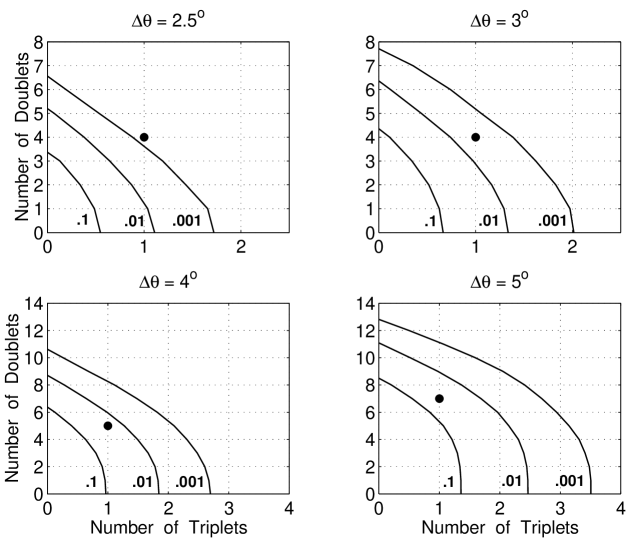
Joint probability contours have been constructed for various doublet/triplet combinations as a function of sample size and opening angle from the simulations utilizing the AGASA declination distribution. For the sample sizes considered here, the probabilities for quintuplets, sextuplets, etc. are negligible () compared to the doublet and triplet probabilities with the quadruplet probabilities also being safely neglected () for when the opening angle is degrees. Examples are shown in Figures 2 and 3 for contours representing the joint inclusive probabilities
| (4) |
given specified values of and .
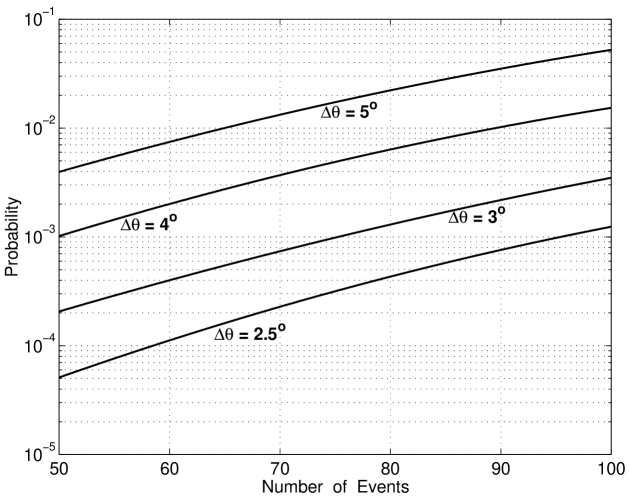
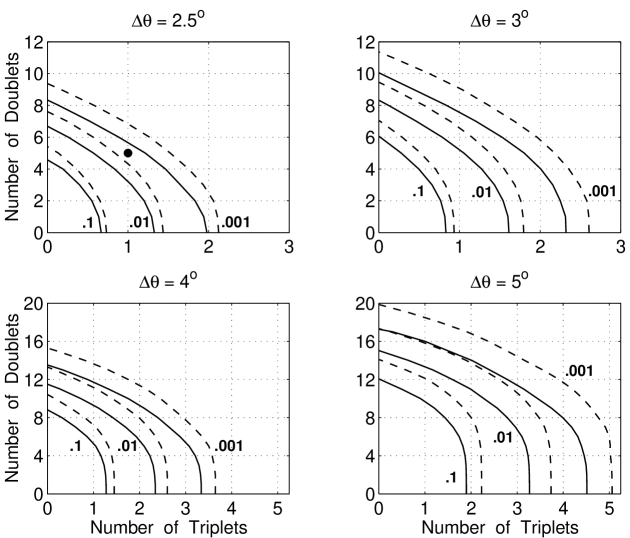
Consideration of the contours in Figure 2 for a bin size of shows that the observed configuration of 4 doublets and 1 triplet for an opening angle of has a probability of less than 0.1% to occur due to random projecton. Further examination reveals common qualitative characteristics of clustering probabilities. For example, note that although the probability for finding triplets and doublets is much smaller than for doublets and triplets, there are cases where a triplet/doublet combination has the same or even greater probability as the same number of pairs distributed only in doublets. It can also be seen in this figure that just as in the correlation function, the significance of the probability rapidly decreases as the opening angle increases. The contours for the larger sample sizes in Figure 3 may be used to estimate the statistical significance of doublet/triplet clustering in future AGASA event samples. The inclusive probabilities for quadruplets as a function of sample size for opening angles of , , , and are shown in Figure 4.
We note that the probability distributions obtained for doublets and triplets for a combination of AGASA, Haverah Park, and Yakutsk declination distributions are similar in shape to those obtained in reference [11]. However, a direct comparison of the probabilities found here shows them to be a factor of 2 larger (twice as likely) for the total number of uncorrected doublets (i.e., total number of pairs without regard to what order of multiplet they appear in), and a factor of 1.5 larger for uncorrected triplets for the 92 events considered. The results of Uchihori et al. indicated that the small angle clustering for the entire sample of 92 events was only marginally significant for an opening angle of and not significant for larger opening angles [11].
| Sample | Doublets | Triplets | MC Probability | |
|---|---|---|---|---|
| N = 102, all events | 3 | 8 | 2 | 1.0% |
| 4 | 11 | 2 | 8.6% | |
| N = 91, exclude HP low energy | 3 | 5 | 2 | 0.7% |
| 4 | 7 | 2 | 6.5% | |
| N = 56, exclude all low energy | 3 | 0 | 2 | 0.1% |
| 4 | 1 | 2 | 0.6% |
Although our probabilities for total (uncorrected) pair counts are greater, when considering the corrected joint doublet/triplet probabilities for distinct multiplets only, we obtain Monte Carlo probabilities numerically similar to those in [11]. Values of the same order are obtained for the extended sample of 102 events with the results summarized in Table 1. From this table it can be seen that as in the sample of AGASA events only, the amount of clusters decreases but the significance of the clustering increases as lower energy events are removed from consideration. For example, for , ignoring the likely differences in energy scales between the experiments and arbitrarily removing all events with reported energies eV eliminates all but 1 doublet but leaves the 2 triplets with a resulting MC probability of . Thus, it is possible that the small angle clustering is more significant in the combined sample than previously thought; however, it must be emphasized that this cannot be confirmed until the revised energies are given for the Haverah Park events.
4 Cross Correlations of Energy Partitions
The two point correlation function in Section 2 is the autocorrelation function for a sample of data points. It is often of interest to compute the cross correlation of two data samples. In this case, the basic form analogous to (2) is
| (5) |
where the subscripts 1 and 2 refer to the different samples. It is straightforward to construct an LS estimator analogous to (3) that reduces to (3) when ,
| (6) |
and where implies the two samples are statistically uncorrelated.
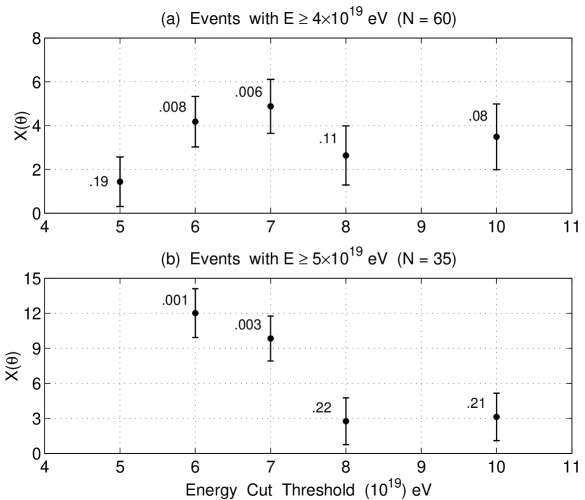
As a starting point, the values for the first bin of for a bin size of are shown in Figure 5(a) above and below a given energy threshold for the 60 AGASA events. As there are no events in this dataset with energies between eV, the results for the energy cut at eV are the same as for eV. Although the first bin values of are positive for all cases, only those corresponding to % probability are considered significant. Thus, the data indicates that events below and above eV are not strongly correlated, and the same holds true for the threshold energy eV. As shown in Figure 5(b), after removing the 25 events with eV, the independence of the events below and above eV and the strong autocorrelation of the events with eV are even more apparent. These results suggest the division into three groups with energies eV, eV, and eV.
Using the three energy partitions as defined above, the cross-correlation functions are computed for the three possible combinations. Figure 6 shows the statistical independence at all angles of the middle and high energy partitions. The results for the other two cases are very similar with the exception of two points appearing at angular separations of in the cross-correlation of the eV and the eV partitions. For both points, the correlation values in the immediately adjacent bins are negative for the bin width. This suggests that both points are probably unusually large fluctuations similar to the large scale feature in the 2-point function described in Section 2. As expected for this type of feature, the values for these points using (6) are reduced compared to those obtained from using (5).
Of course, more data is required to confirm the existence and independence of these energy partitions. If confirmed, the implications are that events separated in energy are being influenced differently or are of different origin or composition. This could be especially important in helping to determine the nature of the trans-GZK distribution above eV.
5 Anisotropy and the Supergalactic Plane
As noted, the correlation function reveals no compelling departures from homogeneity on large angular scales for either the entire or the energy-partitioned samples. It is then natural to check whether the events appear to show directional dependences with respect to coordinate systems such as galactic or supergalactic. Testing for anisotropy begins with sector counts of data compared to expected values from simulation. This is sufficient for the analysis here although it should be noted that it is possible to describe deviations from isotropy by constructing statistical estimators such as plane enhancement factors.
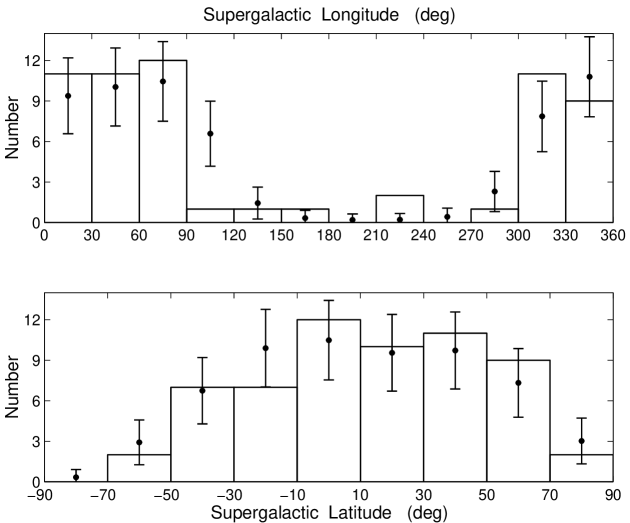
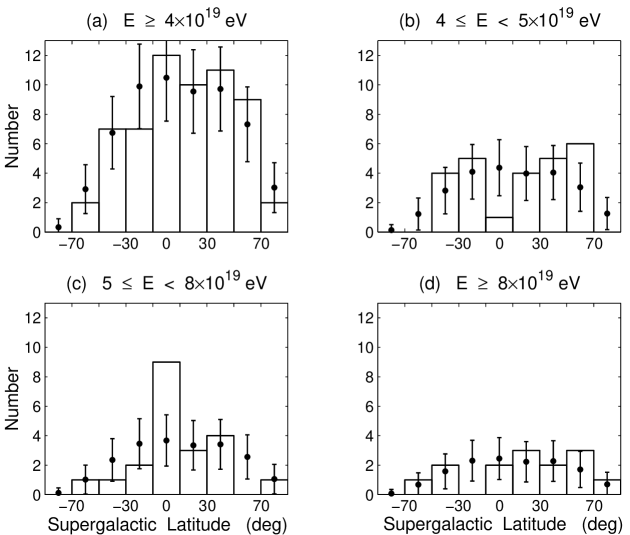
Figure 7 shows the distribution in supergalactic (SG) coordinates of the 60 AGASA events where it can be seen that the arrival directions appear to be isotropically distributed. However, referring to Figure 8, constructing similar histograms for the three partitions described in the previous Section reveals that the group with energy eV is aligned with the SG equatorial plane at the level (corresponding to a probability). The lower and higher energy groups are consistent with statistically isotropic distributions although the deficit near the SG equator for the low energy group should be checked in future studies. The SG longitude distributions for the three energy-partitioned samples cannot be distinguished from isotropically distributed sources.
As an independent test of the significance of the alignment of the eV group with the SG plane, the energies of the 60 AGASA events were randomly shuffled among the (fixed) event coordinates. Aftr 100,000 trials, there were an average of events with , and in only 0.2 - 0.3% of the trials did the number equal or exceed the observed value of 9. This probability is of the same order as the 0.6% found from MC sampling the coordinates, and confirms the statistically significant nonrandom alignment of this partition with the SG equatorial plane.
A possible correlation between EHECRs and the Local Supercluster was hypothesized by Stecker in 1968 based on his calculations of propagation paths attenuated by photomeson production [3]. Stanev et al. noted in 1995 that EHECR arrival directions show a correlation with the SG plane, and that this was consistent with the hypothesis that powerful radio sources within the Local Supercluster, being concentrated in this plane, could be the production sites of high energy cosmic rays [20]. Following this, other studies have pointed out that some of the multiplets are preferentially aligned in this direction [7, 11, 21]. Because the AGASA triplet is within a few degrees of the SG equator, and the energies of the triplet are between eV, the statistical significance of the results are strongly influenced by this structure. Due to the anticipated relative differences in energy scales, it is not possible at this time to further pursue the correlation of the arrival directions with the SG equatorial plane as a function of energy utilizing the combined data from other experiments.
If the observed anisotropy and correlation with the SG plane of the middle energy group is in fact related to a source distribution residing within the Local Supercluster, then it is probable that this same energy group should also be anisotropically distributed with respect to SG longitude. Specifically, with our Galaxy being located toward the periphery of the Local Supercluster, there are many more galaxies along the Galaxy line-of-sight direction corresponding to (toward the Virgo cluster which lies at the center of the Local Supercluster) than along the opposite direction of . However, inspection of Figure 7 reveals that there is no AGASA coverage along SGL values where deficits would be expected to exist. Thus, determination of this possible anisotropy requires data from a different experiment and cannot be analyzed from the current dataset.
6 Summary
In the above analysis, we consider features with values
( MC probability) to be potentially indicative of structure
or to warrant further examination with larger datasets. Features at the level also merit further attention, but it is premature to
attribute significance to them in this study.
The results may be summarized as follows:
1. The AGASA EHECR arrival directions
continue to exhibit clustering on scales at the level
with probabilities of random occurrence of %, and
continue to show no compelling departures from homogeneity on
scales ,
2. Partitioning the AGASA sample by energy yields three uncorrelated
groups with eV, eV, and
eV,
3. The partition with eV appears to be preferentially
aligned with the SG plane with a probability for random occurrence of
while the other two partitions are statistically
consistent with isotropic distributions. Supporting evidence that this anisotropy is related
to the Local Supercluster would be an observation of an anisotropy in the numbers
of events toward SG longitudes in the neighborhoods of
, but this is not yet
possible due to the limited sky coverage of the AGASA experiment,
4. Combining the 102 events reported to have energies eV from AGASA,
Haverah Park, Yakutsk, and Volcano Ranch and considering
inclusive joint probabilities of distinct multiplet configurations, we find MC probabilities of
and for opening angles of and , respectively.
5. Without regard to differences in energy scales between the four experiments,
eliminating all events in the 102 event sample with energies reportedly eV
yields a clustering probability of for the (0 doublet, 2 triplet) configuration observed
for an opening angle of and a probability for the (1 doublet, 2 triplet)
configuration observed for an opening angle of .
The change in significance of the clustering probability for the 102 event sample in making
the energy cut and reducing the observed configuration from 11 doublets and 2 triplets
to 1 doublet and 2 triplets () underscores the unlikely chance for
observing 2 triplets in a sample containing only events.
It should also be noted that the values of the energy partitions obtained for the AGASA events may or may not correspond to an absolute energy scale as it is possible that the AGASA energy calibration could be revised in the future. Nevertheless, the energies found here are consistent with certain expectations of regimes where GZK or magnetic field effects change their relative importance. And, of course, being based on relatively few events, these results can be significantly affected by the addition of the next 15 to 20 events.
Beyond the characterization of statistical properties, a natural goal of this type of analysis is to determine underlying causes. With so little known concerning the nature of the EHECR distribution, it is tempting but difficult to extrapolate statistically significant features of small datasets to physical properties of the parent distribution. Here that means attempting to associate the above results with repeating sources, changes in primary composition or source distribution, or magnetic lensing. The difficulty is compounded by the lack of knowledge of how many physical mechanisms are influencing the observed distribution. For example, it is plausible that if there exist neutral EHECR primaries unaffected by GZK losses or magnetic fields, then there also exist charged primaries that are so affected. In that event, a single type of production mechanism gives an observed spectrum that is a superposition of charged primaries from sources residing within the local GZK sphere, and neutral primaries that may originate from sources both within and beyond the GZK sphere.
What is fair to
hypothesize based on the results here is the existence of three distinct
energy distributions (presumably of extragalactic
origin) comprising the observed spectrum of EHECR events and that may possess the following
properties:
1. Cosmic rays with comprising the high energy
tail of a primary distribution largely unaffected by GZK losses,
2. Primaries, possibly protons, with eV that have lost energy through the GZK effect, and, with arrival
directions being aligned with the supergalactic plane, may originate
from sources located within the Local Supercluster,
3. trans-GZK primaries of unknown composition and origin with energies that may or may not be losing energy via the GZK effect.
The consistency of this interpretation can be checked further once the energy scales of existing
datasets are brought into accordance, but confirmation or rejection probably requires a larger
single dataset as will be provided by Auger.
Acknowledgements
The authors thank A. Szalay for referring them to the use of the
Landy-Szalay two point correlation estimator, W. Rindler for helpful suggestions,
A. Watson for information concerning Haverah Park data and for allowing access to
the high energy HP events, and
Y. Uchihori for his correspondence on some of the issues discussed in this paper
as well as help with data from Haverah Park, Volcano Ranch, and Yakutsk.
We would also like to thank H. Goldberg and T. Weiler for correspondence
concerning their analytical formula for computing clustering probabilities.
We are especially grateful to J. Krizmanic for several informative discussions
together with his critical review of portions of this paper. Finally, we would
like to thank an anonymous referee for several helpful suggestions.
References
- [1] K. Greisen, Phys. Rev. Lett. 16, 748 (1966).
- [2] G.T. Zatsepin and V.A. Kuzmin, JETP Lett. 4, 78 (1966).
- [3] F.W. Stecker, Phys. Rev. Lett. 21, 1016 (1968).
- [4] C.T. Hill and D.N. Schramm, Phys. Rev. D 31, 564 (1985).
- [5] V. Berezinsky and S.I. Grigor’eve, A & A 199, 1 (1988).
- [6] S. Yoshida and M. Teshima, Prog. Theor. Phys. 89, 933 (1993).
- [7] M. Takeda et al., ApJ 522, 225 (1999).
- [8] N. Hayashida et al., e-print arXiv:astro-ph/0008102 (2000).
- [9] http://www-akeno.icrr.u-tokyo.ac.jp/AGASA/
- [10] A. Watson, private communication concerninig the expected downward revisions of the highest energy Haverah Park events based on updated models.
- [11] Y. Uchihori et al., Astroparticle Physics 13, 151 (2000).
- [12] S.L. Dubovsky et al., Phys. Rev. Lett. 85, 1154 (2000).
- [13] H. Goldberg and T.J. Weiler, Phys. Rev. D 64, 056008 (2001).
- [14] L.A. Anchordoqui et al., Mod. Phys. Lett. A16, 2033 (2001).
- [15] P.J.E. Peebles, The Large Scale Structure of the Universe, Princeton University Press, 1980.
- [16] P.G. Tinyakov and I.I. Tkachev, JETP Lett. 74, 1 (2001); also, Proceedings of ICRC2001, 547 (2001).
- [17] R.W. Clay et al., ”The Two Point Angular Autocorrelation Function and the Origin of the Highest Energy Cosmic Rays”, unpublished, date unknown.
- [18] S. Landy and A. Szalay, ApJ 412, 64 (1993).
- [19] M.R. O’Malley, “Testing the Homogeneity and Isotropy of the Highest Energy Cosmic Rays for Clues as to Their Origin”, unpublished Ph.D. dissertation, currently in preparation with copies to be made available upon request.
- [20] T. Stanev et al., Phys. Rev. Lett. 75, 3056 (1995).
- [21] N. Hayashida et al., Phys. Rev. Lett. 77, 1000 (1996).