Chapter 1 Sources of sub-GZK cosmic rays
Abstract
We analyze the existing evidence that BL Lacertae objects (BL Lacs) are sources of the highest-energy cosmic rays. We argue that three independent signatures observed in the real data — (1) improvement of correlations with corrections of trajectories for the Galactic magnetic field; (2) connection between -ray and UHECR emissions; (3) non-uniform distribution of correlating rays over the sky — are consistent with the hypothesis that a substantial fraction of cosmic rays in the energy range eV are protons accelerated in BL Lacs.
1. Introduction
The fact that the observed arrival directions of UHECR [1,7,8] show significant clustering [7,12,9] suggests that their sources may be identified using already existing data. Poor (in astronomical standards) angular resolution of the UHECR experiments and bending of particle trajectories by Galactic and extragalactic magnetic fields does not allow an event-by-event identification. One therefore has to relay on statistical methods, i.g. on calculation of the angular correlation function [9,10]. In this approach, the significance of correlations at a given angular scale may be characterized by the probability that the observed excess of events around sources at a scale may have occurred by chance. When is small, the correlation is physical as it cannot be explained by a statistical fluctuation. Apart from the angle, depends on the set of potential sources and other parameters like assumed charges of particles and parameters of the Galactic magnetic field (GMF). Significance of correlations may be used to determine the physical values of these parameters and the subset of actual sources by looking at the minima of .
The choice of candidate sources depends on the assumptions about the nature of UHECR. In the most conservative approach sources are associated with astrophysical accelerators, among which active galactic nuclei (AGN) may be singled out for their total energetics and good conditions for particle acceleration [2,3]. Even in such powerful accelerators, the acceleration of protons to energies of order eV requires exceptional conditions. It is therefore quite likely that only a small fraction of AGNs can produce UHECR.
Comparing the number of isolated cosmic ray events to the number of close pairs and higher multiplicity clusters, one may estimate the number of point sources to be of order several hundred [4]. This agrees with the expectation that only a special class of AGNs can be UHECR sources. A subclass of ANGs, blazars, are thought to have relativistic jets directed along the line of sight. Therefore, if UHECR do correlate with AGNs, they should correlate with blazars. A subset of blazars called BL Lacertae objects (BL Lacs) is characterized, in addition, by narrow (or absent) emission lines. This latter property suggests low ambient matter and radiation densities near the central engine and may provide favorable conditions for particle acceleration to highest energies. In addition, there are indications of negative evolution of BL Lacs (there were less of them in the past), which makes the GZK cut-off less sharp. We conclude that, on theoretical grounds, BL Lacs are potentially promising sites of UHECR acceleration and should be selected as a set of candidate sources for correlation analysis.
The most recent catalog of AGN contains 350 confirmed BL Lacs [13], the closest being at . Our analysis shows significant correlations between UHECR and most powerful BL Lacs [10]. The correlations occur at angles comparable to the experimental angular resolution. It implies that BL Lacs are sources of UHECR.
Can one find, in the existing data, independent signatures supporting this result? This is the main question which we address in the present talk. We argue that these signatures do exist. Moreover, they are compatible with the assumption that UHECR of moderate energies are protons.
The correlation between UHECR and BL Lacs implies that the origin of (at least a part of) UHECR is acceleration. This has a number of consequences. First, one should expect that protons constitute at least part of the UHECR flux. Since protons are charged, they are deflected in the Galactic and extragalactic magnetic fields. The correction for these deflections should improve correlations with sources. This effect is indeed present in the data [11]. Second, any acceleration process is accompanied by energy losses. A substantial part of this energy goes into electromagnetic channel and ends up in the EGRET energy range [2]. Thus, one may expect the connection between sources of UHECR and gamma radiation. There are strong arguments in favor of this connection [5]. Finally, any chance coincidences between cosmic rays and BL Lacs should be distributed over the sky randomly (i.e. reflecting only the local density of BL Lacs and exposure of cosmic ray experiments). Thus, any significant deviation in the distribution of correlating rays over the sky from this expectation speaks in favor of real physical connection between cosmic rays and BL Lacs. We show that correlating rays are not distributed randomly.
In three subsequent sections we discuss these signatures in more detail. The last section contains discussion and conclusions.
2. Are there protons in UHECR?
Since protons are charged, they are deflected in the Galactic (GMF) and extragalactic (EGMF) magnetic fields. This property can be used to detect their presence in UHECR flux if deflections in GMF dominate and the effect of EGMF is negligible. Indeed, the Galactic magnetic field has a regular component in which the deflections can be calculated and actual positions of the sources (directions of rays before the deflections) can be reconstructed. The reconstruction should improve correlations with actual sources, and should have no effect in the case of random coincidence.
An important ingredient in this analysis is the model of GMF. The model we adopt consists of disk and halo components. The disk field has the spiral structure (bi-symmetric spiral model, or BSS ) summarized in the following equations,
where
and is the distance from the Sun to the Galactic center kpc. The field depends on three independent parameters: local (at the Sun position in the Galaxy) field strength ; pitch angle which determines the direction of the local magnetic field; distance to the magnetic field reversal.
The simplest approximation for the halo field is obtained by taking the disk field and extending it outside of the disk with exponentially decreasing amplitude. In addition, the halo field above and below the disk (more precisely, its parts coplanar with the disk) may be parallel or anti-parallel to each other. Therefore, the halo field is
| (1) |
where the fourth parameter describes the extent of the halo field. The function is either in the quadrupole-type model () or in the dipole-type model (). There are indications in favour of the global structure of the halo field coming from the analysis of Faraday rotation measures of extragalactic radio sources [6], and we adopt this model in what follows.
The values of the parameters are obtained by fitting the model to the Faraday rotation measures of pulsars and extragalactic sources. We take the following values from the literature (see [11] for details and references):
| (2) |
Negative value of refers to the field reversal in the direction towards the Galactic center.
Following Ref. [10], we take BL Lacs form the QSO catalog [13], updated version of which contains 350 confirmed BL Lacs. The choice of UHECR set is motivated as follows. A priori, best results should be achieved with the largest set having best angular and energy resolution. Therefore, we take all published AGASA events with energy eV [7,8]. This set contains 57 events.
The algorithm for calculation of the probability is described in detail in Refs. [9-11]. It amounts to counting how often the excess of cosmic rays around candidate sources observed in the real data occurs in randomly generated cosmic ray sets. The Monte-Carlo (MC) configurations are generated as described in Refs. [9-11]. The energies of MC events are taken from the real data, while the arrival directions are generated randomly assuming uniform distribution and taking into account the acceptance of the experiment. In the case when particles are assumed to be charged, each MC set is also corrected for deflections in GMF. Exactly the same treatment of the real data and MC sets is important to prevent appearance of artificial correlations. Following Ref. [10], the angular scale is taken to be . This value is used in what follows, unless the opposite is stated explicitly.
The results of the correlation analysis are summarized in Fig. 1. Left panel shows the dependence of the probability on the selected subset of BL Lacs. The selection is performed by a single cut in apparent magnitude (objects brighter than given magnitude are included). Three curves correspond to three charges: (solid line), (dotted line) and (dashed line). In the case , the correlations have significance of order in a wide range of cuts on BL Lac magnitude from to which corresponds to nearly the whole set. Although jumps in the curve suggest that fluctuations may be large, the appearance of the may be not a coincidence since identification of objects may be not reliable at , see Ref. [13]. It is also interesting to note that at the energy flux at optical wavelength matches the energy flux in UHECR required of a point source. We adopt the cut in what follows. At this cut, the set of BL Lacs contains 156 objects. The left panel shows the dependence of on the angular scale in this case.


2.1. Which BL Lacs are UHECR accelerators?
It is likely that not all blazars accelerate particles to highest energy, and probably not with equal efficiency. To build a realistic model of UHECR accelerator it is very important to determine the characteristic features of those blazars which are actual UHECR emitters. Some hints in this direction may be found in already existing data.
Blasars may be divided into high-polarization and low-polarization ones. These are low-polarization BL Lacs which constitute the set discussed above. The correlations with high-polarization blasars (listed separately in the catalog [13]) are absent. Thus, the low polarization may be one of the characteristic features of the UHECR emitters.
At the minimum of on Fig. 1 (right panel), out of total 57 cosmic rays 16 correlate with BL Lacs within . Examining the list of BL Lacs which contribute to this correlation [11], one notices two striking regularities. First, the majority of objects in this list are X-ray selected radio loud BL Lacs. Second, the fraction of correlating BL Lacs with unknown redshifts is noticeably larger than in the whole BL Lacs catalog. This may be explained as follows. The absence of emission lines (more precisely, their weakness and narrow width) is a defining feature of BL Lac family within the general blazar class. Therefore, it is not surprising that redshifts of roughly half of confirmed BL Lacs are not known. Increased fraction of BL Lacs with unknown among those which correlate with the highest energy cosmic rays may mean that the absence of emission lines is indeed important for a blazar to be an emitter of UHECR.
Finally, one may expect the connection between UHECR and -ray emissions in the sub-GeV energy region measured by EGRET. In order to test this hypothesis, in Ref. [5] we have selected those BL Lacs which can be associated with gamma ray sources. The selection was performed by looking at position coincidence within the EGRET angular resolution. The resulting set consists of 14 potentially -ray loud BL Lacs. Of these 14 objects 8 are found to correlate with arrival directions of UHECR, with the significance of order . This suggests that -ray emission can be used as a distinctive feature of those BL Lacs which are capable of producing UHECR.
Out of 14 associations between BL Lacs and EGRET sources, five coincide with previously known identifications, while six are newly proposed identifications of previously unidentified EGRET sources. Together with the incompleteness of the BL Lac catalog, this suggests that among the remaining unidentified EGRET sources there may be some fraction of BL Lacs – UHECR emitters. Their fraction should be maximum among 90 unidentified EGRET sources which lie outside of the Galactic plane. i.e. have . One may want to add these 90 unidentified EGRET sources to the list of candidate sources in order to increase statistics. In what follows we show correlations of UHECR with both sets of sources, the BL Lacs only and BL Lacs plus unidentified EGRET sources.
Fig. LABEL:ManuscriptTinTkach:BLandEGRET shows the dependence of on the energy cut in the set of UHECR. The dotted curve corresponds to the set of BL Lacs with (the point eV of this curve is present also on Fig. 1); the solid curve corresponds to the same set of BL Lacs plus unidentified EGRET sources. We see that with the addition of unidentified EGRET sources the correlations increase, which further supports the conjecture that the UHECR and -ray emmiters are related.

We see also that correlations steadily increase with decreasing cut in energy (i.e. with increased statistics). This implies that at the extragalactic magnetic fields are yet not important for proton propagation from BL Lacs. One may expect that this trend persists to somewhat lower energies.
2.2. Global anisotropy?
It is clear that random coincidences between cosmic rays and BL Lacs should be distributed over the sky according to the acceptance of a cosmic ray detector and local density of BL Lacs. Any significant deviations from this distribution gives independent signature that the correlations are real and should reflect real physical effects. There are a priori reasons to expect such a non-uniformity. The extragalactic magnetic fields are unlikely to be small in all directions. If primary particles are protons, one may expect good correlation with sources in some areas of the sky and no correlations in the other. Poor knowledge of the Galactic magnetic field may have similar effect: the directions of cosmic rays before they enter the Galactic magnetic field may be obtained correctly only in the regions where actual GMF is described well by the existing model. Thus, one may expect that correlating rays will not cover the acceptance region uniformly, but will form spots where their density is high, while in other areas the number of correlating rays will not exceed the random background.
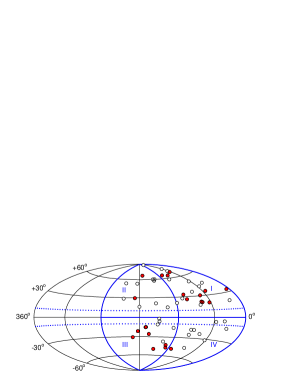
To test the data against this expectation, we have divided the sky into four regions and calculated correlation function separately in these regions. These regions were defined in the following way. First, we have separated Northern and Southern Galactic hemispheres since the Southern hemisphere is sensitive to the change from to GMF model, while the Northern is not. Second, we divided AGASA acceptance in each of these regions in halves, one and the other one , in order to separate directions to the Galactic center and to the Galactic anti-center. We enumerate these regions from I to IV, in counter-clockwise direction starting from the region , as shown in Fig. LABEL:ManuscriptTinTkach:sky.
We have found that correlations in regions II and IV are absent, while in regions I and III they are strong and have roughly equal significance characterized by the probability of chance coincidence below in each of these regions separately. In Fig. LABEL:ManuscriptTinTkach:regions we plot correlation function calculated for the sum of regions II+IV (left panel) and for the sum of regions I+III (right panel).


Calculation presented in Fig. LABEL:ManuscriptTinTkach:regions takes into account the UHECR acceptance properly. However, the observed anisotropic distribution of correlating rays may simply reflect the anisotropy in the BL Lacs distribution. To check that this is not the case we have performed the following Monte-Carlo simulation. We generated cosmic rays randomly with the distribution corresponding to the acceptance of the experiment, and recorded those rays which correlate, by chance, with any of the sources from the set of BL Lacs + unidentified EGRET sources. Having accumulated a large number of such correlating rays we counted how many of them fall into regions I, II, III and IV. Dividing by the total number of accumulated rays we found the probabilities that one correlating ray falls in any of these regions if the correlation occurs by chance. For the region I+III we found . Knowing the probability for one ray, it is straightforward to calculate the probability of any asymmetric distribution to occur by chance. In the case at hand, the real data contain 22 correlating rays with 19 situated in regions I+III. The probability to have such asymmetry by chance is . We conclude that the correlating rays are distributed highly non-uniformly.
2.3. Conclusions
The correlations between UHECR and BL Lacs substantially increase when arrival directions of cosmic rays are corrected for GMF. This implies that: i) cosmic rays of highest energies contain a substantial fraction of protons ii) extragalactic magnetic fields have little effect on propagation of UHECR from BL Lacs iii) the Galactic magnetic field model is roughly correct at least in some directions.
The fact that UHECRs correlating with BL Lacs are not distributed over the sky isotropically is an independent evidence of the connection between UHECR and BL Lacs. The non-uniformity of the distribution of correlating rays may be due to several factors: (1) anisotropy of extragalactic magnetic fields at scales of order Mpc; (2) poor knowledge of the Galactic magnetic field in some areas of the sky; (3) fluctuations in the space distribution of the closest sources. At present, it is not possible to tell which of these factors dominate. In the future, they can be distinguished by studying e.g. the dependence of the distribution of correlating UHECRs on energy. However, there are hints already that at least partly this effect is due to poor knowledge of the Galactic magnetic field. Studying the signs of Faraday rotation measures on the map presented in Ref. [6], we found that in regions I, III and IV the direction of the magnetic field as given by Eqs. (LABEL:ManuscriptTinTkach:Bt)-(LABEL:ManuscriptTinTkach:GMF_par) is correct (this does requires the use of the antisymmetric in z, dipole type model). However, in the region II, were correlations are absent, the direction of the field should be opposite.
The distribution of arrival directions suggests that the bulk of UHECR of moderate energies are protons accelerated in BL Lacs. The numerical simulations of UHECR energy spectrum in this model is consistent with the data except for highest energy AGASA events [14]. If absence of the GZK cutoff is confirmed in the future, it will have to be explained by a separate component which starts to dominate at energies eV. At present, the correlation analysis of arrival directions tells nothing about the nature of this component because of low statistics.
Acknowledgements
The authors are indebted to M. Teshima for useful discussions. The work of P.T. is supported in part by the Swiss National Science Foundation, grant 20-67958.02.
3. References
1. Afanasiev B. N. et al. 1996, in Proc. Int. Symp. on Extremely High Energy Cosmic Rays: Astrophysics and Future Observatories, Ed. by Nagano, p.32
2. Berezinsky V. S., Bulanov S. V., Dogiel V. A., Ginzburg V. L., Ptuskin V. S. 1990, Astrophysics of Cosmic Rays (Amsterdam: Elsevier)
3. Biermann P. L., Strittmatter P. A. 1987, ApJ 322, 643
4. Dubovsky S. L., Tinyakov P. G., Tkachev I. I. 2000, Phys. Rev. Lett. 85, 1154
5. Gorbunov D. S., Tinyakov P. G., Tkachev I. I., Troitsky S. V. 2002, Ap. J. 577, L93
6. Han J. L., Manchester R. N., Berkhuijsen E. M., Beck R. 1997, Astron. Astrophys. 322, 98
7. Hayashida N. et al. 1999, Astrophys. J. 522, 225
8. Hayashida N. et al., astro-ph/0008102
9. Tinyakov P. G., Tkachev I. I. 2001, JETP Lett. 74, 1
10. Tinyakov P. G., Tkachev, I. I. 2001, JETP Lett. 74, 445
11. Tinyakov P. G., Tkachev, I. I. 2002, Astropart. Phys. 18, 165
12. Uchihori Y. et. al. 2000, Astropart. Phys. 13, 151
13. Véron-Cetty M.-P., Véron P. 2001, A&A 374, 92
14. Berezinsky V., A. Z. Gazizov, S. I. Grigorieva 2001, astro-ph/0210095