Neutrinos from Accreting Neutron Stars
Abstract
The magnetospheres of accreting neutron stars develop electrostatic gaps with huge potential drops. Protons and ions, accelerated in these gaps along the dipolar magnetic field lines to energies greater than 100 TeV can impact onto the surrounding accretion disc. A proton-induced cascade develops, and charged pion decays produce -emission. With extensive disc shower simulations using dpmjet and geant4, we have calculated the resulting -spectrum. We show that the spectrum produced out of the proton beam is a power law. We use this result to propose accretion-powered X-ray binaries (with highly magnetized neutron stars) as a new population of point-like -sources for km-scale detectors such as ICECUBE. As a particular example we discuss the case of A0535+26. We show that ICECUBE should find A0535+26 to be a periodic -source, one for which the formation and loss of its accretion disc can be fully detected. Finally, we briefly comment on the possibility that smaller telescopes, like AMANDA, could also detect A0535+26 by folding observations with the orbital period.
Subject headings:
X-ray binaries: general, gammarays: theory, gammarays: observations, neutrinos: observations, X-ray binaries: A0535+261. Introduction
X-ray binaries have fascinated those looking for Galactic neutrino sources (e.g. Berezinsky et al. 1985, Kolb et al. 1985, Gaisser and Stanev 1985). The basic idea is to use somehow the secondary object in the system to accelerate protons, which then could collide within a higher density medium. One possibility that was earlier explored was to use the primary itself as the target for those accelerated hadrons (Berezinsky et al. 1990). Depending on the grazing angle of the colliding protons, on the size and type of the primary star, and on the effectiveness of the acceleration mechanism, -rays and neutrinos (or s) could escape from the system. -rays, however, could more naturally be produced in the accretion disc surrounding the neutron stars; detailed models for this possibility were presented by Cheng and Ruderman (1989). Herein, we show that accreting X-ray binaries in which the compact object is a magnetized neutron star are sources of high energy neutrinos that can be detected by forthcoming neutrino telescopes. Moreover, we show that the signal-to-noise ratio can be high enough as to allow timing studies and multiwavelength comparison.
2. The accretion disc of A0535+26
Of all the X-ray binaries, A0535+26 is one of the most studied. A0535+26 is a Be/X-ray transient where the compact object is a 104 second pulsar in an eccentric orbit around the B0III star HDE 245770. Be stars are rapidly rotating objects that eject mass, irregularly forming gaseous discs in their equatorial planes. Strong and recurrent X-ray outbursts were observed separated by 111 days, which has been identified with the orbital period (Giovannelli and Sabau Graziati 1992). These outbursts occur when the accretion onto the neutron star increases at periastron passage. (The average ratio of the X-ray luminosity at the periastron to that of apoastron is , Janot-Pacheco et al. 1987.) The BATSE instrument of the Compton Gamma Ray Observatory detected a 33-day, broad, quasi-periodic oscillation in the power spectra of the X-ray flux, definitively showing that an accretion disc is formed during giant outbursts (Finger et al. 1996). The -ray light curve maximum for this object is anti-correlated with X-rays at periastron passage (Hartman et al. 1999, Romero et al. 2001). To explain this anti-correlation, a variation in the disc grammage is invoked: when the disc is fully formed, and the X-ray luminosity is at its maximum, the disc grammage is too high as to allow -ray photons above 100 MeV to escape. We now describe how the accretion disc model works.
Accretion discs can penetrate the stellar magnetospheres of accreting rotating neutron stars (Ghosh and Lamb 1979). This penetration creates a broad transition zone between the unperturbed disc flow —far from the star— and the co-rotating magnetospheric flow —close to the star. In the transition zone, with inner radius , the angular velocity is Keplerian. Between and the co-rotation radius there is a thin boundary layer where the angular velocity significantly departs from the Keplerian value. At the disc is disrupted by the magnetic pressure and the accreting mass is channelled by the field to impact onto the stellar surface, producing strong X-ray emission.
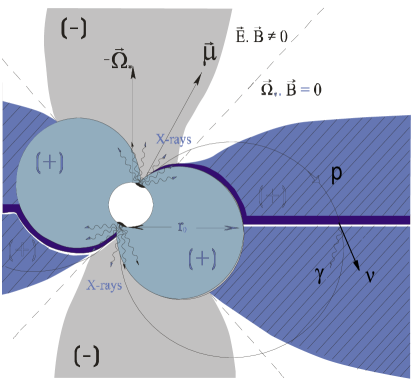
The magnetosphere of an accreting neutron star spinning slower than that of the accretion disc can be divided into three regions: i) a region coupled to the star by the magnetic field lines that do not penetrate the disc, ii) an equatorial region linked to the disc by the field attached to it, and iii) a gap entirely empty of plasma separating both regions (Cheng and Ruderman 1989). The magnetospheric region penetrated by field lines which do not intersect the disc co-rotates with the star at an angular velocity . When the angular velocity of the disc exceeds the angular velocity of the star (), the equatorial plasma between the inner accretion disc radius and the Alfvén radius co-rotates with the disc to which it is linked by the frozen field lines. Inertial effects result in a charge separation around the “null surface”, . This leads to the formation of an electrostatic gap, with no charge (see Fig. 1). In this gap , and a strong potential drop is established. The maximum potential drop along the magnetic field lines through the gap is (Cheng and Ruderman 1989)
| (1) |
where is the neutron star mass (Giovannelli and Sabau Graziati 1992), is its radius, is the magnetic field of the star, is the X-ray luminosity in units of erg s-1, and is twice the ratio between the inner accretion disc radius and the Alfvén radius. The Alfvén radius for spherical accretion can be determined from the condition that the unscreened magnetic energy density of the stellar field becomes comparable to the kinetic energy density of the accreting matter (Cheng and Ruderman 1989),
| (2) |
The electrostatic gap hovers on the accretion disc from the innermost disc radius, up to a distance of about . Without loss of generality we can assume that the stellar magnetic dipolar moment () that induces –field lines across the disc is aligned with the rotation axis of the system (Cheng and Ruderman 1991). The –field on the disc, however, strongly depends on the screening factor generated by currents induced in the disc surface. In what follows, we take a mean –field of 6000 G (Ghosh and Lamb 1979b).
Protons entering into the gap from the stellar co-rotating region are accelerated up to energies and directed to the accretion disc by the field lines. The maximum current that can flow through the gap can be determined from the requirement that the azimuthal magnetic field induced by the current does not exceed that of the initial magnetic field (Cheng and Ruderman 1989)
| (3) |
The mean number of protons impacting the disc is huge, s-1, and the total power deposited by the proton beam in the disc is erg s-1. The collision of the relativistic proton beam with the disc initiates hadronic and electromagnetic showers, in which high energy s are produced from decay of charged pions, whereas -rays are produced from the decay of their neutral partners.
3. Phenomenology
The system just described is an ideal source of high energy s: It has a very dense material for –interactions, and, at the same time, the region of acceleration is separated from that of high density, where interactions occur. The high energy -production in accretion discs of neutron stars is, however, subject to very stringent conditions on the disc grammage. The latter should be large enough as to allow protons to interact, and small enough as to allow pions to decay or to escape, so as to avoid losing energy. But the disc grammage is actually a periodically varying function in these systems, which follows the orbital dynamics. As noted, this fact was used to explain why X-ray maximum is coincident with a non-detection in the -ray band for the system A0535+26 (Romero et al. 2001). An examination of the cross sections involved is in order.
In the energy range of interest, the cross section, mb (Carroll et al. 1979), is not too far away from the cross section for -ray absorption in the Coulomb field produced by disc ions, (Cox et al. 2001, Bethe and Heitler 1934). Then, photons with energies MeV undergo interactions within typical accretion discs if the mean density of hydrogen is cm-3 (the survival probability for ’s to a distance comparable to the thickness of the disc due to this process is less than 0.1%). Moreover, assuming a source luminosity in the form of keV photons and an average disc radius of cm, the energy density inside the disc is roughly , implying a number density of 1 keV photons . Therefore, the secondary electrons and -rays most effectively interact with the radiation field of the disc. These secondary electrons originating from decays of neutral and charged pi-mesons will trigger an electromagnetic cascade in this field resulting to a standard cascade spectrum with a cutoff energy around , where is the mass of the electron and is the average energy of the background thermal photons.
According to canonical accretion disc models, the average density scales as (Shapiro and Teukolsky 1983). We normalize the particle density of the accretion disc at in order to fit -ray observations of A0535+26 (strong photon absorption in the periastron of the system, where , Finger et al. 1996). Because of the similarity in the cross sections discussed above, whenever -rays are absorbed, there will be a much reduced signal in s. Otherwise stated, the hadronic shower will also cool down to sub-100 GeV energies. But as the disc density is a function of the position in the orbit, before and after periastron passage, there are orbital configurations prone to the emission of both, high energy photons and neutrinos.
To simplify the discussion and get a numerical example of the processes involved, we set the half thickness of the disc to a constant ( cm) and consider an orbital configuration for which , before or after periastron passage. The cross section for interactions is mb (Battiston et al. 1992). Then, the probability for a interaction to take place within the disc is , where is the mean free path of the relativistic protons. It is worthwhile to point out that even though the photon and particle densities are similar, the cross section is two order of magnitude smaller than the cross section.
On the other hand, the pion mean free path in this configuration is cm, which implies a charged pion survival probability —to its decay distance— of where is the lifetime, and is its Lorentz factor. Then, the probability for producing s of energy: 200 GeV and 400 GeV is —on average— 10% and 1%, respectively. We expect a rapidly fading signal of neutrinos with energies greater than 1 TeV.
There appears to be enough room for the disc density (or grammage) to acquire values such that all protons will partake in hadronic interactions, whereas some of the pions produced will decay to high energy neutrinos at a level significant enough as to show up in neutrino telescopes. To analyze this in detail, numerical simulations of a proton-induced cascade unfolding within an accretion disc were performed.
4. Numerical Simulations
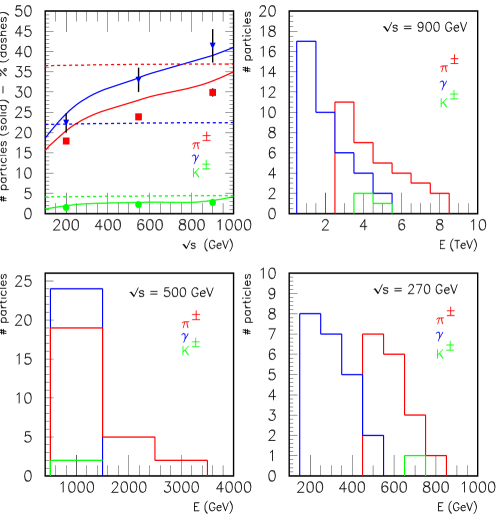
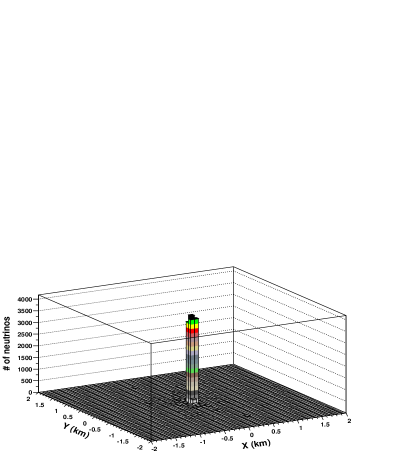
The accretion disc itself is simulated as a cylindrical volume of thickness and is filled with elemental hydrogen at a density cm-3. A 400 TeV value is retained as the average energy of each proton in the beam even for , because the uncertainties in all other parameters involved dilute the deviation from the fiducial result. The generation and tracking of secondary particles in the cascade development was performed using geant4: a simulation toolkit (designed for operation up to center-of-mass energies GeV) that provides general-purpose tools for the simulation of the passage of particles through matter (Agostinelli et al. 2002). We process the initial hadronic collisions (with GeV) using the event generator dpmjet-II (Ranft 1995). This program, based on the Gribov–Regge theory, describes soft particle interactions by the exchange of one or multiple Pomerons (the inelastic reactions are simulated by cutting Pomerons into color strings which subsequently fragment into color neutral hadrons). In the energy range of interest, , the average energy fraction of the highest energy baryon in the simulated collisions is roughly 30%. Therefore, on average, after three collisions, the energy of the leading particle will be degraded down to 10 TeV. The secondary meson spectra from these three collisions are given in Fig. 2. Additionally, for these center-of-mass energies, the soft baryon channel comprises 2 nucleons, each carrying (on average) 1% of the energy of the incoming proton. These secondary distributions together with the leading particle —degraded in energy— were injected into the cylindrical volume representing the disc. The position of the first interaction was selected randomly following a Poisson distribution with a mean equal to the proton mean free path. The second and third interaction points were selected with the same procedure, taking the preceding collision as reference, and going further down within the disc. We then use the geant4 to track all particles. In this second step, all hadronic collisions are processed with geant4 implementation of geisha (Fesefeldt et al. 1985), a program tuned to analyze experimental results (of a variety of projectiles and targets) in the few-GeV energy range. A magnetic field of 6000 G threads the synthetic disc volume, whose direction is pointing upwards in Fig. 1. Variations in the -field across the disc do not affect the results presented below, because most of the particles in the shower are produced in “minimum bias” events boosted in the forward direction (see Fig. 3).
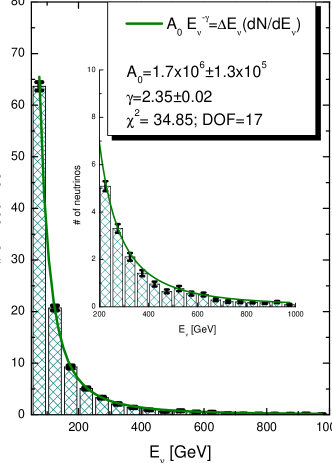
One can see in Fig. 4 the average number of s produced from pion decay per unit energy (bin size GeV). The tail of the energy distribution is very well fitted by a power-law, , with values of and given in the figure. Therefore, a monoenergetic beam of high energy protons impacting onto an accretion disc produces outgoing s with a power law spectrum.
5. The neutrino signal
Having estimated the -spectrum, we now analyze the signal-to-noise (S/N) ratio for a km-scale detector like ICECUBE (Karle et al. 2002). This detector will consist of 4800 photomultipliers, arranged on 80 strings placed at depths between 1400 and 2400 m under the South Pole ice. The strings will be located in a regular space grid covering a surface area of 1 km2. Each string will have 60 optical modules (OM) spaced 17 m apart. The number of OMs which have seen at least one photon (generated by Čerenkov radiation produced by the muon which resulted from the interaction of the incoming in the Earth’s crust) is called the channel multiplicity, . The multiplicity threshold is set to ,which corresponds to an energy threshold of 200 GeV (Alvarez-Muñiz and Halzen 2002). The angular resolution of ICECUBE will be 0.7∘, which implies a search window of 1∘ radius (Karle et al. 2002).
The event rate of the atmospheric -background that will be detected in the search bin is given by
| (4) |
where is the effective area of the detector, sr, and GeV-1 cm-2 s-1 sr-1 is the atmospheric -flux (Volkova 1980, Lipari 1993). Here, denotes the probability that a of energy , on a trajectory through the detector, produces a muon (Gaisser et al. 1995). On the other hand, the -signal is
| (5) |
where
| (6) |
is the incoming -flux, emitted by a source at a distance from Earth with beaming factor . Phenomenological estimates yield (Cheng and Ruderman 1989). The -emission spectrum is just , where can be read from the first panel of Fig. 4, and is the total number of protons impacting onto the disc. It is noteworthy that the flux of neutrinos, which is dominantly at production, is expected to be completely mixed in flavor upon arrival at Earth. Specifically, there is now strong evidence for maximal mixing among all neutrino species (Fukuda et al. 1998), which implies that the -flux would be completely mixed after a propagation distance of (Bilenky et al. 1999)
| (7) |
where eV2 is the –mass splitting. Putting all this together we obtain
| (8) |
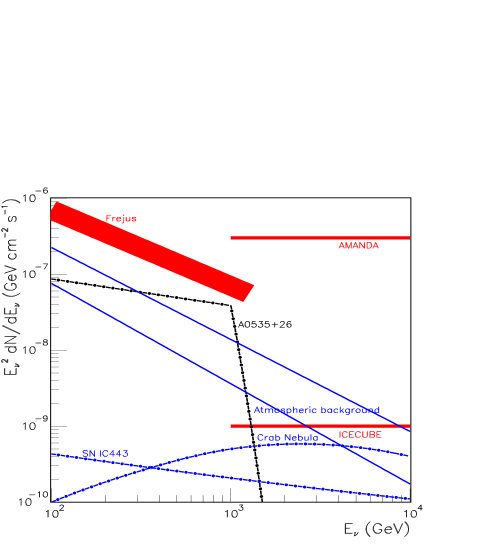
A0535+26 is very close to Earth, distant only kpc (Giovannelli and Sabau Graziati 1992). In addition, as only s going through the Earth can be identified, the northern location of this source makes it accessible from the south pole site of ICECUBE. It can be seen in Figure 5 the expected -flux from A0535+26. The atmospheric -background for a bin is indicated by the diagonal lines. Also indicated in the figure are the fluxes of several others point sources. It is clear that for , s coming from A0535+26 can dominate both over the background and over all other known sources. The S/N ratio in the range , using Eqs. (4) and (5) and considering an observing time of days, compatible with the period in which the accretion disc is forming or disappearing, is
| (9) |
It is possible, then, that A0535+26 could be detected as a variable neutrino source even within the time span of one orbital period. The possibility of detection can be further improved by adding up several orbital periods, of which there are three per year. It is therefore possible that sources like A0535+26 could have been already detected in the AMANDA data. In order to search for this possibility two all-sky maps could be used. 111We thank Rodin Porrata (LLNL) for bringing this to our attention One, adding up all observations in periods where the source is expected to be ON, before and after periastron passage. Another, adding up all observations with the source in OFF mode, at the periastron. The difference between these two maps, weighted by the respective integration times, should leave only one source on the sky, disregarding that this source in itself is well below the background for the experiment. Of course, the same technique can work for ICECUBE. A few years integration time would add up tens of orbital revolutions, and detection of A0535+26 should be unambiguous. Indeed, A0535+26 is, in projection, less than 5∘ away from the Crab Nebula, which was suggested as a potential detection by AMANDA (Barwick et al. 2002). This detection is based on a binning of the nothern hemisphere. It is not implausible, then, that A0535+26 may significantly contribute to this angular bin, particularly at energies below 1 TeV.
From a technical point of view, ICECUBE must select a soft energy cut-off to observe this source, since A0535+26 shines mostly below 1 TeV (the channel mutiplicity threshold of the experiment must be set as (Karle et al. 2002). A next generation observatory, like NEMO (Riccobene et al. 2002), would improve the angular resolution to ∘, which would increase the -ratio by a factor of three.
6. Concluding remarks
In summary, a wide range of parameters able to describe the physical situation of accreting neutron stars make them a bona-fide population of -emitters with power-law spectra. In the particular of case of A0535+26, the –flux between 300 GeV and 1 TeV overwhelm those of all other point sources, and is clearly above the atmospheric background in a angular bin. The neutrino signal will be periodic in nature. The accumulated signal during the apoastron –where there is no disc formed– and periastron passages will always be at the noise level. On the contrary, the accumulated signal during time spans before and after the periastron passage, will be, as we have shown, significantly different from noise level. A reasonable integration time for neutrinos would then secure high-confidence detections of the appearance and disappearance of the accretion disc (yr to reach a 5 effect). Complementary information from high-energy photon astronomy in the X- and -ray domain will be essential to confirm the hadronic origin of the radiation in accreting neutron star systems, as well as to study the formation and loss of accretion discs in eccentric binary systems.
References
- (1) Alvarez-Muñiz J. and Halzen F. 2002, Astrophys. J. 576, L33.
- (2) Agostinelli S. et al. [geant4 Collaboration] 2002, SLAC-PUB-9350. http://wwwinfo.cern.ch/asd/geant4/geant4.html
- (3) Ahrens J. et al. [The AMANDA Collaboration] 2002, arXiv:astro-ph/0208006.
- (4) Ansorge R.E. et al. [UA5 Collaboration], Nucl. Phys. B328, 36.
- (5) Battiston R. et al. [UA4 Collaboration] 1982, Phys. Lett. B 117, 126.
- (6) Barwick S. W. et al. [AMANDA Collaboration] 2002, arXiv:astro-ph/0211269.
- (7) Bednarek W. and Protheroe R.J. 1997, Phys. Rev. Lett. 79, 2616.
- (8) Berezinsky V.S., Bulanov S.V., Dogiel V.A., Ginzburg V.L., and Ptuskin V.S. 1990, Astrophysics Of Cosmic Rays, North-Holland.
- (9) Berezinsky V.S., Castagnoli C. and Galeotti P. 1985, Nuovo Cim. 8C, 185 [Addendum-ibid. 8C, 602, 1985].
- (10) Bethe H.A. and Heitler W. 1934, Proc. Roy. Soc. London A146, 83.
- (11) Bilenky S.M., Giunti C. and Grimus W. 1999, Prog. Part. Nucl. Phys. 43, 1.
- (12) Carroll A.S. et al. 1979, Phys. Lett. B80, 423.
- (13) Cheng K.S. and Ruderman M. 1989, Astrophys. J. 337, L77.
- (14) Cheng K.S. and Ruderman M. 1991, Astrophys. J. 373, 187.
- (15) A. N. Cox (Editor) 2001, Astrophysical Quantities, Fourth Edition, Springer-Verlag, New York, p.213-214.
- (16) H. Fesefeldt 1985, PITHA-85-02, CERN-DD-EE-81-1, CERN-DD-EE-80-2.
- (17) Finger M.H., Wilson R.B. and Harmon B.A. 1996, Astrophys. J. 459, 288.
- (18) Y. Fukuda et al. [Super-Kamiokande Collaboration] 1998, Phys. Rev. Lett. 81, 1562.
- (19) Gaisser T.K. and Stanev T. 1985, Phys. Rev. Lett. 54, 2265.
- (20) Gaisser T.K., Halzen F. and Stanev T. 1995, Phys. Rept. 258, 173 [Erratum-ibid. 271, 355 (1996)].
- (21) Gaisser T.K., Protheroe R.J. and Stanev T. 1998, Astrophys. J. 492, 219.
- (22) Ghosh P. and Lamb F.K. 1979, Astrophys. J. 232, 259.
- (23) Ghosh P. and Lamb F.K. 1979b, Astrophys. J. 234, 296.
- (24) Giovannelli F. and Sabau Graziati L. 1992, Space Sci. Rev. 59, 1.
- (25) Hartman R. C. et al. [EGRET Collaboration], Astrophys. J. Suppl. 123, 79 (1999).
- (26) Hill G.C. et al. [the AMANDA Collaboration] 2001, arXiv:astro-ph/0106064.
- (27) Janot-Pacheco E., Motch C. and Mouchet M. 1987, Astron. Astophys. 177, 91.
- (28) Karle A. [the IceCube Collaboration] 2002, arXiv:astro-ph/0209556.
- (29) Kolb E.W., Turner M.S. and Walker T.P. 1985, Phys. Rev. D 32, 1145 [Erratum-ibid. D 33, 859 (1986)].
- (30) Lipari P. 1993, Astropart. Phys. 1, 195.
- (31) Ranft J. 1995, Phys. Rev. D 51, 64.
- (32) Riccobene G. [NEMO Collaboration] 2001, Hamburg DESY - DESY-PROC-2002-01. Published in “Hamburg 2001, Methodical aspects of underwater/ice neutrino telescopes”, p.61.
- (33) Rhode W. et al. [Frejus Collaboration] 1996, Astropart. Phys. 4, 217.
- (34) Romero G.E., Kaufman Bernado M.M., Combi J.A. and Torres D.F. 2001, Astron. Astrophys. 376, 599.
- (35) Shapiro S.L. and Teukolsky S.A. 1983, Black Holes, White Dwarfs, and Neutron Stars (New York: John Wiley and Sons).
- (36) Volkova L.V. 1980, Sov. J. Nucl. Phys. 31, 784 [Yad. Fiz. 31, 1510 (1980)].