Has the GZK suppression been discovered?
Abstract
The energy spectra of ultra high energy cosmic rays reported by the AGASA, Fly’s Eye, Haverah Park, HiRes, and Yakutsk experiments are all shown to be in agreement with each other for energies below eV (after small adjustments, within the known uncertainties, of the absolute energy scales). The data from HiRes, Fly’s Eye, and Yakutsk are consistent with the expected flux suppression above eV due to interactions of cosmic rays with the cosmic microwave background, the Greisen-Zatsepin-Kuzmin (GZK) suppression, and are inconsistent with a smooth extrapolation of the observed cosmic ray energy spectrum to energies eV. AGASA data show an excess of events above eV, compared to the predicted GZK suppression and to the flux measured by the other experiments.
and ††thanks: E-mail: jnb@sns.ias.edu ††thanks: E-mail: waxman@wicc.weizmann.ac.il
(a)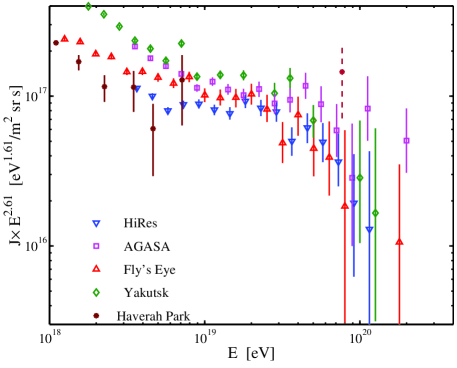
(b)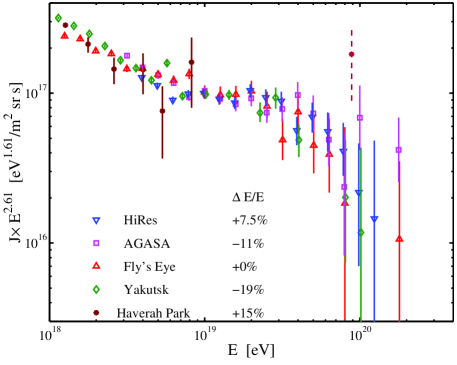
1 Introduction
We analyze the observed spectrum of ultra-high energy cosmic rays. We find two main results: (i) The energy spectra reported by the AGASA, Fly’s Eye, Haverah Park, HiRes and Yakutsk experiments are all in good agreement for energies below eV, and (ii) All the data are consistent with a GZK suppression except for the AGASA points above eV. Our principal conclusion from these two results is that standard physics, including the GZK suppression, is sufficient to explain all of the existing data on UHE cosmic rays.
For any theoretical model in which the GZK suppression is present, the assumed intrinsic spectrum produced by the UHE cosmic-ray sources influences the energy spectrum predicted by the model. Our conclusion that the data are consistent with a GZK suppression implies that the observed spectrum is consistent with model predictions for a plausible intrinsic energy spectrum. In particular, we show that the observed spectrum is consistent with that expected for a GZK suppression of the flux produced by a simple cosmological distribution of sources, each source producing high energy protons with a spectrum characteristic for collisionless shock acceleration.
Before entering into any details, we will summarize and compare in this introduction the data that are available from different collaborations that measure the spectrum of ultra high energy cosmic rays.
1.1 Summary of available data
Figure 1 is a ”Before-After” figure of the currently available data on the highest energy cosmic rays (energies eV). In Figure 1a (the ”Before” version of the figure), the data are plotted, together with their flux error bars, as they have been published by the five experimental collaborations: AGASA [1], Fly’s Eye [2], Haverah Park [3], HiRes [4], and Yakutsk [5]. The Haverah Park data have recently been re-analyzed using modern numerical simulations of air-shower development [3]. The reanalysis resulted in significant changes of inferred cosmic-ray energies compared to previously published results ([6] and references quoted therein). The data points for the Haverah Park measurements that are shown in Fig. 1 are based on this improved analysis, which is available only at energies eV111A single flux point at eV is shown in Figure 1a, but this point is based on a preliminary analysis of 4 events that are chosen by different cuts than those applied for the lower energy data. The energy uncertainty for the point at eV is significantly larger than the estimated uncertainties for lower energy points [3]. Therefore, the point at eV is shown in Figure 1a only for completeness; it is not used elsewhere in our analysis because the Haverah Park collaboration has described this point as preliminary..
The most striking feature of Figure 1a is that the experimental results differ greatly among themselves (by factors ) even in the region eV eV, where the quoted error bars from each experiment are very small. In addition, the higher AGASA flux reported above eV stands out above the scatter in the different experimental measurements.
Figure 1b (the ”After” version of our ”Before-After” figure) shows a dramatically different representation of the available data. With small adjustments in the absolute energy scales, all of the measured fluxes are seen to be in agreement at energies below eV. In constructing Figure 1b, we have adjusted the absolute energy calibrations within the error bars published by the experimental collaborations. We chose the shifts so as to bring the different measured fluxes into agreement at eV. The energy shifts can be accomplished in five equivalent ways, depending upon which one of the five energy scales is unaltered. For Figure 1b, the Fly’s Eye energy scale was unaltered and we adjusted the AGASA energy scale by -11%, Haverah Park by +15%, HiRes by +7.5%, and Yakutsk by -19%. All shifts are well within the published systematic errors.
Figure 1 illustrates visually our two main points. First, all of the currently available data on high energy cosmic rays are in agreement within their quoted errors for energies between eV and eV. Second, three of the four data sets available above eV, HiRes, Fly’s Eye, and Yakutsk, all show evidence for a turnover of the energy spectrum for energies above eV. This turnover, we shall show later, is highly significant statistically and is consistent with what one would expect from a simple model that includes the GZK effect. Above eV, the reported AGASA fluxes are higher than the fluxes measured in other experiments. It is these high AGASA fluxes alone that have led to the widespread impression that measurements of ultra-high energy (UHE) cosmic rays (energies eV) do not show evidence for a GZK effect.
1.2 What does it all mean?
What can one make of the results shown in the Before-After Figure 1? There are two simple possibilities. First, the excellent agreement shown in Figure 1b among the different experiments could be accidental. According to this interpretation, the small adjustments made in the energy scales are not physically motivated and the real situation is somehow much more complicated. It is just a fluke that all of the adjusted energy spectra line up together so well below eV. This interpretation is certainly possible. In the present paper, however, we shall choose a different interpretation of Figure 1b. We shall suppose that the excellent agreement of the adjusted energy spectra reveals a good approximation to the true shape of the UHE cosmic ray energy spectra. We shall now explore the consequences of this assumption.
We stress that the distinction between the two possibilities for interpreting Figure 1b can only be settled by a new generation of precise and high statistics measurements of the UHE cosmic ray spectrum. Fortunately, the Auger experiment, currently under construction [7], is expected to provide the necessary precision and statistics. The Telescope Array experiment [8], currently under planning, may also provide similar precision and statistics.
2 A simple two-component model
We describe in this section a simple two-component model for the energy spectrum of the highest energy cosmic rays. The Galactic component is taken from observations of the Fly’s Eye group. The two input parameters for the extra-galactic component (the rate of energy deposition in cosmic rays and the shape of the initial spectrum) were originally suggested by the idea [9, 10, 11] that gamma-ray bursts (GRBs) are the source of UHE cosmic rays. However, any postulated cosmologically distributed source of cosmic rays with a similar energy production rate and energy spectrum (Eq. 1 and 2 below) would yield agreement with the observations.
In order to avoid the risk of being misled by ”curve fitting”, we use the same theoretical model that was discussed in 1995 [12]. We assume that extra-galactic protons in the energy range of eV to eV are produced by cosmologically-distributed sources at a rate
| (1) |
with a power law differential energy spectrum
| (2) |
We shall refer to this energy spectrum as “the extra-galactic component” in order to emphasize that the fit to the data is generic, independent of the type of source that generates the assumed energy and spectrum. An energy spectrum similar to the assumed energy spectrum, Eq. (2), has been observed for non-relativistic shocks [13] and for relativistic shocks [14] shocks. This power law is produced by Fermi acceleration in collisionless shocks [13], although a first principles understanding of the process is not yet available (see, e.g. Ref. [15] for a discussion of alternative shock acceleration processes).
We can use Eq. (1) and Eq. (2) to obtain a value for the cosmological rate, , at which energy in the form of high energy protons is being produced. Integrating between eV and eV and setting the result equal to the value given in Eq. (1), we find the proportionality constant in Eq. (2). Thus .
Energy losses due to pion or pair production are included in the transport calculations in the usual continuous approximation. Energy loss due to the cosmological redshift is significant for energies eV, and is also taken into account. The choice of cosmological model is unimportant for cosmic ray energies above eV, which is the region of interest. We assume, for definiteness, a flat universe with and , and Hubble constant . For consistency with our earlier derivation of the upper bound on neutrino fluxes that follows from the observed cosmic ray spectrum [16], we assume that the source density evolves with redshift like the luminosity density evolution of QSOs [17], which may be described as with [18] at low redshift, , for , and an exponential decay at [19]. This functional form of is also similar [17] to that describing the evolution of star formation rate [20], and also believed to describe the redshift evolution of GRB rate (see, e.g. [21] for review). As mentioned above, the choice of redshift evolution does not affect the spectrum above eV.
The cosmic-ray spectrum flattens at eV [2, 1]. There are indications that the spectral change is correlated with a change in composition, from heavy to light nuclei [2, 22, 23]. These characteristics, which are supported by analysis of Fly’s Eye, AGASA and HiRes-MIA data, and for which some evidence existed in previous experiments [6], suggest that the cosmic ray flux is dominated at energies eV by a Galactic component of heavy nuclei, and at UHE by an extra-Galactic source of protons. Also, both the AGASA and Fly’s Eye experiments report an enhancement of the cosmic-ray flux near the Galactic disk at energies eV, but not at higher energies [24].
We therefore add an observed Galactic component,
| (3) |
to the extra-galactic spectrum component given in Eq. (2). The shape of the energy spectrum of the Galactic component, Eq. (3), was derived by the Fly’s Eye collaboration [2].
The observed spectrum between eV to eV is, in this model, the combination of two different source spectra. First, the cosmological distribution of sources generates an spectrum (see Eq. 2), which energy losses due to interactions with the CMB steepen to an observed spectrum that is a bit shallower than . Second, the Fly’s Eye fit to the Galactic heavy nuclei component makes a small contribution at energies eV and is steeper than . We will now compare the model spectrum produced by these two sources with the cosmic ray observations.
3 Comparison of Model with Cosmic Ray data.
(a)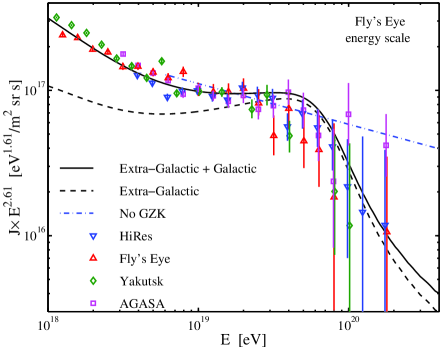
(b)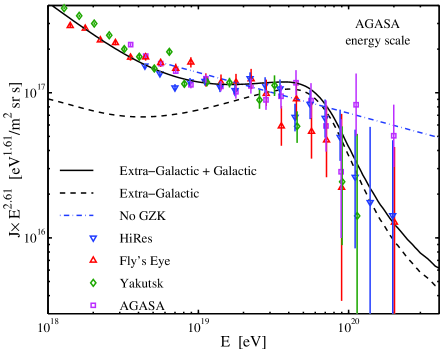
(c)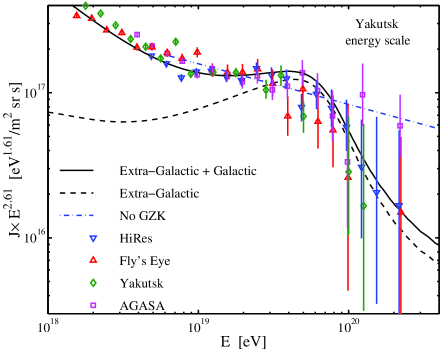
Figure 2 compares the model prediction with the data from the AGASA [1], Fly’s Eye [2], Hires [4], and Yakutsk [5] cosmic ray experiments. In order to demonstrate that our results are insensitive to the choice of absolute energy scale, we present results for three different choices of the absolute energy scale: adopting the Fly’s Eye, the AGASA or the Yakutsk energy calibration. The three best fit (solid) curves correspond to energy generation rates (see Eq. 1) of and spectral indices, (see Eq. 2) of for the {Fly’s Eye, AGASA, Yakutsk} energy scales, respectively.
3.1 Good agreement below eV
The model predictions are in good agreement with the data of all experiments in the energy range eV to eV, a region in which the extra-galactic component is predicted to be dominant. Since the Fly’s Eye representation of the Galactic component is intended to describe the lower energies, it is not surprising that the model results are also in good agreement with the observed spectrum for energies below eV.
A ”-by-eye” comparison of the model to the data shown in Figures 2 appears to indicate a quantitatively good fit, but we cannot simply compute a formal fit due to the uncertainties in the absolute energy calibration. Instead, we compare the variance of model predictions from the combined AGASA, Fly’s Eye, HiRes and Yakutsk data sets () with the variance of AGASA, Fly’s Eye, Haverah Park, and Yakutsk data sets from the HiRes data set (). Let where is the predicted average number of events in the -th energy bin of the -th experiment and is the number of bins. Also, let , where is the predicted average number of events (for AGASA, Fly’s Eye and Yakutsk) in a model where the HiRes value is the average number of events. We find with data points, and with data points for all three choices of the absolute energy scale (panels a, b or c). The different experiments are in agreement with each other and with the model in the energy range eV to eV.
3.2 What is happening above eV?
| Energy Scale | Expected | Observed |
|---|---|---|
| Fly’s Eye | 34 | 4 |
| AGASA | 40 | 6 |
| Yakutsk | 46 | 6 |
Above eV, Fig. 2 shows that the Fly’s Eye, HiRes and Yakutsk experiments are in agreement with each other and the model. However, the eight AGASA events with energies greater than eV disagree with the prediction of the cosmological model (defined by Eq. 1 and Eq. 2), including the GZK suppression. The Fly’s Eye, Yakutsk and HiRes experiments have a combined exposure three times that of the AGASA experiment. The exposures above eV are, in units of : AGASA (1.3), Fly’s Eye (0.9), Yakutsk (0.9), and HiRes (2.2). Together, Fly’s Eye, Yakutsk, and Hi-Res observe a total of 6 events above eV (4 events if the Fly’s Eye energy scale is chosen).
Assuming no GZK suppression, Table 1 compares the expected number of events above eV with the number of events observed in the combined Fly’s Eye, HiRes, and Yakutsk exposure. The differential energy spectrum observed by the various experiments at the energy range of eV to eV can be fitted by a broken power-law, where the shallower component dominating above eV satisfies (see table V and Eq. 43 in [25]). The expected number of events in the absence of a GZK suppression was calculated by assuming that the cosmic ray spectrum follows the power law also at energies eV. Thus there is a deficit beyond eV relative to the extrapolated lower-energy spectral energy distribution. Adopting the steepest allowed slope, , the expected number of events is {21,25,30}, implying a deficit beyond eV .
4 Discussion.
Our most important conclusion is that exotic new physics is not required to account for the observed events with energies in excess of eV, except for the AGASA data. Table 1 shows that there is already a strong suggestion, (, depending upon the extrapolated energy spectrum) in the Fly’s Eye, HiRes, and Yakutsk observations that the expected GZK suppression has been observed (see also Fig. 1 and Fig. 2).
Precision measurements from eV to eV are essential for testing models of UHE cosmic rays, although they are less dramatic than measurements above eV. At energies eV, the predicted number, , of events in conventional models is uncertain due to the unknown clustering scale, , of the sources, [26]. Paradoxically, we may need to study carefully cosmic rays with energies below the GZK suppression in order to understand better the origin of the cosmic rays beyond the suppression.
Acknowledgments
We are grateful to M. Teshima for valuable comments. JNB acknowledges NSF grant No. 0070928 and the WIS Einstein Center for hospitality. EW thanks the IAS for hospitality. EW is the incumbent of the Beracha foundation career development chair.
References
- [1] M. Takeda et al., Phys. Rev. Lett. 81 (1998) 1163; N. Hayashida et al., Astrophys. J. 522 (1999) 225 and astro-ph/0008102.
- [2] D.J. Bird et al., Phys. Rev. Lett. 71 (1993) 3401; D.J. Bird et al., Astrophys. J. 424 (1994) 491.
- [3] J. Hinton et al., Proc. Ultra High Energy Particles from Space, Aspen 2002 (http://hep.uchicago.edu/ jah/aspen/aspen2.html).
- [4] T. Abu-Zayyad et al., astro-ph/0208243.
- [5] N.N. Efimov et al., in the Proceedings of the International Symposium on Astrophysical Aspects of the Most Energetic Cosmic-Rays, edited by M. Nagano and F. Takahara (World Scientific, Singapore 1991), p. 20.
- [6] A.A. Watson, Nuc. Phys. B (Proc. Suppl.) 22 (1991) 116.
- [7] J.W. Cronin, Nucl. Phys. B (Proc. Suppl.) 28 (1992) 313.
- [8] M. Teshima et al., Nucl. Phys. B (Proc. Suppl.) 28 (1992) 169.
- [9] E. Waxman, Phys. Rev. Lett. 75 (1995) 386.
- [10] M. Vietri, Astrophys. J. 453 (1995) 883.
- [11] M. Milgrom and V. Usov, Astrophys. J. Lett. 449 (1995) L37.
- [12] E. Waxman, Astrophys. J. Lett. 452 (1995) L1.
- [13] R. Blandford, D., Eichler, Phys. Rep. 154 (1987) 1; J. Bednarz, M. Ostrowski, Phys. Rev. Lett. 80 (1998) 3911; A. Achterberg et al., MNRAS 328 (2001) 393.
- [14] E. Waxman, Astrophys. J. 485 (1997) L5.
- [15] J. Arons, M. Tavani, Astrophys. J. Supp. Series 90 (1994) 797.
- [16] J.N. Bahcall, E. Waxman, Phys. Rev. D 64 (2001) 023002.
- [17] B.J. Boyle, R.J. Terlevich, MNRAS 293 (1998) L49.
- [18] P.C. Hewett, C.B. Foltz, F. Chaffee, Astrophys. J. 406 (1993) 43.
- [19] M. Schmidt, D.P. Schneider, J.E. Gunn, Astron. J. 110 (1995) 68.
- [20] S.J. Lilly, O. Le Fevre, F. Hammer, D. Crampton, Astrophys. J. 460 (1996) L1; P. Madau, H.C. Ferguson, M.E. Dickinson, M. Giavalisco, C.C. Steidel, A. Fruchter, MNRAS 283 (1996) 1388.
- [21] P. Mészáros, Science 291 (2001) 79.
- [22] T.K. Gaisser et al., Phys. Rev. D 47 (1993) 1919; B.R. Dawson, R. Meyhandan, K.M. Simpson, Astropart. Phys. 9 (1998) 331.
- [23] T. Abu-Zayyad et al., Astrophys. J. 557 (2001) 686.
- [24] D.J. Bird et al., Astrophys. J. 511 (1998) 739; N. Hayashida et al., Astropart. Phys. 10 (1999) 303.
- [25] M. Nagano, A.A. Watson, Rev. Mod. Phys. 72 (2000) 689.
- [26] J.N. Bahcall, E. Waxman, Astrophys. J. 542 (2000) 542.