hep-ph/0205261 CERN–TH/2002–109 IFUP–TH/2002–22
Which solar neutrino data favour the LMA solution?
A. Strumiaa,b, C. Cattadoric,d, N. Ferraric, F. Vissanic
aDipartimento di Fisica dell’Università di Pisa and INFN
bTheoretical Physics Division, CERN, CH-1211 Genève 23, Suisse
cINFN, Laboratori Nazionali del Gran Sasso, I-67010 Assergi (AQ), Italy
dINFN Sezione di Milano, Via Celoria 16, I-20133 Milano, Italy
Abstract
Assuming neutrino oscillations, global analyses of solar data find that the LOW solution is significantly disfavoured, leaving LMA as the best solution. But the preference for LMA rests on three weak hints: the spectrum of earth matter effects (Super-Kamiokande sees an overall day/night asymmetry only at ), the Cl rate (but LMA and LOW predictions are both above the measured value), the Ga rate (newer data decrease towards the LOW predictions both in GNO and SAGE). Only new data will tell us if LMA is the true solution.
The recent SNO results [1] give a evidence for appearance of and increase the confidence in the standard solar model prediction for the Boron flux. There is also an indirect impact of these results on the determination of the true oscillation solution, when they are combined with the other solar data [2]; this suggests that the LMA solution is significantly favoured. The question at stake is whether present data already ensure the success of the research program of KamLAND (that can see a clean signal in the LMA region), or if we will measure the oscillation parameters only after BOREXINO (that can see clean signals in the LOW or (Q)VO regions).
The global analyses of solar data agree that the LMA solution is significantly favoured. It is clear why small-mixing-angle and purely-sterile oscillations are ‘extremely disfavoured’ or ‘excluded’. E.g., SMA predicts where is a constant at energies probed by Super-Kamiokande (SK), and consequently a distortion of the energy spectrum, that is contradicted by the observations. If SMA or sterile were the true solution, some well defined experimental result has to be wrong.
It is less clear which data significantly disfavour LOW. Indeed, no data would be contradicted if LOW were the true solution, as we now discuss. The SK and SNO rates alone cannot discriminate the two solutions: in both cases it is possible to obtain at . After ensuring this value, the various global analyses (that use slightly different sets of data and estimation of errors, and do not include the recent GNO rate [3]) obtain the best-fit difference
as the result of a combination of 3 different pieces of data: (1) the energy and zenith-angle spectrum at SK and SNO, (2) the Chlorine rate, and (3) the Gallium rate. Each of them only weakly prefers LMA to LOW, and when we combine all data together, a strong preference for LMA emerges. It is not possible to fully isolate the relative importance of the 3 data, since the best-fit points result from an interplay of all of them, in which a compromise is reached between obtaining a good fit of the rates, and avoiding too large spectral and day/night effects. However, when we remove from our fit111The present fit is performed as in [5]. It takes into account the Chlorine and Gallium rates, the full zenith angle and energy spectrum from SK (using instead the older day/night spectra LOW would be less disfavoured) and the NC and CC rate from SNO (not neglecting anti-correlations and spectral distortions). We do not include the SNO energy spectrum (an approximated analysis shows that it does not significantly affect any of our result of the fit in the LMA, LOW, SMA, (Q)VO regions). Up to updates and minor improvements, errors on cross-sections and solar model predictions (we use the BP00 model [10]) are computed following [11]. Survival probabilities in the sun are computed using the accurate approximations from [12]. Earth matter effects are computed in the mantle/core approximation, improved by using the average density appropriate for each trajectory as predicted in [13]. one of the 3 data previously listed, the value that we get diminishes to , , and .
 |
The energy and zenith-angle spectrum
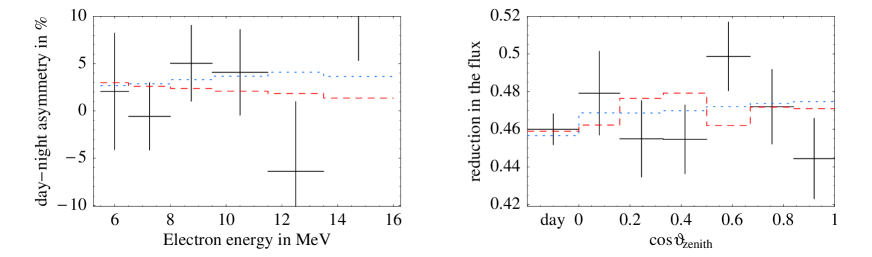
SK and SNO data do not show a statistically significant hint for earth matter effects or for spectral distortions of Boron neutrinos. The overall day/night asymmetries are at SK and in CC events at SNO. Both LMA and LOW can fit the overall day/night asymmetry, but they predict a different energy and zenith-angle spectrum of matter effects, as illustrated in fig. 1222This figure has been obtained doing appropriate averages of the full SK data; this can be done in a few sligtly different ways (our global fit employes the full data). To optimize the visual appearance of fig 1b, we rescaled the value of the 8B flux for the LMA and LOW predictions. for the points (very close to the LMA and LOW best-fit points) defined in table 1. A look at SK and SNO data does not reveal any clear pattern; nevertheless, the global fit tells us that SK spectra favour the LMA point by .
The Chlorine rate
Both LMA and LOW solutions predict an increase of the survival probability at energies below the SK and SNO thresholds. In the LMA case this happens because neutrinos of lower energy do not experience the matter resonance in the sun, so that increases from (adiabatic MSW effect) to (averaged vacuum oscillations). In the LOW case the increase of is due to a large regeneration induced by earth matter effects. LMA and LOW predict a different increase of , and this can be tested by experiments sensitive to lower energy neutrinos.
The Cl experiment has some limited sensitivity to low energy neutrinos: roughly of the Cl rate is due to the Boron neutrinos, that above are better studied by SK and SNO (the Cl rate has not yet been calibrated, though theoretical cross sections seem to be sufficiently reliable). After the recent SNO measurement of the Boron flux, we can use the Cl rate to get better information on low energy neutrinos. As exemplified in table 1, the best-fit LOW prediction is larger than the LMA prediction (computed at the central value of the detection cross section, and of solar and earth models), and both are larger than the measured Cl rate. This fact amplifies the impact in the beyond the sensitivity of the experiment333This can be illustrated by a simple example. A difference between two solutions with a pull and a pull gives , rather than . This is why, when pulls are ‘too’ large, one can prefer to treat the data in some non-standard more conservative way., that remains anyhow mild.
| SAGE | Jan 1990 — Dec 2001 | Jan 1990 — Oct 1999 | Apr 1998 — Dec 2001 |
|---|---|---|---|
| N. runs | 92 | 70 | 35 |
| 70.8 | 75.4 | 67 | |
| GALLEX-GNO | May 1991 — Dec 2001 | May 1991 — Jan 1997 | Apr 1998 — Dec 2001 |
| N. runs | 108 | 65 | 43 |
| 70.8 | 77.5 | 65.2 |
The Gallium rate
The Ga rate is dominantly due to low energy neutrinos; the Boron contribution is about . As exemplified in table 1, the best-fit LOW prediction is somewhat lower than the LMA prediction, that is closer to the measured value. The preference for LMA versus LOW decreases down to if the Ga rate is not taken into account in a global fit.
Table 2 shows the solar neutrino interaction rates measured by SAGE and GALLEX-GNO Gallium experiments since 1991. The most recent values of the solar neutrino interaction rates are lower than the earlier ones, both in SAGE [14, 15, 16] and in GNO [17, 18, 19, 3]:
Of course, these two values are experimentally and statistically consistent, as the rate measured in the second period (April 1998 – December 2001) is just 1.5 standard deviations below the rate measured in the former period (1991–1997). For the sake of discussion, it has to be recalled that SAGE reported a problem in data acquisition (DAQ) program [16], that strongly affected the years 1996–1999. To solve the problem, an “a posteriori” correction was applied [16]. On the other side, GNO completely renewed electronic and DAQ [18], and succeeded to reduce the already low background of about [19] in the analysis region—mainly, in the low energy window. Finally both experiments in last period refined the systematics; as a results, the rate has larger statistical but lower systematic error in the second period. To conclude, it is a fact that both Gallium experiments improved with time.
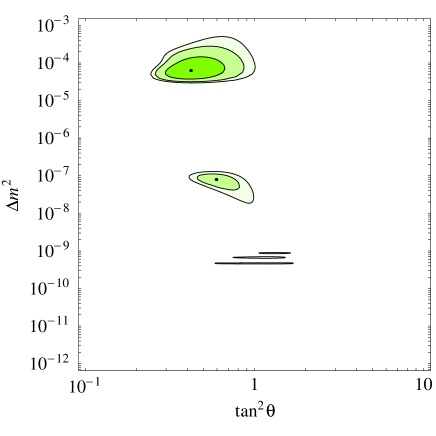
If the difference between the rates measured in the two periods is due to a statistical fluctuation, or if it cannot be proved that other systematic effects are present, the right thing to do is to average the two values as done in all global analyses [4, 5, 6, 7, 8, 9]. The result of such a kind of global fit significantly disfavours the LOW solution, as shown in fig. 2a, though the inclusion of the GNO data reduces slightly the difference: we find .
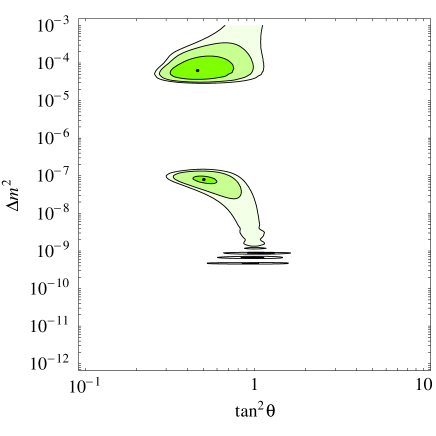
On the other side, the result of a fit that uses only data from the second period is the one shown in fig. 2b: the LOW solution turns out to be less disfavoured, .
Conclusions
We have performed a global fit of solar data, including the recent GNO result. We have shown that the strong preference for LMA rests on three weak hints. Only new data will tell us if the solution is LMA or LOW/(Q)VO; the second eventuality would be not surprising, as it would not contradict any present data.
Acknowledgements
We thank Carlos Peña-Garay for many useful discussions.
|
References
- [1] The SNO collaboration, nucl-ex/0204008 and nucl-ex/0204009. See also www.sno.phy.queensu.ca/sno.
- [2] The results of the Homestake experiment are reported in B.T. Cleveland et al., Astrophys. J. 496 (1998) 505. The Gallex collaboration, Phys. Lett. B447 (1999) 127. The GNO collaboration, Phys. Lett. B490 (2000) 16. The SAGE collaboration, astro-ph/0204245. The Super-Kamiokande collaboration, hep-ex/0103032 and hep-ex/0103033. We employ the full energy and zenith-angle SK spectra, as reported in M.B. Smy, hep-ex/0202020.
- [3] E. Bellotti, talk given at Gran Sasso National Laboratory, May 17, 2002. T. Kirsten, talk at Neutrino 2002, transparencies at neutrino2002.ph.tum.de/
- [4] V. Barger et al., hep-ph/0204253.
- [5] P. Creminelli et al., hep-ph/0102234 (updated on 22 Apr 02 including the SNO NC and day/night results).
- [6] A. Bandyopadhyay et al., hep-ph/0204286.
- [7] J.N. Bahcall et al., hep-ph/0204314.
- [8] The Super-Kamiokande collaboration, hep-ex/0205075.
- [9] P.C. de Holanda, A.Yu. Smirnov, hep-ph/0205241.
- [10] J.N. Bahcall, M.H. Pinsonneault and S. Basu, Astrophys. J. 555 (2001) 990 (astro-ph/0010346).
- [11] G.L. Fogli, E. Lisi, Astropart. Phys. 3 (1995) 185.
- [12] L. Wolfenstein, Phys. Rev. D17 (1978) 2369; S.P. Mikheyev, A.Yu. Smirnov, Sovietic Journal Nucl. Phys. 42 (1986) 913; S.T. Petcov, Phys. Lett. B200 (1988) 373; T.K. Kuo, J. Pantaleone, Rev. Mod. Phys. 61 (1989) 937. E. Lisi, et al., Phys. Rev. D63 (2001) 93002 (hep-ph/0011306).
- [13] A.M. Dziewonski and D.L. Anderson, Phys. Earth Planet. Interior 25 (1981) 297.
- [14] J.N. Abdurashitov et al., Phys. Rev. C60 (1999) 05580 (astro-ph/9907113).
- [15] V.N. Gavrin, Nucl. Phys. B (Proc. Suppl.) 91 (2001) 36.
- [16] J.N. Abdurashitov et al., astro-ph/0204245.
- [17] The GNO collaboration, as quoted in [2].
- [18] M. Altmann et al., Phys. Lett. B490 (2000) 16.
- [19] C. Cattadori, Nucl. Phys. B (Proc. Suppl.) 110 (2002) 311.