Search for cosmic ray sources using muons detected by the MACRO experiment
Abstract
The MACRO underground detector at Gran Sasso Laboratory recorded 60 million secondary cosmic ray muons from February 1989 until December 2000. Different techniques were used to analyze this sample in search for density excesses from astrophysical point-like sources. No evidence for DC excesses for any source in an all-sky survey is reported. In addition, searches for muon excess correlated with the known binary periods of Cygnus X-3 and Hercules X-1, and searches for statistically significant bursting episodes from known gamma ray sources are also proved negative.
The MACRO Collaboration
M. Ambrosio12, R. Antolini7, G. Auriemma14,a, D. Bakari2,17, A. Baldini13, G. C. Barbarino12, B. C. Barish4, G. Battistoni6,b, Y. Becherini2, R. Bellotti1, C. Bemporad13, P. Bernardini10, H. Bilokon6, C. Bloise6, C. Bower8, M. Brigida1, S. Bussino18, F. Cafagna1, M. Calicchio1, D. Campana12, M. Carboni6, R. Caruso9, S. Cecchini2,c, F. Cei13, V. Chiarella6, B. C. Choudhary4, S. Coutu11,i, M. Cozzi2, G. De Cataldo1, H. Dekhissi2,17, C. De Marzo1, I. De Mitri10, J. Derkaoui2,17, M. De Vincenzi18, A. Di Credico7, O. Erriquez1, C. Favuzzi1, C. Forti6, P. Fusco1, G. Giacomelli2, G. Giannini13,d, N. Giglietto1, M. Giorgini2, M. Grassi13, A. Grillo7, F. Guarino12, C. Gustavino7, A. Habig3,p, K. Hanson11, R. Heinz8, E. Iarocci6,e, E. Katsavounidis4,q, I. Katsavounidis4,r, E. Kearns3, H. Kim4, S. Kyriazopoulou4, E. Lamanna14,l, C. Lane5, D. S. Levin11, P. Lipari14, N. P. Longley4,h, M. J. Longo11, F. Loparco1, F. Maaroufi2,17, G. Mancarella10, G. Mandrioli2, A. Margiotta2, A. Marini6, D. Martello10, A. Marzari-Chiesa16, M. N. Mazziotta1, D. G. Michael4, P. Monacelli9, T. Montaruli1, M. Monteno16, S. Mufson8, J. Musser8, D. Nicolò13, R. Nolty4, C. Orth3, G. Osteria12, O. Palamara7, V. Patera6,e, L. Patrizii2, R. Pazzi13, C. W. Peck4, L. Perrone10, S. Petrera9, P. Pistilli18, V. Popa2,g, A. Rainò1, J. Reynoldson7, F. Ronga6, A. Rrhioua2,17, C. Satriano14,a, E. Scapparone7, K. Scholberg3,q, A. Sciubba6,e, P. Serra2, M. Sioli2, G. Sirri2, M. Sitta16,o, P. Spinelli1, M. Spinetti6, M. Spurio2, R. Steinberg5, J. L. Stone3, L. R. Sulak3, A. Surdo10, G. Tarlè11, V. Togo2, M. Vakili15,s, C. W. Walter3 and R. Webb15.
1. Dipartimento di Fisica dell’Università di Bari and INFN, 70126 Bari, Italy
2. Dipartimento di Fisica dell’Università di Bologna and INFN, 40126 Bologna, Italy
3. Physics Department, Boston University, Boston, MA 02215, USA
4. California Institute of Technology, Pasadena, CA 91125, USA
5. Department of Physics, Drexel University, Philadelphia, PA 19104, USA
6. Laboratori Nazionali di Frascati dell’INFN, 00044 Frascati (Roma), Italy
7. Laboratori Nazionali del Gran Sasso dell’INFN, 67010 Assergi (L’Aquila), Italy
8. Depts. of Physics and of Astronomy, Indiana University, Bloomington, IN 47405, USA
9. Dipartimento di Fisica dell’Università dell’Aquila and INFN, 67100 L’Aquila, Italy
10. Dipartimento di Fisica dell’Università di Lecce and INFN, 73100 Lecce, Italy
11. Department of Physics, University of Michigan, Ann Arbor, MI 48109, USA
12. Dipartimento di Fisica dell’Università di Napoli and INFN, 80125 Napoli, Italy
13. Dipartimento di Fisica dell’Università di Pisa and INFN, 56010 Pisa, Italy
14. Dipartimento di Fisica dell’Università di Roma ”La Sapienza” and INFN, 00185 Roma, Italy
15. Physics Department, Texas A&M University, College Station, TX 77843, USA
16. Dipartimento di Fisica Sperimentale dell’Università di Torino and INFN, 10125 Torino, Italy
17. L.P.T.P, Faculty of Sciences, University Mohamed I, B.P. 524 Oujda, Morocco
18. Dipartimento di Fisica dell’Università di Roma Tre and INFN Sezione Roma Tre, 00146 Roma, Italy
Also Università della Basilicata, 85100 Potenza, Italy
Also INFN Milano, 20133 Milano, Italy
Also Istituto IASF/CNR, 40129 Bologna, Italy
Also Università di Trieste and INFN, 34100 Trieste, Italy
Also Dipartimento di Energetica, Università di Roma, 00185 Roma, Italy
Also Institute for Space Sciences, 76900 Bucharest, Romania
Macalester College, Dept. of Physics and Astr., St. Paul, MN 55105
Also Department of Physics, Pennsylvania State University, University Park, PA 16801, USA
Also Dipartimento di Fisica dell’Università della Calabria, Rende (Cosenza), Italy
Also Dipartimento di Scienze e Tecnologie Avanzate, Università del Piemonte Orientale, Alessandria, Italy
Also University of Minnesota Duluth Physics Department, Duluth, MN 55812
Also Dept. of Physics, MIT, Cambridge, MA 02139
Also Intervideo Inc., Torrance CA 90505 USA
Also Resonance Photonics, Markham, Ontario, Canada
1 Introduction
The interest in the search for cosmic ray point sources identified from a measurable flux of underground muons has historical motivations mainly because of the “CygX-3 saga”. Cygnus X-3 (CygX-3) is a galactic binary system well studied in all types of electromagnetic radiation, most notably in the X-rays. At -ray energies, eV, the Kiel Extensive Air Shower array (EAS) initially reported an excess of events from CygX-3 correlated with its 4.8 hour binary period[1]. This observation appeared to confirm previous results at lower energies [2, 3]. Subsequently, several groups operating EAS array experiments and atmospheric Čerenkov telescopes confirmed the signals with different statistical significance and at different energy thresholds [4, 5, 6, 7, 8, 9]. These results prompted a new generation of more sensitive experiments using new techniques. The new experiments reported clear evidence of TeV -ray emissions from many galactic (, Crab and SN1006 [10, 11, 12]) and the extragalactic AGN-like (, Mrk421 and Mrk501 [13, 14]) sources. Finally, in 1990-1991 the new generation detectors CASA-MIA[15] and CYGNUS[16] put stringent upper limits to the -ray signal from CygX-3, which excluded early observations.
Soon after the initial EAS detection from CygX-3, two underground experiments (Soudan 1 [17] and NUSEX [18]) reported excesses in TeV muons pointing back to the CygX-3 direction when correlating event arrival time with the known orbital period of the source. These detections suggested new physics beyond the Standard Model since muons are the products of the decay of charged pions and kaons, which are produced by primary Cosmic Ray (CR) interactions with atmospheric nuclei. Charged CR nuclei cannot propagate directly from CygX-3 across 10 kpc to the Earth and there is only a very low probability of UHE -rays producing TeV muons underground[19, 20]. Investigations by other underground detectors [21, 22, 23, 24], however failed to detect any significant muon excess from that source or any other.
The MACRO experiment, which ended its operations life in December 2000, was a large area underground detector able to reconstruct muon arrival directions to very high accuracy [25]. The apparatus started operations in 1989 and was completed in April 1994. A preliminary investigation using a limited data sample of muons collected by its first and second supermodules was published in 1993 [26]. Since then, MACRO has increased the muon sample by a factor of 30, its pointing capability has been accurately determined and its direction reconstruction capability carefully studied.
In this paper we present the final results on the search for a muon excess with respect to the evaluated background by surveying the sky in declination from -15∘ to 90∘ and from several candidate UHE gamma ray emitters. We also present a more sensitive search for CygX-3 and HerX-1 using their known periodicities. Finally we searched for bursting behavior of Mrk421 and Mrk501.
2 The MACRO detector
MACRO was a multipurpose underground detector located in the Gran Sasso underground Laboratory (LNGS-INFN). It was designed to search for rare events in the cosmic radiation and its sensitivity was optimized to detect supermassive magnetic monopoles. The detector [27, 28] had a modular structure and dimensions of m3 with a total acceptance for an isotropic flux of about 104 m2sr. The rock overburden had a minimal depth of 3150 m.w.e and an average of 3700 m.w.e.
The minimal energy of surface muons that trigger the MACRO apparatus was about 1.3 TeV. The rock coverage was very irregular and the actual slant depth under which a source is observable was taken into account when evaluating the muon flux at the surface. The full detector acceptance for downgoing muons with zenith angles was about 3100 m2sr.
The detector has worked with different configurations starting with 1 supermodule at the beginning and finally with the full configuration consisting of 6 supermodules and the upper half called the “Attico”[28]. The active detection elements are planes of streamer tubes for tracking and liquid scintillation counters for fast timing. The lower half of the detector is filled with streamer tube planes alternating with trays of crushed rock. The upper part is hollow and contains the electronics racks and work areas. There are 10 horizontal streamer tube planes in the bottom half of the detector, and 4 planes on the top, all with wires and 27∘ strips, providing stereo readout of the detector hits. Six vertical planes of streamer tubes cover each side of the detector.
3 Data selection
The data used in this analysis were collected in the period May 1989- December 2000. The total number of recorded muons is approximately 60 million.
In order to optimize the quality of the tracking reconstruction and to eliminate periods when the detector was malfunctioning, we applied several cuts on a run-by-run basis. These run cuts include a check on the efficiency of the streamer tubes system whose data were used for the track reconstruction, and a check on the event rate. The streamer tube efficiency was obtained using the sub-sample of tracks crossing all the 10 lower streamer tube planes; runs having an average efficiency smaller than 90 for the wire view and 85 for the strip view were discarded. As the detector configuration changed during the data taking, the average value of the counting rate was computed for each run. Those with abnormal rates, , runs having muon counting rate that deviated by more than from the average, were cut.
In addition to the described run cuts, we applied event cuts by excluding:
-
•
events having zenith angles larger than 72∘; the cut is due to the large uncertainties in the rock depth crossed by these events;
-
•
events whose reconstruction in one of the two streamer tube stereo views is missing;
-
•
muons in a bundle with multiplicity larger than 2; this cut is necessary because the reconstructed direction in space for high multiplicity events is not completely reliable;
-
•
events that had no arrival time given by the Universal Time Clock (UTC);
-
•
events that do not cross at least 3 planes of the lower part of the apparatus; this cut excludes low energy muons [29] coming from possible secondary interactions and it improves the angular resolution. The minimal muon energy to satisfy this cut is 1 GeV.
These cuts reduce the sample to 49.9 million well-reconstructed single and double muon events during 74,073 hours of livetime. Table 1 shows, for different data taking periods, the detector configuration, the number of events which survived the cuts and the effective livetime.
4 Background estimation
Several methods were suggested to evaluate the background when looking for an excess of counts from a fixed direction in the sky [16, 30, 31]. Many experiments simply consider, as an estimation of the background, the average value of the counts of the surrounding sky bins with respect to a selected one [32]. An alternative way is to average the counts of all the bins at the same declination , except the chosen one in a particular value of the right ascension (RA). The assumption that cosmic rays arrive uniformly from any direction in the sky is implicit in this method. For an underground detector both methods require that the unequal distribution of the overburden and the dead-time of the apparatus be taken carefully into account [21].
In our analysis, we adopted a different approach. Assuming that the arrival directions and the arrival time of underground muons are uncorrelated variables, we constructed sets of simulated events by randomly coupling the times and the directions of each event in local coordinates. A mandatory requirement for this method is a good accuracy in the measurement of the arrival direction and of the recorded time. For this reason, we excluded from the analysis all the runs and the events with errors in the readout time, as described in the previous section. We determined that the optimum number of background events to be associated with each real event, minimizing the computer processing time, is 25. A total number of simulated muons were generated as background. Figure 1 presents the distribution of observed events the right ascension RA (a) and the sine of the declination sin (b) together with the simulated background. The fluctuations in the simulated distributions are small compared with those in the data. The unevenness in RA is due to the effect of the dead times. The sin distribution reflects the shape of the mountain and also the exposure of MACRO (see [26]).
5 Best sky bin definition
It is usual for astronomical telescopes to define a point spread function (PSF) that in most cases is a simple bi-dimensional normal distribution. The PSF can be used to define the optimal source bin, , the half-angle of a cone centered on a source giving the maximum signal over background ratio . For a normal PSF distribution with variance it is shown in [16] that the best value of the half-angle of a cone is . This cone contains, on average, 72 of the total number of events.
The MACRO PSF was defined using the double muon sample. A double muon event (as in general multiple muon events) is produced by an interaction of a primary nucleus at the top of the atmosphere; muons are expected to arrive at the earth surface practically parallel. When reaching an underground detector, the reconstructed spatial directions of these two muons differ as a consequence of the independent scattering of each muon. We can therefore estimate the MACRO PSF by using as a variable the distribution of the angular separation of the reconstructed muon directions for double muon events. This value must be divided by a factor to account for the two independent scatterings [26].
We found [26, 27, 28] that 50 of double muons events are contained in a cone of 0.5∘ half-angle, and that 72 of events are contained in a cone of 1.05∘ half-angle. Initially, this result suggests that the best value for the MACRO search bin (assuming that the is normally distributed) is an half-angle cone of 1.05∘/. To produce the bidimensional () distribution representing our PSF (shown in Fig. 2) we used the differences between the reconstructed muon directions in RA and declination , divided by . The main contribution to the differences between the reconstructed directions is the multiple Coulomb scattering (MCS) of muons in the rock. The PSF shown in Fig. 2 has a non-gaussian shape, with more events for small displacements and longer tails. The latter were produced by stochastic interaction process in the muon energy loss.
To obtain the value of the best search cone angle, we performed a dedicated Monte Carlo. A source was simulated in a particular () cell, and the events were extracted according to the PSF of Fig. 2. The background events were generated according to a flat density distribution. We calculated the ratio as a function of the search cone angle, as shown in Fig. 3. The maximum of the ratio is reached for a search cone angle of 0.4-0.5∘, which thus will represent the best choice value for MACRO.
As an independent check of the validity of the simulation, we studied the signal due to the Moon shadowing effect (in this case, a lack of events) measured by our detector [25]. The cumulative number of missing events obscured by the Moon’s disk, as function of the angular distance from the Moon center, shows maximum evidence for a deficit using a cone of 0.45∘ half-angle.
From all these indications the best value for the search cone angle was chosen to 0.5∘. However, in the analyses with very low bin contents such as those used in the search for flaring activities, we use an enlarged search window due to poor statistics.
6 Search for DC sources
In the search for a steady excess of muons from any direction of the sky (DC point-like sources search) we performed an all-sky survey without a priori assumptions. We divided the sky into 37176 bins of equal solid angle (= 2.3 sr; RA = , sin = 0.013). These bins have the same as a narrow cone of half-angle . We examined the sky bins looking for significant deviations from the simulated background. The deviation was defined as , where is the number of events observed in each bin and is the expected number of background events in that bin.
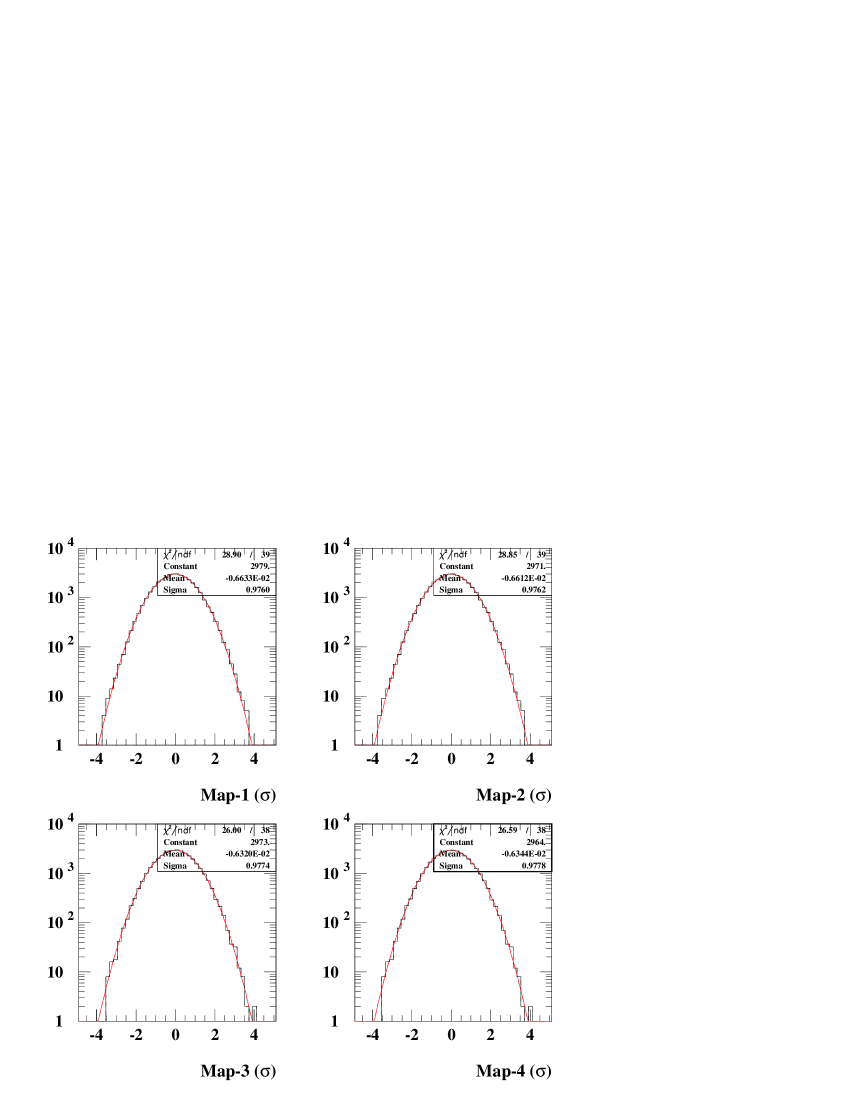
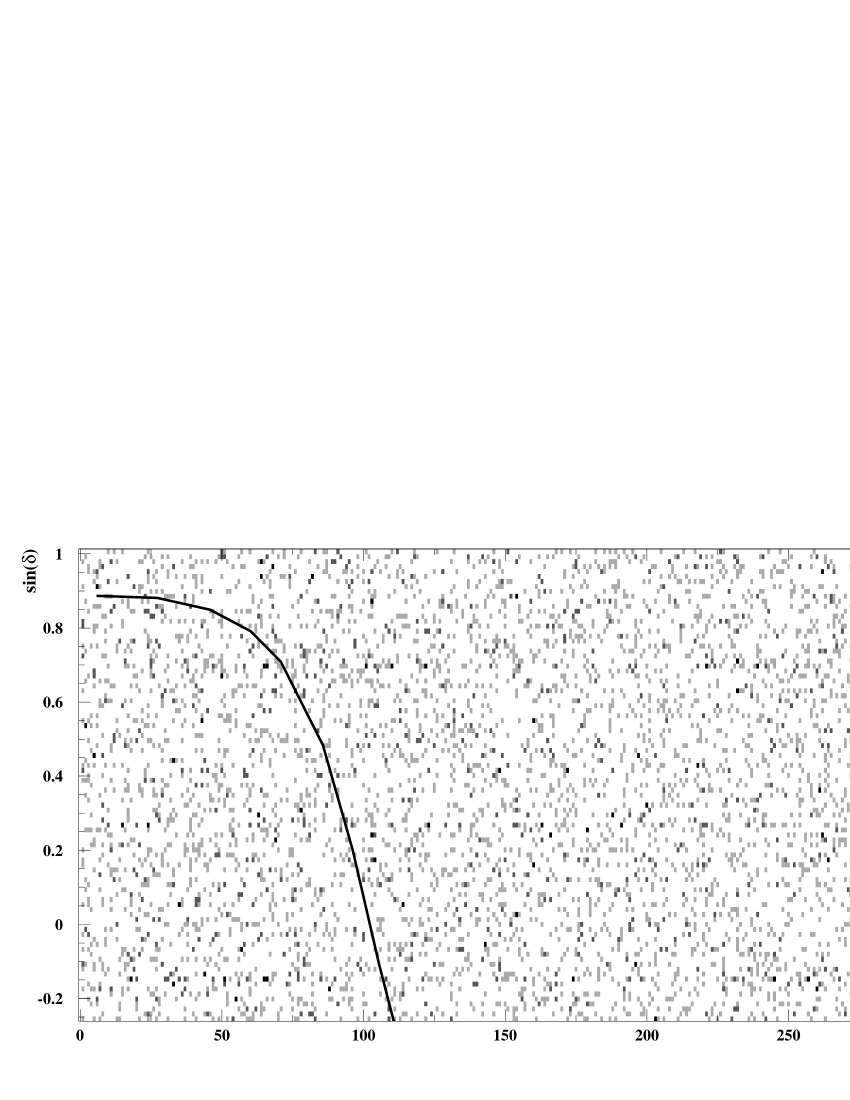
We used three different sky grids, each displaced by half bin width in RA, in sin() and in both coordinates, to take into account the possibility that a source can be located at the edge of one of the bins. Fig. 4 shows the distributions of the deviations for the four sky-maps with the best-fit Gaussian function superposed. The positive deviations in the first map are reported in the bidimensional map in RA and sin of Fig. 5. No particular pattern or clustering of positive deviations is observed. The line indicating the galactic plane is also shown. We conclude that there is no evidence for a steady source emitting muons in our data.
We calculated the 95 C.L muon flux for all sky bins using the formula [26]:
| (1) |
where:
-
-
(95%) is the upper limit for the number of muons in the bin at 95%C.L., where and are respectively the number of observed and expected events in that bin. (95%) was calculated, according to [33], as the value for which:
(2) with = and =.
-
-
is the average effective detector area for every bin. It was computed by averaging the projected area seen by each muon and taking into account the geometrical and the tracking reconstruction efficiencies:
(3) where and are the muon arrival right ascension and declination.
-
-
is the exposure time computed as the time in which each bin is visible. A bin is not visible in our apparatus, if its zenith angle is larger than 72∘.
-
-
K is a correction factor which takes into account the fraction of muons within the bin dimensions for an hypothetical source placed at the bin center. We calculated K=0.5 for a search cone of 0.5∘ half-angle and K=0.72 for 1.0∘ half-angle.
The distribution of the 95% C.L. upper limit (95%) for all the 37176 bins in the sky region accessible for MACRO has an average value of . For almost all bins, the upper limit ranges between .
7 Searches for modulated signals from CygX-3 and HerX-1
Periodic UHE gamma ray sources are attractive from the observational point of view. When it is known that the emission from the source is modulated with a certain periodicity, the signal-to-noise ratio is improved by [38] by folding the event arrival time modulo the source period into N bins. This folding procedure was employed to analyze the data from the direction of CygX-3 and HerX-1 [9, 39, 40].
We used the quadratic ephemeris reported in Table 3 and obtained from the fit to the observed X-ray light curve [41], [42]. The phase diagrams for events coming from a cone of 1∘, centered on the position of the two sources, are shown in Fig. 6. The expected number of background muons in each phase bin is also shown with the dashed lines.
The largest positive deviation (1.8 ) in the CygX-3 cycle is in the phase bin 0.1-0.2. The largest positive deviation for HerX-1 (1.7 ) is in the phase bin 0.7-0.8. Using the values of the largest fluctuation we computed the 95 C.L. upper limits to the modulated muon flux using equation 1, and the results are reported in Table 3. In Fig. 7 our computed upper limit for the modulated emission from CygX-3 is compared with those of previous underground experiments. Our level is the lowest reached by such detectors. The problem of understanding past positive observations still remain unsolved.
8 Search for flaring activity from Mkn421 and Mkn501
During the 1995-1999, several Čerenkov telescopes reported observations of flaring activities up to 10-20 TeV from the two celestial objects Mkn421 and Mkn501[44, 45, 46, 47]. These observations prompted us to search for bursting muon signals in a 1∘ half-cone, around the position of these sources of U.H.E. photons. We used two different methods.
In the first method we studied, similarly to [48], the accumulation rate of events coming from each of the two sources, adding day-by-day the differences between the measured number of events and the calculated background. Figures 8 and 9 show the cumulative excesses as a function of date (Julian days) since MACRO starting data taking. The cumulative excess presents fluctuations, but never becomes significant.
In the second method we assumed (as in [49]) that the background has a Poissonian distribution. If is the expected daily background from the direction of a source, then the probability to observe a random fluctuation of the background large as the observed events in a day, is given by:
| (4) |
where is the ratio of the ON-source time to the OFF-source time. Because we extract 25 simulated background events for each real one, is 0.04. For a Poissonian background, the cumulative frequency distribution of P is expected to be a power law with index -1, in logarithmic scale.
Figures 10 and 11 show the value of - evaluated day-by-day for Mkn421 and Mkn501, respectively. In Fig. 10 the date of the largest fluctuations for Mkn421 with respect to the background are also indicated.
To verify the probability of such a positive fluctuation from Mkn421, we computed the quantity - for a set of selected bins having an exposure similar to the two Mkn objects, each monitored for about 3600 days. Figure 12 shows the log-log plot of the cumulative frequency distribution for all these sky bins. Since this cumulative distribution has a slope close to -1, as expected in the case of no source detected, we can use the Poissonian statistics to compute the expectation to see large fluctuations.
We set as an attention level a probability of for a fluctuation. We found 4 days with probability larger than for Mkn421, and none for Mkn501. We observed the Mkn421 source for 3600 days: assuming as attention level for any source the probability value of , the expected number of random fluctuations with probability lower than is . Therefore the Poissonian probability to observe 4 random fluctuation in the same period, with an average of 3.6, is about 20. This probability value therefore excluded a positive observation of a burst from this source.
9 Conclusions
Since February 1989, the MACRO detector collected 49.9 million well-constructed muons. Using this sample, we searched for muon excesses above background from all visible sky directions and from known astrophysical sources. No significant excesses were found from the all-sky survey. We computed the 95% confidence level upper limit for a steady muon flux for all the 37176 sky cells; the average value of is equal to 2.3 . We analyzed the muons coming from the direction of Cyg X-3 and Her X-1, searching for a modulated emission, with a negative result. The search for a steady or episodic emission coming from Mkn421 and Mkn501 was made with two different methods. We found no muon excess above the estimated background.
10 Acknowledgments
We gratefully acknowledge the support of the director and of the staff of the Laboratori Nazionali del Gran Sasso and the invaluable assistance of the technical staff of the Institutions participating in the experiment. We thank the Istituto Nazionale di Fisica Nucleare (INFN), the U.S. Department of Energy and the U.S. National Science Foundation for their generous support of the MACRO experiment. We thank INFN, ICTP (Trieste), WorldLab and NATO for providing fellowships and grants (FAI) for non Italian citizens.
This work is dedicated to the memory of Lynn Miller.
References
- [1] M. Samorski and W. Stamm, Astrophys. J. 268 (1983) L17.
- [2] YU.I. Nesphor et al., Astrophys. Space Sci. 61 (1979) 349.
- [3] R.C. Lamb et al., Nature 296 (1982) 543.
- [4] J. Lloyd-Evans et al., Nature 305 (1983) 784.
- [5] T. Kifune et al., Astrophys. J. 301 (1986) 230.
- [6] V. V. Alexeenko et al., Il Nuovo Cimento 10c (1987) 151.
- [7] B. L. Dingus et al., Phys. Rev. Lett. 60 (1988) 1785.
- [8] M. Teshima et al., Phys. Rev. Lett. 64 (1990) 1628.
- [9] Y. Muraki et al., Astrophys. J. 373 (1991) 657.
- [10] T. Tanimori et al., Astrophys. J. 492 (1998) L33; T. Tanimori et al., Astrophys. J. 497 L25.
- [11] A.M. Hillas et al., Astrophys. J. 503 (1998) 744.
- [12] J. A. Gaidos et al., Nature 383 (1996) 319; F. Aharonian et al., A & A, 349 (1999) 11.
- [13] M.Punch et al., Nature 358 (1992)477
- [14] M.S. Schubnell et al., Astrophys. J. 460(1996) 644.
- [15] A. Borione et al., Phys. Rev. D 55, (1997) 1714.
- [16] D. E. Alexandreas et al., Nucl. Instrum. Meth. A 328 (1993) 570.
- [17] M.F.Marshak et al. Phys. Rev. Lett.B, 54 (1985a) 2079
- [18] G.Battistoni et al. Phys. Lett.B, 155 (1985) 465
- [19] F. Halzen, T. Stanev and G. B. Yodh, Phys. Rev. D 55, (1997) 4475.
- [20] D. P. Bhattacharyya, Phys. Rev. D 55 (1997) 2792.
- [21] Y. Oyama et al., Phys. Rev. Lett., 56 (1986) 991.
- [22] C. Berger et al., Phys. Lett. B 174 (1986) 118.
- [23] R. Bionta et al., Phys. Rev. D 36 (1987) 30.
- [24] S. Corbato, Ph.D. thesis, Univ. Pennsylvania, (1987)
- [25] M. Ambrosio et al. [MACRO Collaboration], Phys. Rev. D 59 (1999) 012003 see also N. Giglietto et al., S.H.3.2.38, Proc. ICRC, (Salt Lake City, 1999)
- [26] S.Ahlen et al.(The MACRO Collaboration), Astrophys. J. 412 (1993) 301.
- [27] S. P. Ahlen et al. [MACRO Collaboration], Nucl. Instrum. Meth. A 324 (1993) 337.
- [28] M. Ambrosio et al., accepted by Nucl. Instrum. Meth.
- [29] M. Ambrosio et al. [MACRO Collaboration], Astrop. Phys. 9 (1998) 105.
- [30] H.L. Badran, Exp. Astron, 5 (1994) 355.
- [31] C.L. Cassiday et al., Nucl Phys. B (Proc. Suppl.) 14A (1990) 291.
-
[32]
V. V. Alexeenko et al., (ed. J. Matthews), conf. proc. AIP 220 (1991)
132 and also
Merck et al., Proc. ICRC (Dublin 1991), 1, 261. - [33] O. Helene , Nucl. Inst. and Meth. in Phys. Res., 212 (1983) 319.
- [34] D. E. Alexandreas et al., Astrophys. J. 383 (1991) L53.
- [35] D. P. Ciampa et al., Phys Rev D 46 (1992) 3248.
- [36] M. Willner et al., Proc. 24th ICRC (Roma, 1995) 2, 409.
- [37] M. Aglietta et al., Astrop. Phys. 3 (1995) 1-15
- [38] M. Mori et al., Astrophys. J., 476 (1997) 842.
- [39] L. C. Lamb et al., Astrophys. J. 328 (1998) L13.
- [40] J. C. Dowthwaite et al., Nature 309 (1984) 691.
- [41] S.R. Kitamoto et al., PASJ 47 (1995) 233J.
- [42] H. Ogelman, A&A 172 (1987) 84.
- [43] J. E. Deeter et al., Astrophys. J. 247 (1981) 1003.
- [44] J. Quinn et al., Astrophys. J., 456 (1996) L83.
- [45] S. M. Bradbury et al., A&A 320 (1997) L5.
- [46] A. Djannati-Atai et al., A&A 350 (1999) 17.
- [47] M. Amenomori et al., Astrophys. J., 532 (2000) 302.
- [48] R. W.Clay et al., Astrop. Phys. 2 (1994)347
- [49] L.Padilla et al., A&A 337 (1998) 43.
| Period | Number of | Number of | Exposure |
|---|---|---|---|
| SuperModules | events | Time (hr) | |
| Feb,27 1989-May,20 1989 | 1 | 244333 | 1942.9 |
| Nov,11 1989-May,10 1990 | 1 | 365148 | 3072.1 |
| May,10 1990-Jul,5 1991 | 1,2 | 1308311 | 5274.9 |
| Jul,5 1991-Apr,29 1994 | 1-6 | 11549606 | 16247.8 |
| Apr,29 1994-Dec,15 2000 | 1-6+A | 36490390 | 47535.4 |
| Area | Flux | |||||
| sec | ||||||
| MKN421 (0.5∘) | 1373 | 1382.8 | -0.26 | 745 | 162 | 1.6 |
| (1.0∘) | 6506 | 6389.7 | 1.5 | 745 | 162 | 3.7 |
| MKN501 (0.5∘) | 1482 | 1429.9 | 1.4 | 739 | 164 | 2.4 |
| (1.0∘) | 6544 | 6459.5 | 1.1 | 739 | 164 | 3.4 |
| CRAB (0.5∘) | 1685 | 1651.5 | 0.8 | 744 | 137 | 2.7 |
| (1.0∘) | 6808 | 6764.0 | 0.5 | 744 | 137 | 3.6 |
| Cyg X-3 (0.5∘) | 1376 | 1382.8 | -0.17 | 740 | 164 | 1.6 |
| (1.0∘) | 6340 | 6370.7 | -0.4 | 740 | 164 | 2.4 |
| Her X-1 (0.5∘) | 1521 | 1501.7 | 0.5 | 733 | 159 | 2.1 |
| (1.0∘) | 6530 | 6519.0 | 0.14 | 733 | 159 | 2.8 |
| 3C66A (0.5∘) | 1378 | 1354.1 | 0.65 | 737 | 168 | 1.9 |
| (1.0∘) | 6398 | 6305.3 | 1.17 | 737 | 168 | 3.4 |
| 1ES514 (0.5∘) | 1550 | 1618.6 | -1.7 | 729 | 180 | 1.2 |
| (1.0∘) | 6969 | 7003.8 | -0.4 | 729 | 180 | 2.3 |
| QX SGE (0.5∘) | 1731 | 1719.2 | 0.28 | 770 | 137 | 2.3 |
| (1.0∘) | 7170 | 7083.1 | 1.03 | 770 | 137 | 3.9 |
| SS Cyg (0.5∘) | 1382 | 1406.5 | -0.65 | 735 | 169 | 1.4 |
| (1.0∘) | 5548 | 5526.7 | 0.28 | 735 | 169 | 2.5 |
| Geminga (0.5∘) | 1709 | 1692.8 | 0.39 | 748 | 125 | 2.7 |
| (1.0∘) | 7632 | 7693.3 | -0.7 | 748 | 125 | 3.1 |
| 3C273 (0.5∘) | 1138 | 1168.1 | -0.88 | 636 | 96 | 2.5 |
| (1.0∘) | 4529 | 4625.7 | -1.4 | 636 | 96 | 3.1 |
| 3C279 (0.5∘) | 645 | 657.2 | -0.48 | 569 | 90 | 2.5 |
| (1.0∘) | 2644 | 2706.3 | -1.2 | 569 | 90 | 2.9 |
| 2CG095 (0.5∘) | 1709 | 1724.9 | -0.38 | 729 | 180 | 1.6 |
| (1.0∘) | 6919 | 7003.1 | -1.0 | 729 | 180 | 1.9 |
| 2CG135 (0.5∘) | 1892 | 1863.8 | 0.65 | 712 | 154 | 2.6 |
| (1.0∘) | 7946 | 7899.5 | 0.52 | 712 | 154 | 3.5 |
| 4U1907 (0.5∘) | 1527 | 1543.2 | -0.4 | 698 | 99 | 2.8 |
| (1.0∘) | 6566 | 6496.8 | 0.86 | 698 | 99 | 5.5 |
| 4U0115 (0.5∘) | 2024 | 2033.7 | -0.21 | 711 | 145 | 2.3 |
| (1.0∘) | 8351 | 8489.5 | -1.5 | 711 | 145 | 2.4 |
| V1341 (0.5∘) | 1382 | 1406.5 | -0.65 | 748 | 161 | 1.5 |
| (1.0∘) | 5481 | 5560.9 | -1.1 | 748 | 161 | 1.9 |
| PSR1929 (0.5∘) | 1559 | 1578.7 | -0.5 | 716 | 106 | 2.6 |
| (1.0∘) | 6012 | 5981.7 | 0.4 | 716 | 106 | 4.3 |
| PSR1855 (0.5∘) | 1567 | 1580.8 | -0.34 | 716 | 107 | 2.6 |
| (1.0∘) | 6576 | 6517.6 | 0.7 | 716 | 107 | 4.8 |
| Cyg X-3 [41] | Her X-1 [43] | ||
| P [d] | 0.19968271 | 1.700167788 | |
| (2.4) | (1.1) | ||
| Ephemeris | [d/yr] | ||
| [JD] | 2440949.8989 | 2442859.726688 | |
| (0.0012) | (7 | ||
| Flux | |||
| limits 1∘ | () |