Supernova 1987A did not test the neutrino mass hierarchy
Abstract
We dispel the misconception that data from SN 1987A favor the normal neutrino mass hierarchy over the inverted hierarchy for . We find comparable fits for the two hierarchies. No bound can be placed on the mixing angle even at the 1 level.
On February 23, 1987, antineutrinos from a 20 Type II supernova in the Large Magellanic Cloud were detected by the Kamiokande II (KII) [1] and Irvine Michigan Brookhaven (IMB) [2] detectors. The data on SN 1987A have been important in confirming the generic features of the core collapse model of supernovae [3]. However, the average antineutrino energy and the binding energy of the star , extracted from the signals at KII and IMB, only marginally agree with each other [4, 5, 6]. Moreover, even under the most optimistic conditions, the allowed values of are lower than the following predictions of traditional supernova models [7]:
| (1) | |||||
| (2) | |||||
| (3) |
Including neutrino oscillations does little to resolve these discrepancies. For the favored large-angle solution to the solar anomaly [8], compatibility of the two data sets is not significantly improved [4, 5, 6]. Furthermore, in any oscillation scenario, oscillations result in a hardened initial spectrum, implying even lower and increasing the discrepancy with theoretical predictions [4, 5, 6]. The degree to which the data and supernova models disagree depends on the type of neutrino mass hierarchy. There are two possibilities depending upon whether is the largest or smallest mass eigenstate:
| (4) | |||||
| (5) |
where oscillations between the and ( and ) mass eigenstates are responsible for the atmospheric (solar) neutrino deficit. The disagreement with the theoretical predictions is aggravated if the hierarchy of neutrino masses is inverted and because the conversion of the original spectrum is almost complete in this case (regardless of the solution to the solar neutrino problem). This is a hint that the inverted mass scheme is disfavored by SN 1987A [4, 5]. However, it is an overstatement that SN 1987A gives a strong indication that the inverted hierarchy is disfavored unless [9].
We show that the SN 1987A data do not favor one hierarchy over the other by performing a maximum likelihood analysis of the data from KII and IMB in the three neutrino framework assuming the LMA solution to the solar neutrino problem. We perform three-parameter fits to , and , where is the temperature of the electron antineutrinos originating in the supernova, which for a Fermi-Dirac distribution is related to via . We find that the data can be fit equally well by the two hierarchies with the maximum of the likelihood function in the two cases to be approximately the same. No constraint can be placed on at the 1 level.
Recent refinements in supernova codes suggest that the discrepancy with SN 1987A data may soon be resolved. The simulations of Ref. [10] find and below the ranges in Eq. (3). The lower is attributed to the inclusion (for the first time) of nucleon-nucleon neutral-current bremsstrahlung which is softer than annihilation (the other major source). A similar conclusion is drawn in Ref. [11] which explains that nucleon recoils lower substantially. Additional energy transfer due to neutrino-matter scattering processes not included in supernova simulations will further soften the emergent spectra.
To simulate the time averaged spectrum of antineutrinos from SN 1987A, we employ a Fermi-Dirac distribution with equipartition of energy between the neutrino flavors. As the antineutrinos travel outward from their production point in the supernova, they encounter a density profile that falls like [12]. For the LMA solution, antineutrinos can experience at most one resonance (at density and characterized by and ), and only if the hierarchy is inverted. For the normal and inverted hierarchies, the survival probability of electron antineutrinos is given by [13]
| (6) |
and
| (7) |
respectively. Here, is the probability that an antineutrino reaching the earth in the mass eigenstate will interact with the detector as a , and [14] is the hopping probability at the resonance. If , we have and the survival probabilities for the two hierarchies are the same. Thus, the normal and inverted mass hierarchies are indistinguishable for . If , for the inverted hierarchy and the original electron antineutrinos have all been swapped for the more energetic and antineutrinos by the time they exit the supernova envelope, resulting in a harder incident spectrum. Thus, the initial spectrum would have to be softer for the inverted hierarchy than for the normal hierarchy.
In performing our statistical analysis, we fix the solar neutrino oscillation parameters at eV2, [8] and the atmospheric neutrino scale eV2 [15] and fit the data taking , and as free parameters. The time structure of the SN 1987A signal (above threshold) is shown in Fig. 1, where it has been assumed that the first events at the two detectors occurred simultaneously. Most of the events are concentrated in the first 2.75 seconds. We perform two sets of analyses to illustrate how sensitive any conclusion about the mass hierarchy is to the data sample chosen for analysis. For the first set of analyses (which we label ), we use all the data reported by the two experiments: the 11 events observed by KII and the 8 events observed by IMB. For the second set (which we call ), we only include events within the first 2.75 seconds: 8 events at KII and 6 at IMB. All are assumed to be antineutrino events [16]. The procedure employed for our likelihood analysis is that of Ref. [4] up to four minor refinements listed below. (We refer the reader to Ref. [4] for the definition of the likelihood function and a description of the method).
- 1.
-
2.
Instead of using the constant density approximation for the earth to calculate , we numerically integrate the evolution equations of neutrinos through a realistic density profile of the earth [18].
-
3.
We approximate the time integrated spectra of neutrinos with a Fermi-Dirac distribution instead of a Boltzmann distribution.
-
4.
We use the detector efficiencies given in Ref. [19].
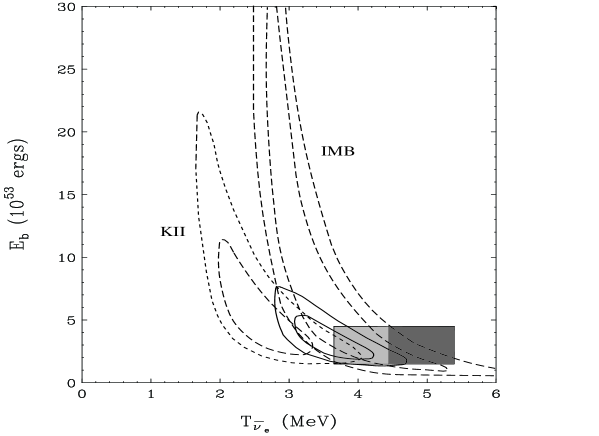
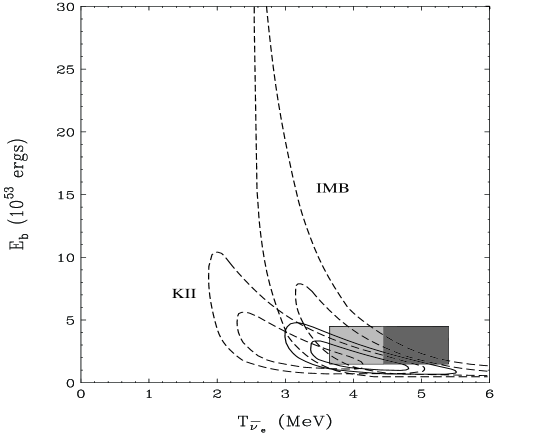
To convey how these modifications (other than the different treatment of earth matter effects) affect the analysis, we show the 1 and 2 allowed regions in and for the case of no neutrino mixing in Fig. 2. The results from separate analyses of KII and IMB data and an analysis of the combined data are shown. This facilitates a direct comparison with other analyses [4, 6]. The dark-shaded region is the prediction of supernova models from Eq. (3) while the light-shaded region is the result based on Ref. [10]. The overlap with the predicted is significantly greater for the analysis, as can be seen in Fig. 3. Also, KII and IMB data from the first three seconds are consistent at the 1 level.
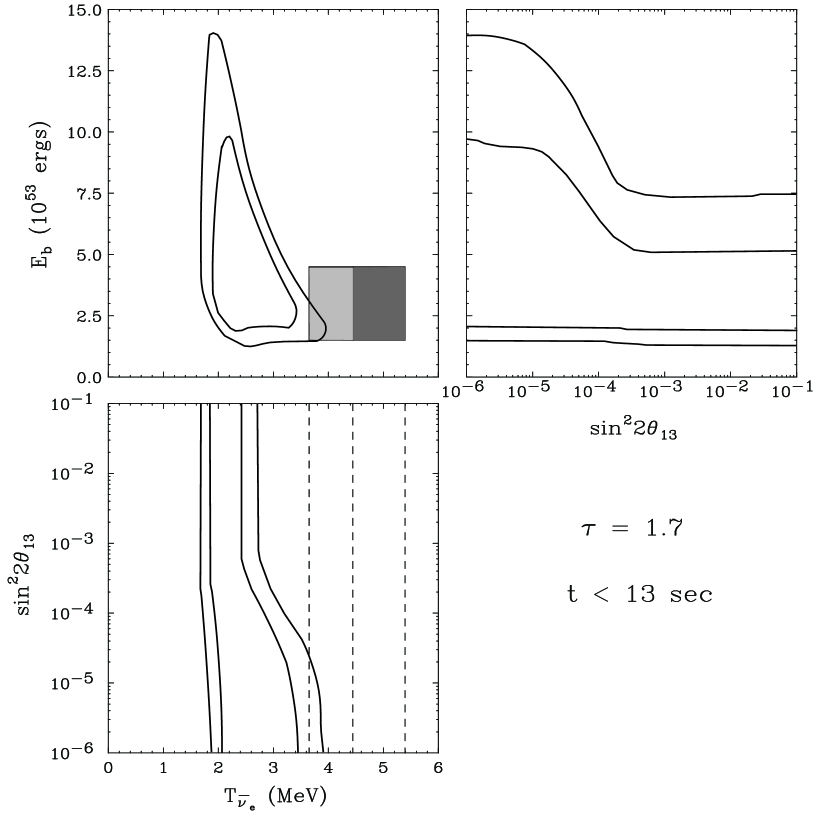
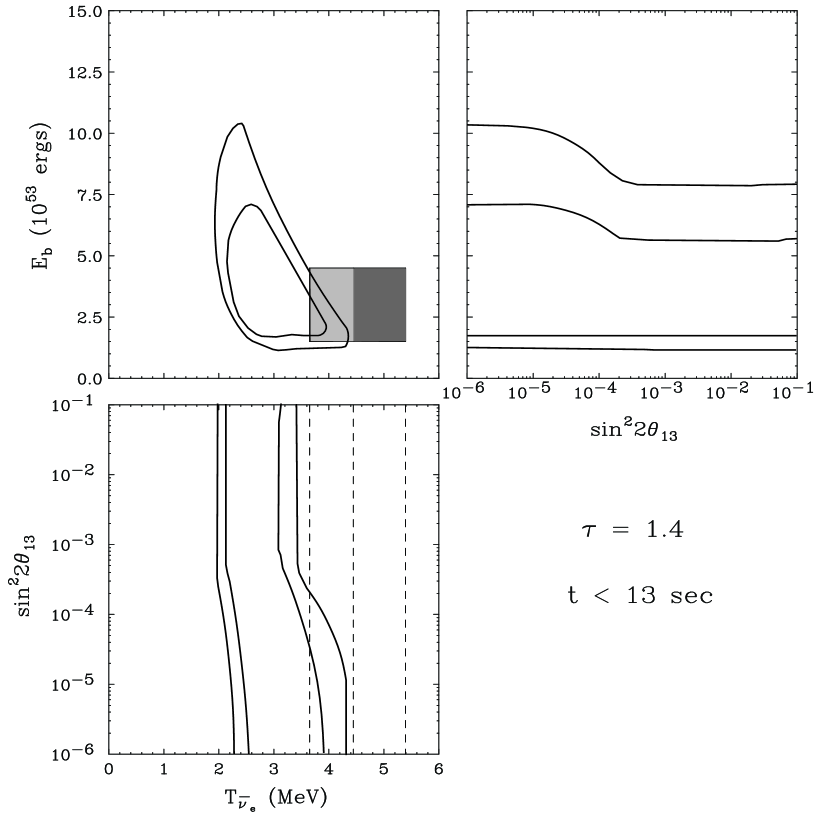
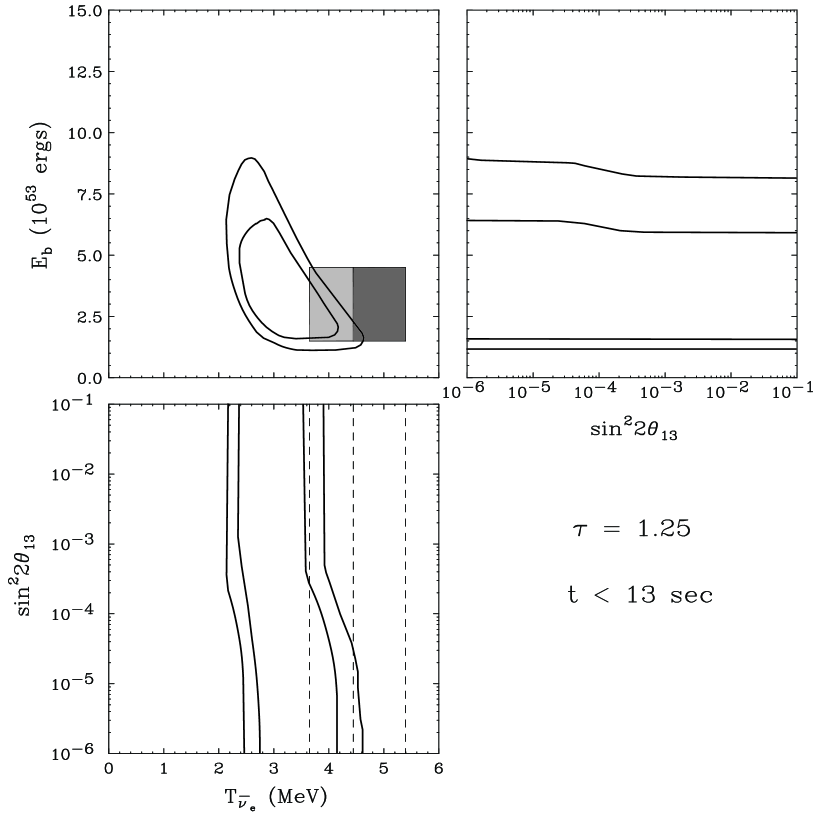
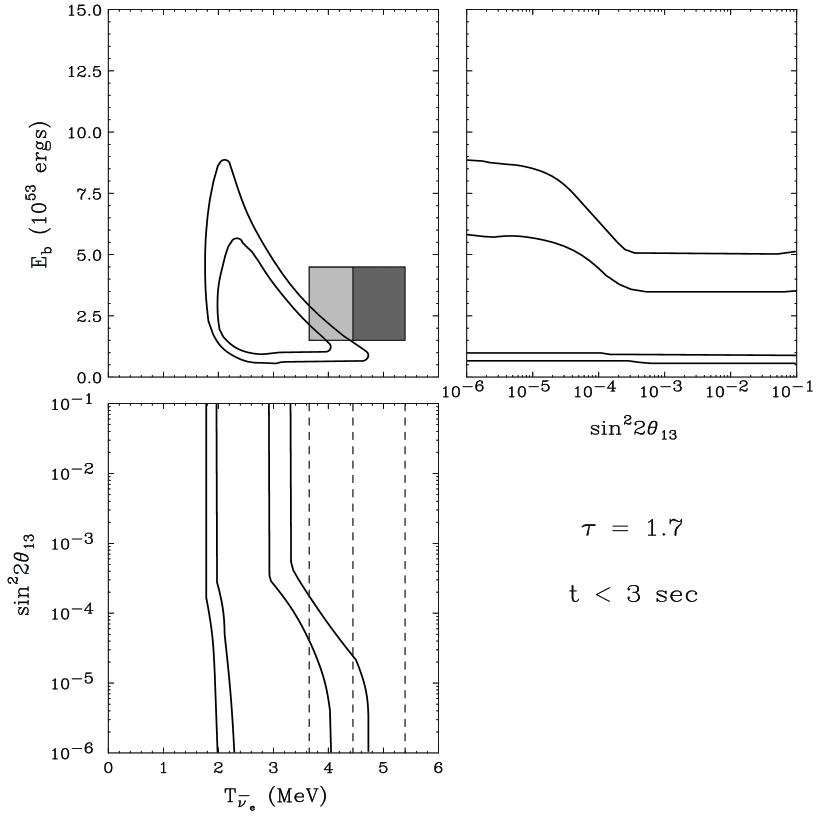
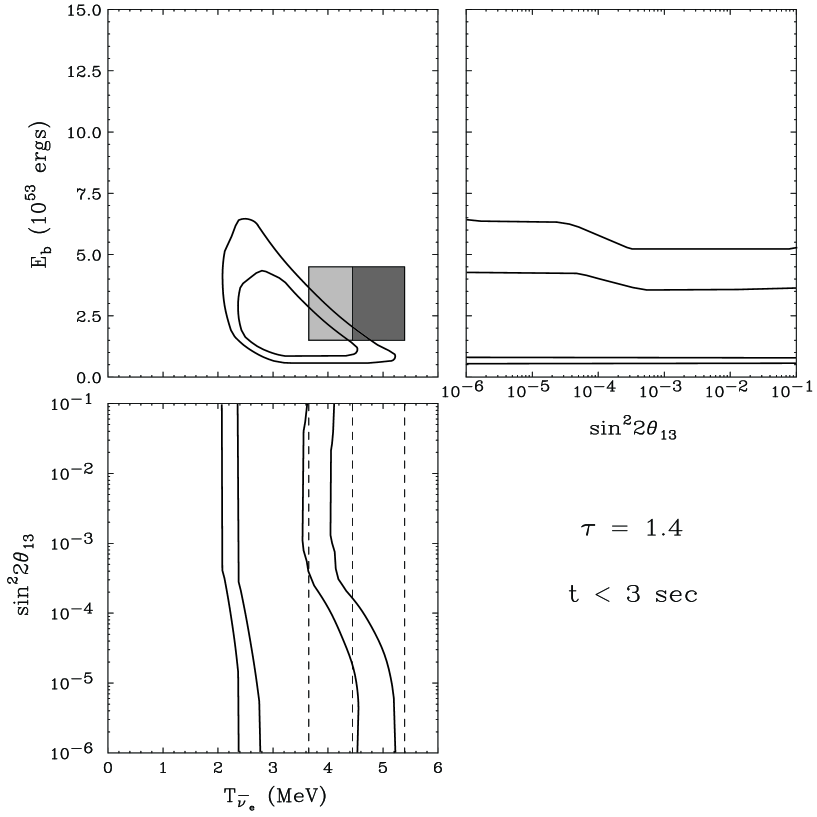
For the inverted hierarchy, we perform three-parameter analyses for (corresponding to the middle of the ranges of Eq. 3), (the lowest value of from Eq. 3) and (corresponding to a spectrum that is softer [10, 11, 20] than traditionally obtained), the results of which are shown in Figs. 4-6, respectively. The results of the equivalent analyses are shown in Figs. 7-9. The figures show allowed regions at the 1 and 2 C.L. in the parameter space defined by , and . We do not consider since this would violate the CHOOZ bound [21].
| ( ergs) | (MeV) | ||||
|---|---|---|---|---|---|
| t 13 sec | 3.2 | 3.4 | 1.3 | -41.9 | |
| 3.4 | 3.2 | -41.6 | |||
| 4.5 | 2.6 | -41.2 | |||
| 6.3 | 2.0 | -40.6 | |||
| t 3 sec | 2.0 | 3.6 | -35.5 | ||
| 2.0 | 3.5 | -35.4 | |||
| 2.4 | 2.9 | -35.2 | |||
| 3.0 | 2.5 | -34.9 |
The best-fit points are displayed in Table I, and as expected the analysis gives higher best-fit (since the same is true for no oscillations), and the best-fit values of correspond to highly non-adiabatic transitions. However, is not constrained even at the 1 level. Values of greater than 1.7 lead to shifted to smaller values than for , but the contour remains open at the 1 level. It can be seen qualitatively, that for , values of from supernova codes are less inconsistent with the data (see the lower panels of Fig. 4-9). But, for in the range found in Ref. [10] and , SN 1987A data are consistent with theoretical predictions even for as high as the CHOOZ bound. The results of Ref. [20] indicate that both the above conditions on and can easily be met simultaneously. Thus, even at a qualitative level it can not be claimed that the inverted mass hierarchy is disfavored for .
For a given value of , the range of that is allowed for the normal hierarchy is the same as that for the inverted hierarchy with since the survival probabilities, Eqs. (6) and (7), are the same for both hierarchies in this limit. The for the normal hierarchy can be read-off from the lower panels of Figs. 4-9 at . (This interpretation must be made with caution, since for the normal hierarchy, it is known a priori that the antineutrino spectra are independent of , which would strictly mean that the confidence regions should be determined for two parameters and not three).
To make the fact that SN 1987A data did not probe the neutrino mass hierarchy even more transparent, we show the results of two-parameter fits in and for the normal hierarchy and the inverted hierarchy (with ) in Table II () and Table III (). We do not show figures of these allowed regions since these exist in the literature [4, 5, 6, 9] for the case. As has been pointed out by previous authors, if the hierarchy is inverted and is large (i.e., ), lower values of are required to fit the data than if the hierarchy is normal. Since in all cases the likelihoods are comparable, the data itself does not favor one neutrino mass hierarchy over the other. Any deductions about the hierarchy can only be based on the disagreement of the data with supernova model predictions, which are in a state of change.
| ( ergs) | (MeV) | ||
|---|---|---|---|
| no oscillations | 3.2 | 3.6 | -42.0 |
| 3.1 | 2.9 | -42.0 | |
| normal | 3.2 | 3.4 | -41.9 |
| 3.1 | 2.6 | -42.0 | |
| normal | 3.4 | 3.2 | -41.6 |
| 3.2 | 2.1 | -42.0 | |
| normal | 4.2 | 2.7 | -41.2 |
| 3.2 | 1.8 | -42.0 | |
| normal | 5.8 | 2.2 | -40.6 |
| ( ergs) | (MeV) | ||
|---|---|---|---|
| no oscillations | 1.8 | 4.0 | -35.6 |
| 1.8 | 3.2 | -35.6 | |
| normal | 1.9 | 3.7 | -35.5 |
| 1.7 | 2.9 | -35.6 | |
| normal | 2.0 | 3.5 | -35.4 |
| 1.7 | 2.4 | -35.6 | |
| normal | 2.4 | 3.0 | -35.2 |
| 1.8 | 2.0 | -35.6 | |
| normal | 3.1 | 2.5 | -34.9 |
In addition to the above arguments, one must keep in mind that SN 1987A provided us with very limited statistics with a somewhat uncertain time sequence. Moreover, even with oscillations, the marginal overlap between the KII and IMB data should suggest that any conclusions can only be suggestive at best.
In summary, we have disputed the assertion that SN 1987A provides a strong indication that the inverted mass hierarchy is disfavored for [9]. The data provides no substantial evidence that this is the case. Rather than telling us anything about the nature of the neutrino mass hierarchy, SN 1987A data seem to indicate the need for more sophisticated supernova codes [10] which could remove the (mass-hierarchy-independent) discrepancy with model predictions. For a future galactic supernova, data from Super-Kamiokande and SNO would enable a precise determination of both and [22, 23] (unless and the hierarchy is inverted [22]) and determine the sign of if [13, 22], independently of supernova models.
Acknowledgements. We thank S. Reddy for numerous discussions and suggestions. This research was supported by the U.S. DOE under Grants No. DE-FG02-95ER40896 and No. DE-FG02-91ER40676 and by the WARF.
REFERENCES
- [1] K. Hirata et al., Phys. Rev. Lett. 58, 1490 (1987); K. S. Hirata et al., Phys. Rev. D 38, 448 (1988).
- [2] R.M. Bionta et al., Phys. Rev. Lett. 58, 1494 (1987); C.B. Bratton et al., Phys. Rev. D37, 3361 (1988).
- [3] T. J. Loredo and D. Q. Lamb, astro-ph/0107260.
- [4] B. Jegerlehner, F. Neubig and G. Raffelt, Phys. Rev. D54, 1194 (1996).
- [5] C. Lunardini and A. Yu. Smirnov, Phys. Rev. D63, 073009 (2001).
- [6] M. Kachelriess, R. Tomas and J.W.F. Valle, JHEP 01, 030 (2001).
- [7] H.T. Janka, Proceedings of Frontier Objects in Astrophysics and Particle Physics, Vulcano, Italy, 1992, edited by F. Giovannelli and G. Mannocchi.
- [8] V. Barger et al., Phys. Rev. Lett. 88, 011302 (2002); J.N. Bahcall et al., hep-ph/0111150; G.L. Fogli et al., Phys. Rev. D64, 093007 (2001); A. Bandyopadhyay et al., Phys. Lett. B 519, 82 (2001); M.V. Garzelli and C. Giunti, hep-ph/0111254.
- [9] H. Minakata and H. Nunokawa Phys. Lett. B504, 301 (2001).
- [10] A. Burrows, T. Young, P. Pinto, R. Eastman and T. Thompson, Astrophys. J. 539, 865 (2000).
- [11] G. G. Raffelt, astro-ph/0105250.
- [12] G. Brown, H. Bethe and G. Baym, Nucl. Phys. A375, 481 (1982).
- [13] A.S. Dighe and A.Yu. Smirnov, Phys. Rev. D62, 033007 (2000).
- [14] T.K. Kuo and J. Pantaleone, Phys. Rev. D37 298 (1988).
- [15] G. L. Fogli, E. Lisi and A. Marrone, hep-ph/0110089.
- [16] K. Sato and H. Suzuki, Phys. Rev. Lett. 58, 2722 (1987).
- [17] P. Vogel and J.F. Beacom, Phys. Rev. D60, 053003 (1999).
- [18] A. Dziewonski and D. Anderson, Phys. Earth Planet. Inter. 25, 297 (1981).
- [19] A. Burrows, Astrophys. J. 334, 891 (1988).
- [20] J. A. Pons, S. Reddy, M. Prakash, J. M. Lattimer and J. A. Miralles, Astrophys. J. 513, 780 (1999).
- [21] CHOOZ collaboration, M. Apollonio et al., Phys. Lett. 4̱66, 415 (1999).
- [22] V. Barger, D. Marfatia and B.P. Wood, hep-ph/0112125.
- [23] H. Minakata, H. Nunokawa, R. Tomas and J.W.F. Valle, hep-ph/0112160.