What Have We Learned from RHIC?111Invited talk presented at the International Conference on the Physics and Astrophysics of the Quark Gluon Plasma, Nov. 26-30 2001
Abstract
In this talk, I present what I believe we have learned from the recent RHIC heavy ion experiments. The goal of these experiments is to make and study matter at very high energy densities, greater than an order of magnitude larger than that of nuclear matter. Have we made such matter? What have we learned about the properties of this matter? What do we hope and expect to learn in the future?
1 Introduction
The goal of the heavy ion program at the RHIC at Brookhaven National Laboratory is to make and study new forms of matter at energy densities in excess of ten times that of nuclear matter. I will describe the status of this program from a theorist’s perspective. In this talk, I would like to address four simple questions:
-
•
What are we trying to understand?
We are trying to produce new forms of matter and understand their properties.
-
•
What have we already learned?
I will argue that we have produced matter at energy densities at least 10 and perhaps 100 times higher than that of nuclear matter. This matter is strongly interacting with itself.
-
•
What do we expect to learn?
There are some measurements which will be carried out in the near term which will answer specific questions about the properties of matter produced in RHIC collisions.
-
•
What do we hope to learn?
In the longer term, there are the measurements which are harder to understand or more controversial or ambiguous in their interpretation, and will require new analysis.
2 What Are We Trying to Understand?
There are two central issues of the RHIC experimental program.
-
•
What is the behavior of matter at asymptotically large energy density?
Matter at very high energy density in thermal equilibrium is believed to form a Quark Gluon Plasma. This gas of almost free quarks and gluons is thought to be the proper description of matter when energy densities are larger than about . This is about the energy density inside a proton or neutron and is about an order of magnitude larger than that of nuclear matter. Matter of this energy density occurs naturally in the cores of neutron stars and was present during the big bang.
-
•
What type of matter is important for high energy hadrons?
This matter is believed to be a very dense system of quarks and gluons, and is called a Color Glass Condensate. It is an incoherent superposition of quantum mechanical states of Bose condensates. It is parameterized by a surface energy density, and is presumably the correct description of matter when the energy density per unit area is greater than about The Color Glass Condensate may be responsible for universal behavior of all hadronic interactions at high energy.
2.1 The Quark Gluon Plasma
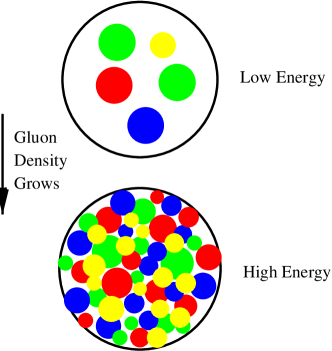
In Fig. 1, a cartoon is shown which illustrates what we expect happens when nucleons, or for that matter any hadrons, are compressed to densities higher than is typical inside a nucleon. Eventually the constituents of the nucleon travel more or less freely around the system as a whole. This system is the Quark Gluon Plasma.
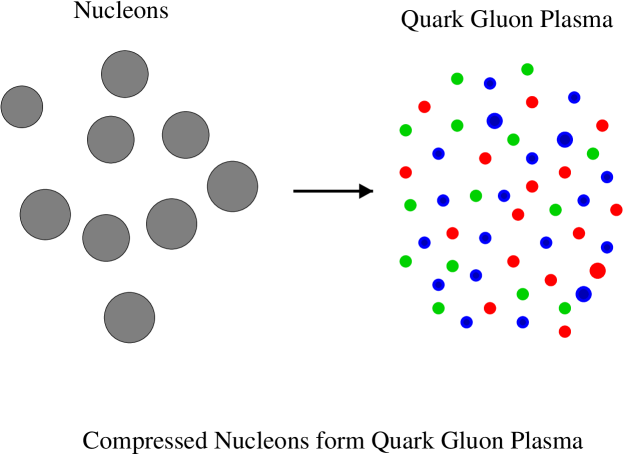
The formation of a Quark Gluon Plasma should begin to occur at about the energy density of matter inside a proton. Since a proton has a size about , and has a rest mass energy of , corresponding to an energy density of about
These observations led a number of people in the late 1970’s to suggest that there was a phase transition between ordinary matter and a Quark Gluon Plasma as is shown in Fig. 2.[1] These conjectures were later firmed up by lattice Monte-Carlo simulations.[2]
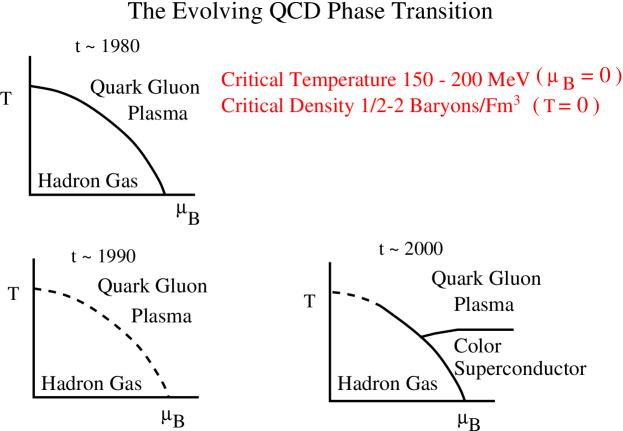
The early lattice Monte-Carlo simulations were unable to properly include the effects of quark masses.[3] About the mid 1980’s arguments appeared which strongly suggested that for realistic values of quark masses, a real phase transition does not occur. Instead there is a sharp change in the properties of the system at some temperature and baryon chemical potential. Although it does not have strong implications for heavy ion collisions, this would affect strongly cosmological scenarios and has potential effect in neutron star cores.
By 2000, the story had become more complicated. It is now believed that there is a line of first order phase transitions in the baryon number chemical potential and temperature plane. There may be some region where the transition is second order or crossover. At high baryon number density and small temperature, there may be a number of color superconducting phases.[4]
The bottom line on this historical aside is that physics is an experimental discipline. I think it is unlikely we will have a first principles understanding of the phase transition in QCD on the basis of pure thought. Much work will have to be done which combines experimental results and difficult numerical, presumably lattice, Monte-Carlo simulation, before we will have a compelling picture of high density matter.
At zero baryon number density, a lot has been learned about the properties of high temperature matter. For technical reasons, lattice Monte Carlo methods are very difficult to implement at finite baryon number density. At finite temperature, one has made remarkable progress.[5]
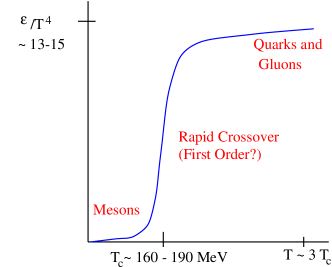
In Fig. 3a, a plot of the energy density, scaled by is shown vs temperature, . This variable is roughly proportional to the number of particle degrees of freedom important at the energy scale corresponding to . A rapid cross over occurs at a temperature of . A first order phase transition cannot be ruled out at this time because the effects of finite quark mass are not under sufficient control. At low temperatures, the number of degrees of freedom are small and consistent with a gas of pions. At high temperatures, the degrees of freedom are roughly that of a massless gas of quarks and gluons. A sharp transition occurs between the meson system and that of the quark and gluons where changes by an order of magnitude. By a temperature of order , the number of important particle degrees of freedom stays approximately constant.
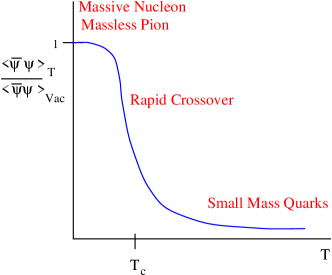
The origin of the proton and neutron mass is one of the mysteries of QCD. The masses of the up and down quarks inside a proton are only a few percent of the nucleon mass. Do not be fooled by those who say that the LHC Higgs boson search is designed to explain the origin of mass. The LHC probes electroweak physics and this gives masses to the up and down quark masses, which can explain only a few percent of the nucleon mass. Even in a world where the up and down quark masses had no mass and electroweak physics was entirely ignored, the nucleon would still have roughly its present mass, and this arises from QCD. It is believed that this mass is obtained by breaking of a chiral symmetry of the strong interactions.
This symmetry is broken in our low temperature world but is restored in the high temperature world. A measure of this symmetry breaking is , the typical value of a condensate. This condensate is composed of quark-antiquark pairs. At low temperatures, this is non-zero, and rapidly goes to zero at the phase transition temperature, as is seen in Fig. 3b. The nucleon mass is proportional to this condensate, and so it goes to zero in the Quark Gluon Plasma.
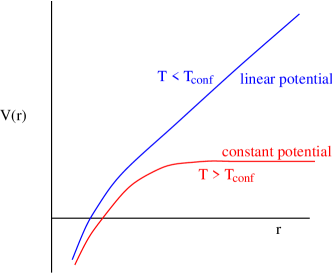
Showing that the confining force between two quarks is linear was one of the first triumphs of lattice QCD. It can be measured as a function of temperature, and indeed in the Quark Gluon Plasma it goes to a constant at long distances. This is shown in Fig. 4a.
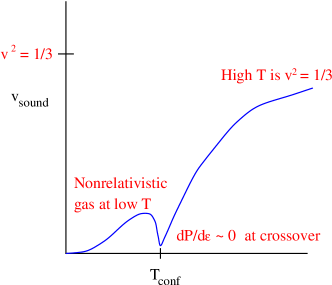
How is this transition from a gas of pions into a Quark Gluon Plasma manifest in terms of bulk properties of the system? The sound velocity is where is the pressure. At the crossover, the pressure is roughly constant while the energy density changes by an order of magnitude. The sound velocity should drop to near zero at , as shown in Fig. 4b.
2.2 The Color Glass Condensate
To understand this new form of matter, it is convenient to imagine a hadron in a reference frame where it has very large longitudinal momentum. We will be interested in the constituents of the hadron wavefunction which have small longitudinal momentum in this frame of reference. These low momentum constituents are produced by the high momentum ones. Because the high momentum constituents appear to have time scales which are Lorentz time dilated compared to their natural scales, and since they induce the low momentum fields associated with the low momentum particles, the low momentum fields evolve very slowly compared to their natural time scale. Hence the term, Color Glass, since the fields are composed of color gluons, and glass because the time scale for evolution of these low momentum fields is much longer than their natural time scale. These fields live on a two dimensional sheet because of the Lorentz contraction of the high energy hadron. We shall argue in the following paragraphs that the phase space-density of these fields becomes large and forms a condensate.[6]
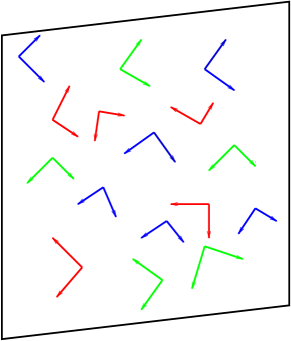
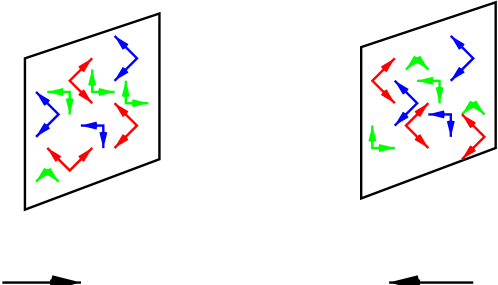
The fields on the two dimensional sheet turn out to be similar to the Lienard-Wiechart potentials of electrodynamics. They correspond to plane waves as in the Weizsacker-Williams approximation of electrodynamics, except that they have color. They have their color electric field perpendicular to their color magnetic field and both perpendicular to their direction of motion, . They have a random color. This is shown in Fig. 5
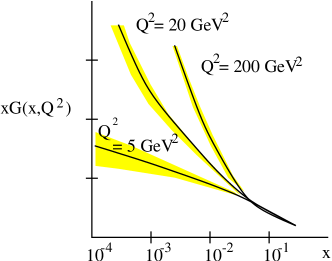
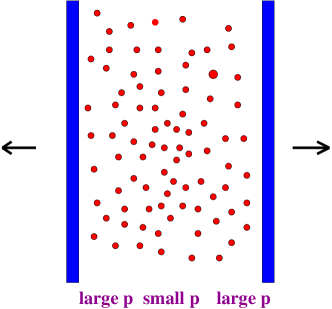
The gluon structure function is experimentally measured to increase at small x. In the reference frame where the hadron is very fast, is the ratio of a constituent energy to the projectile energy. The gluon distribution is shown in Fig. 6a. Note the rapid increase in as a function of for small x. This is the origin of the “small x problem”. This means that the piece of the hadron wavefunction relevant for small x processes has an increasing density of gluons. In Fig. 6b, we look at a hadron headed along the beam direction. As x decreases, the density of gluons increases.
The phase space density of gluons is
| (1) |
where is the hadron size, is the transverse momentum of a constituent, and . The high density of gluons is generated dynamically and is caused by an instability, which is proportional to the density. The instability is stabilized when the density of partons becomes large enough so that interactions of order become of the order of the linear instability. Here . This requires that
| (2) |
The factor of arises because we consider densities per unit area, and carries this dimension. This is called the saturation momentum. The factor of is the strong coupling strength of QCD. When , we expect that , so that the system becomes a high density Bose Condensate.
The name Color Glass Condensate arises therefore because
-
•
Color
The gluons are colored.
-
•
Glass The natural time scale for the evolution of the gluon field is Lorentz time dilated. This is like a glass which is a liquid on long times scales but a solid on short ones.
-
•
Condensate
The phase space density is as large as it can be.
2.3 Space Time Evolution of Heavy Ion Collisions
A collision of two sheets of Colored Glass is shown in Fig. 7.
This is the picture of nucleus-nucleus collision which arises from the Color Glass Condensate.[7]
The time evolution of the matter produced in these collisions is divided into several stages:
-
•
Initial Conditions
For , the two sheets approach one another. The Color Glass is frozen in each nucleus.
-
•
Melting the Color Glass
During the time , the Color Glass melts into quarks and gluons. It is estimated that at RHIC energy. The energy density of the matter at formation is somewhere around .
-
•
Thermalization
During the time , the matter expands and thermalizes. Typical thermalization time is estimated to be .
-
•
Hydrodynamic Expansion
The system expands as a thermal system until a time of decoupling which is typically about at RHIC energy. Here the matter presumably starts as a Quark Gluon Plasma, evolves through a mixed phase of hadrons and Quark Gluon Plasma and eventually becomes a gas of pions. In this stage, most of the physics interesting for studies of the phase transition or cross over between Quark Gluon Plasma and ordinary hadronic matter takes place.
As the Color Glass melts, it produces particles as is shown in Fig. 8.
The fastest particles have their natural time scale time dilated the most, so in the center of mass frame, the fastest particles are produced last. These particles have traveled the longest distance from the collision point, since their formation time is dilated the most. Therefore the matter is formed with a correlation between momentum and position. This is like Hubble flow in cosmology where if you look at stars, the stars which are farthest away move away the fastest. For heavy ions as in cosmology, this description is frame independent. Unlike in cosmology, the Hubble expansion for heavy ion collisions is 1 dimensional.[8]
The density of particles falls as . If the particles expand without interaction, then the energy per particle is constant. If the particles thermalize, then , and since for a massless gas, the temperature falls as . For a gas which is not quite massless, the temperature falls somewhere in the range , that is the temperature is bracketed by the value corresponding to no interaction and to that of a massless relativistic gas. This 1 dimensional expansion continues until the system begins to feel the effects of finite size in the transverse direction, and then rapidly cools through three dimensional expansion. Very close to when three dimensional expansion begins, the system decouples and particle free stream without further interaction to detectors.
3 What Have We Learned?
3.1 The Energy Density is Big
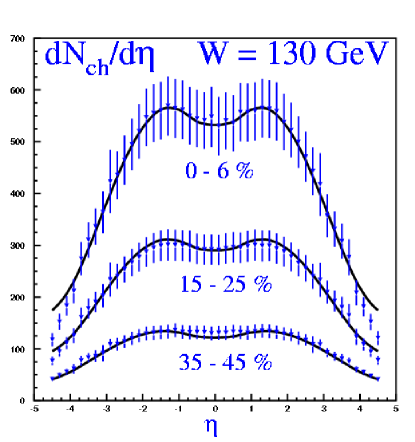
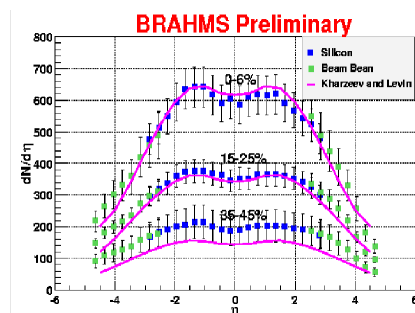
The particle multiplicity as a function of energy has been measured at RHIC and is shown in Fig. 9.[9]-[12] On the same plot is shown lower energy data from the AGS and CERN
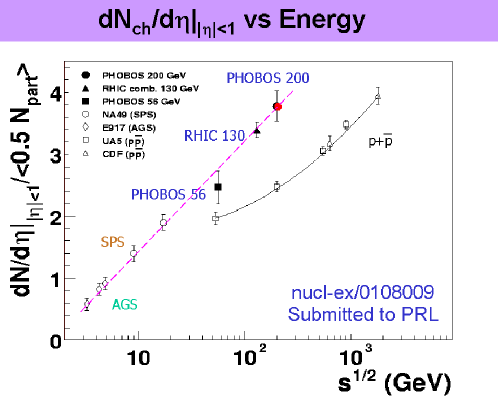
and data from the collider as well. One sees that the energy dependence in collisions is different than that for , and is more or less consistent with a behavior.
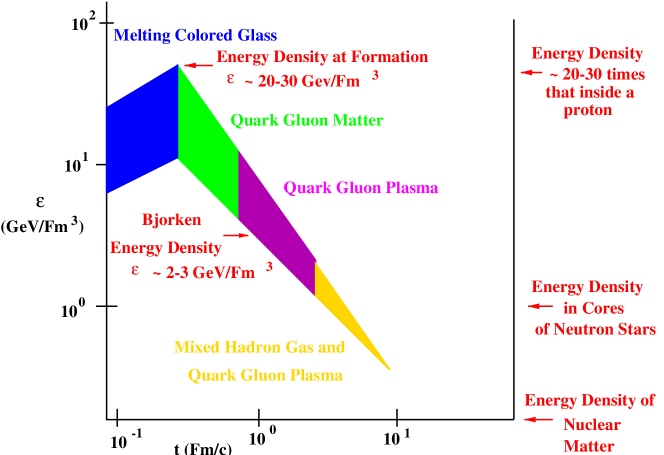
Combining the multiplicity data together with the measurements of transverse energy or of typical particle transverse momenta, one can determine the energy density of the matter when it decouples. One can then extrapolate backwards in time. We extrapolate backwards using 1 dimensional expansion, since decoupling occurs when the matter first begins to expands three dimensionally. We can extrapolate backwards until the matter has melted from a Color Glass. We shall take a conservative overestimate of this time to be of order The extrapolation backwards is bounded by . The lower bound is that assuming that the particles do not thermalize and their typical energy is frozen. The upper bound assumes that the system thermalizes as an ideal massless gas. We argued above that the true result is somewhere in between. When the time is as small as the melting time, then the energy density begins to decrease as time is further decreased.
This bound on the energy density is shown in Fig. 10. On the left axis is the energy density and on the bottom axis is time. The system begins as a Color Glass Condensate, then melts to Quark Gluon Matter which eventually thermalizes to a Quark Gluon Plasma. At a time of a few , the plasma becomes a mixture of quarks, gluons and hadrons which expand together.
At a time of about , the system falls apart and decouples. At a time of , the estimate we make is identical to the Bjorken energy density estimate, and this provides a lower bound on the energy density achieved in the collision. (All estimates agree that by a time of order , matter has been formed.) The upper bound corresponds to assuming that the system expands as a massless thermal gas from a melting time of . (If the time was reduced, the upper bound would be increased yet further.) The bounds on the energy density are therefore
| (3) |
where we included a greater range of uncertainty in the upper limit because of the uncertainty associated with the formation time. The energy density of nuclear matter is about , and even the lowest energy densities in these collisions is in excess of this. At late times, the energy density is about that of the cores of neutron stars, .
At such extremely high energy densities, it is silly to try do describe the matter in terms of anything but its quark and gluon degrees of freedom.
3.2 The Gross Features of Multiplicity Distributions Are Consistent with Colored Glass
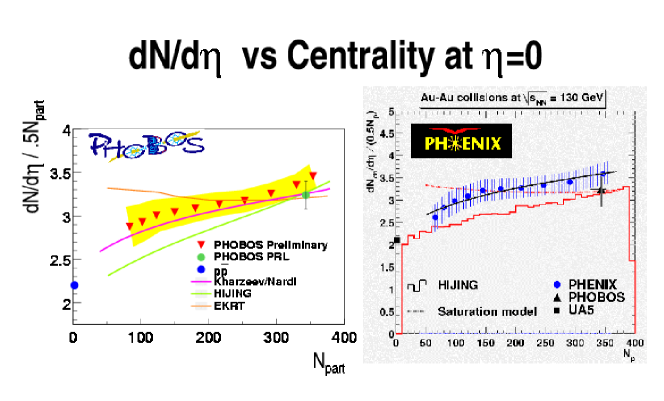
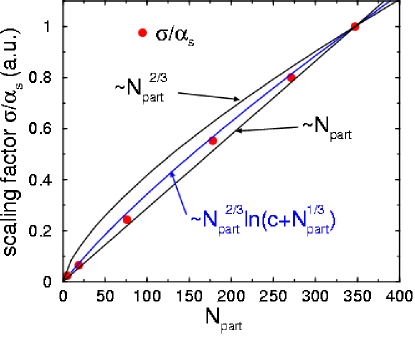
As argued by Kharzeev and Nardi,[13] the density of produced particles per nucleon which participates in the collision, , should be proportional to , and . This dependence follows from the which characterizes the density of the Color Glass Condensate. In Fig. 11, we show the data from PHENIX and PHOBOS[14]. The Kharzeev-Nardi form fits the data well. Other attempts such as HIJING[15], or the so called saturation model of Eskola-Kajantie-Ruuskanen-Tuominen[16] are also shown in the figure.
3.3 Matter Has Been Produced which Interacts Strongly with Itself
In off zero impact parameter heavy ion collisions, the matter which overlaps has an asymmetry in density relative to the reaction plane. This is shown in the left hand side of Fig. 13. Here the reaction plane is along the x axis. In the region of overlap there is an asymmetry in the density of matter which overlaps. This means that there will be an asymmetry in the spatial gradients which will eventually transmute itself into an asymmetry in the momentum space distribution of particles, as shown in the right hand side of Fig. 13.
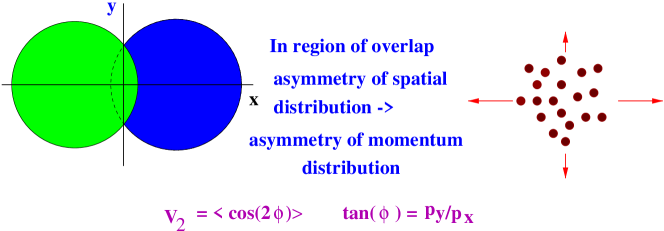
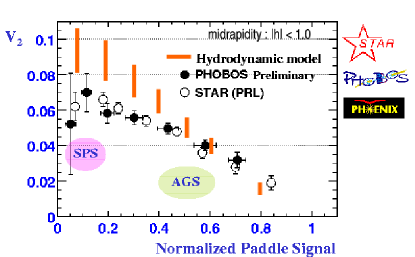
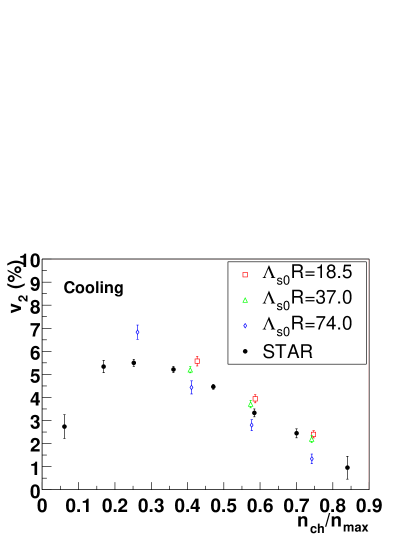
This asymmetry is called elliptic flow and is quantified by the variable . In all attempts to theoretically describe this effect, one needs very strong interactions among the quarks and gluons at very early times in the collision.[19]. In Fig. 14, two different theoretical descriptions are fit to the data by STAR and PHOBOS[20]-[21]. On the left hand side, a hydrodynamical model is used.[22] It is roughly of the correct order of magnitude and has roughly the correct shape to fit the data. This was not the case at lower energy. On the right hand side are preliminary fits assuming Color Glass.[23] Again it has roughly the correct shape and magnitude to describe the data. In the Color Glass, the interactions are very strong essentially from , but unlike the hydrodynamic models it is field pressure rather than particle pressure which converts the spatial anisotropy into a momentum space-anisotropy.
Probably the correct story for describing flow is complicated and will involve both the Quark Gluon Plasma and the Color Glass Condensate. Either description requires that matter be produced in the collisions and that it interacts strongly with itself. In the limit of single scatterings for the partons in the two nuclei, no flow is generated.
4 What Do We Expect to Learn?
4.1 Does the Matter Equilibrate?
One of the most interesting results from the RHIC experiments is the so called “jet quenching”.[24]-[25]. In Fig. 15a, the single particle hadron spectrum is scaled by the same result in collisions and scaled by the number of
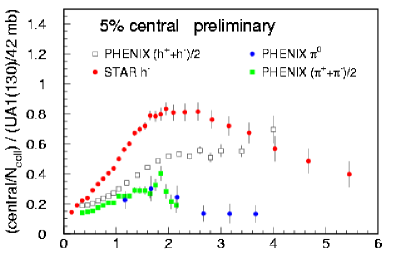
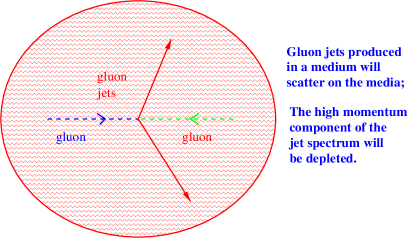
collisions. The number of collisions is the number of nucleon-nucleon interactions, which for central collisions should be almost all of the nucleons. One is assuming hard scattering in computing this number, so that a single nucleon can hard scatter a number of times as it penetrates the other nucleus. The striking feature of this plot is that the ratio does not approach one at large . This would be the value if these particles arose from hard scattering which produced jets of quarks and gluons, and the jets subsequently decayed.
The popular explanation for this is shown in Fig. 15b. Here a pair of jets is produced in a gluon-gluon collision. The jets are immersed in a Quark Gluon Plasma, and rescatter as they poke through the plasma. This shifts the transverse momentum spectrum down, and the ratio to collisions, where there is no significant surrounding media, is reduced.
The data, however suggestive, need to be improved before strong conclusions are drawn. For example, there are large systematic uncertainties in the data which was measured in different detectors and extrapolated to RHIC energy. This will be resolved by measuring collisions at RHIC. There is in addition some significant uncertainty in the AA data which becomes smaller in the ratio to data when the data is measured in the same detector. There are nuclear modifications of the gluon distribution function, an effect which can be determined by measurements on at RHIC. The maximum transverse momentum is limited by the event sample size, and the size will be greatly improved with this years run due to the higher luminosity and longer run time.
One of the reasons why jet quenching is so important for the RHIC program is that it gives a good measure of the degree of thermalization in the collisions. If jets are strongly quenched by transverse momenta of , then because cross sections go like for quarks and gluons, this would be strong evidence for thermalization at the lower energies typical of the emitted particles.
One can look for evidence of thermalization directly from the measured distributions. Here one can do a hydrodynamic computation and in so far as it agrees with the results, one is encouraged to believe that there is thermalization. On the other hand, these distributions may have their origin in the initial conditions for the collision, the Colored Glass. In reality, one will have to understand the tradeoff between both effects.
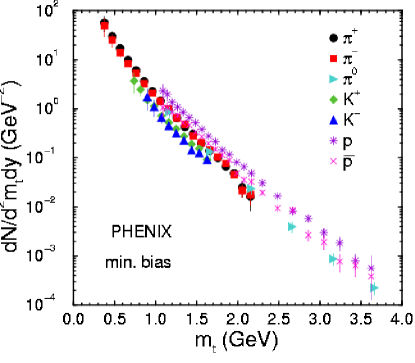
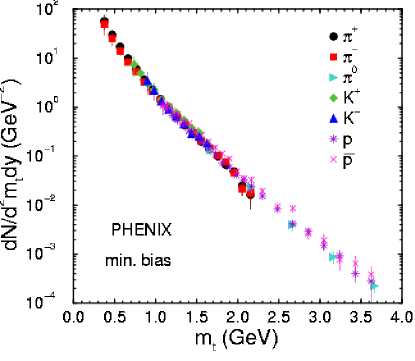
Let us begin with the Color Glass description. In Fig. 16a, the distributions () of identified particle measured for minimum bias events in PHENIX are shown.[25] In Fig 16b, we replot these curves by rescaling by a constant multiplicative factor for each of the particles. In thermal models, this constant factor would be associated with chemical potentials for producing different particle species. These plots fall on top of one another. The distributions therefore scale in .
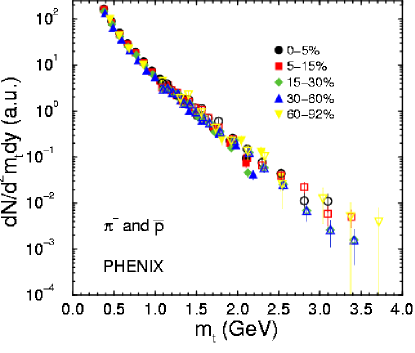
If the distributions scale in , as they appear to do for within the range measured by PHENIX, then the Colored Glass predicts as scaling relation for the distributions:[26]
| (4) |
This means that if we adjust the normalization of the distribution function and the scale of its dependence on then the distributions should fall on top of one another. The scale adjustment should be proportional to which should in turn involve from the running of the coupling. In Fig. 17a, the data at different centralities are rescaled into one another according to the above relation. This seems to describe the data well. In Fig. 17b, the dependence of extracted from the above equation is compared to what is determined from the running coupling constant. Again, this works quite well. The PHENIX data is consistent with the scaling relations predicted by the Color Glass Condensate.
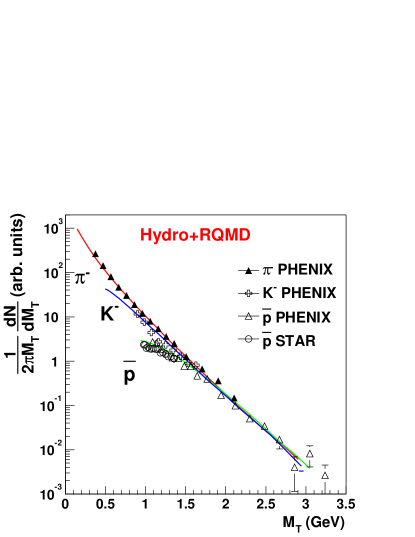
the results of the simulation by Shuryak and Teaney are shown compared to the STAR and PHENIX data.[24]-[25] The shape of the curve is a prediction of the hydrodynamic model, and is parameterized somewhat by the nature of the equation of state. Notice that the STAR data include protons near threshold, and here the scaling breaks down. The hydrodynamic fits get this dependence correctly, and this is one of the best tests of this description. The hydrodynamic models do less well on fits to the more peripheral collisions, but the Colored Glass model gets this more or less correctly. In general, a good place to test the hydrodynamic models predictions is with massive particles close to threshold, since here one deviates in a computable way from the scaling curve, which is arguably determined from parameterizing the equation of state.
If one can successfully argue that there is thermalization in the RHIC collisions, then the hydrodynamic computations become compelling. One should remember that hydrodynamics requires an equation of state plus initial conditions, and these initial conditions are determined by Colored Glass. Presumably, a correct description will require the inclusion of both types of effects.[28]
5 What Do We Hope to Learn?
5.1 Confinement and Chiral Symmetry Restoration
We would like to know whether or not deconfinement has occurred in dense matter or whether chiral symmetry restoration has changed particle masses.
This can be studied in principle by measuring the spectrum of dileptons emitted from the heavy ion collision. These particles probe the interior of the hot matter since electromagnetically interacting particles are not significantly attenuated by the hadronic matter. For electron-positron pairs, the mass distribution has been measured in the CERES experiment at CERN[29], and is shown in Fig. 19. Shown in the plot is the distribution predicted from extrapolating from collisions. There should be a clear and peak, which has disappeared. This has been interpreted as a resonance mass shift,[30], enhanced production, [31] but is most probably collisional broadening of the resonances in the matter produced in the collisions.[32] Nevertheless, if one makes a plot such as this and the energy density is very high and there are no resonances at all, then this would be strong evidence that the matter is not hadronic, i. e. the hadrons have melted.
The resolution in the CERES experiment is unpleasantly large, making it difficult to unambiguously interpret the result. Whether or not such an experiment could be successfully run at RHIC, much less whether the resolution could be improved, is the subject of much internal debate among the RHIC experimentalists.
5.2 Confinement and Suppression
In Fig. 20, the NA(50) data for production is shown.[33] In the first figure, the ratio of production cross section to that of Drell-Yan is shown as a function of , the transverse energy, for the lead-lead
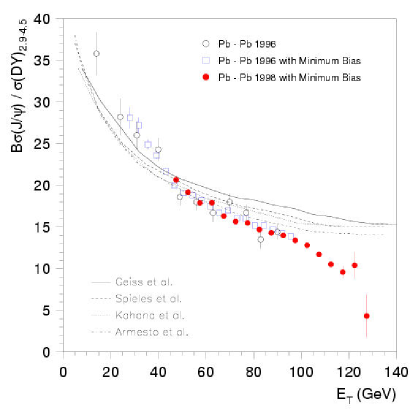
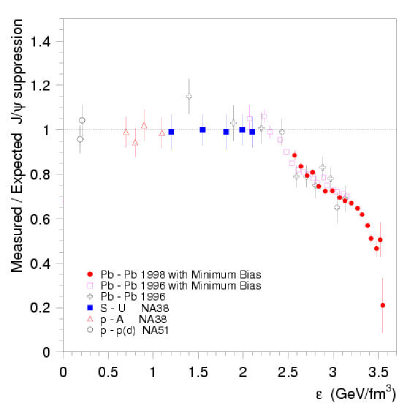
collisions at CERN. There is a clear suppression at large which is greater than the hadronic absorption model calculations which are plotted with the data.[34] In the next figure, the theoretically expected suppression based on hadronic absorption models is compared to that measured as a function of the Bjorken energy density for various targets and projectiles. There appears to be a sharp increase in the amount of suppression for central lead-lead collisions.
Is this suppression due to Debye screening of the confinement potential in a high density Quark Gluon Plasma?[35]-[37] Might it be due higher twists, enhanced rescattering, or changes in the gluon distribution function?[38]-[39] Might the suppression be changed into an enhancement at RHIC energies and result from the recombination in the produced charm particles, many more of which are produced at RHIC energy?[40]-[43]
These various descriptions can be tested by using the capability at RHIC to do and as well as . Issues related to multiple scattering, higher twist effects, and changes in the gluon distribution function can be explored. A direct measurement of open charm will be important if final state recombination of the produced open charm makes a significant amount of ’s.
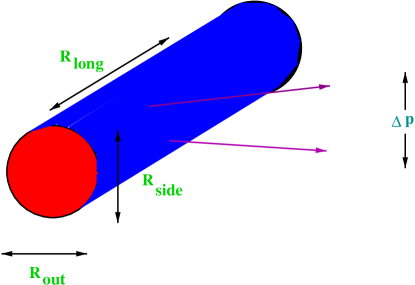
5.3 The Lifetime and Size of the Matter Produced
The measurement of correlated pion pairs, the so called HBT pion interferometry, can measure properties of the space-time volume from which the hadronic matter emerges in heavy ion collisions.[44] The quantities and shown in Fig. 21 measure the transverse size of the matter at decoupling and the decoupling time.
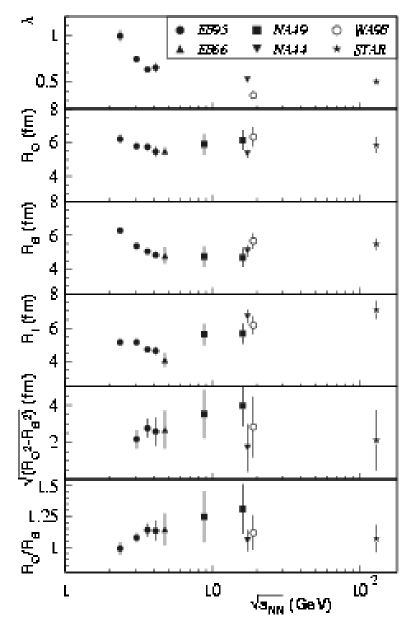
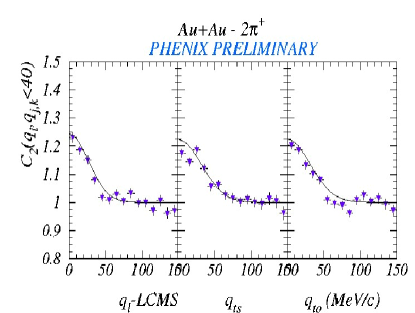
In Fig. 22, the data from STAR and PHENIX is shown.[45]-[46] There is only a weak dependence on energy, and the results seem to be more or less what was observed at CERN energies. This is a surprise, since a longer time for decoupling is expected at RHIC. Perhaps the most surprising result is that is close to 1, where most theoretical expectations give a value of about .[47]-[48] Perhaps this is due to greater than expected opacity of the emitting matter? At this time, there is no consistent theoretical description of the HBT data at RHIC. Is there something missing in our space-time picture?
5.4 The Flavor Composition of the Quark Gluon Plasma
The first signal proposed for the existence of a Quark Gluon Plasma in heavy ion collisions was enhanced strangeness production.[49] This has lead to a comprehensive program in heavy ion collisions to measure
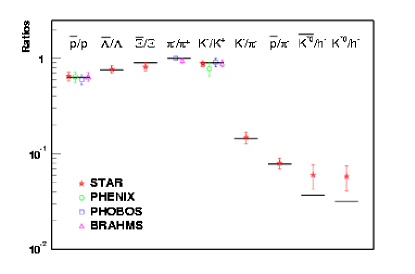
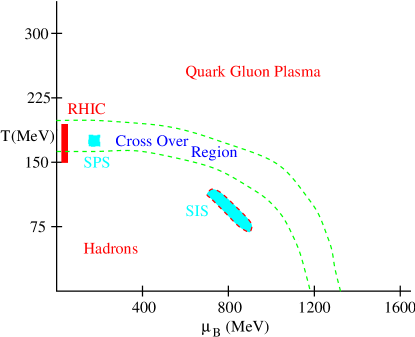
the ratios of abundances of various flavors of particles.[50]. In Fig. 23a, the ratios of flavor abundances is compared to a thermal model for the particle abundances.[51] - [53] The fit is quite good. In Fig. 23b, the temperature and baryon chemical potential extracted from these fits is shown for experiments at various energies and with various types of nuclei. It seems to agree reasonably well with what might be expected for a phase boundary between hadronic matter and a Quark Gluon Plasma.
This would appear to be a compelling case for the production of a Quark Gluon Plasma. The problem is that the fits done for heavy ions to particle abundances work even better in collisions. One definitely expects no Quark Gluon Plasma in collisions. There is a deep theoretical question to be understood here: How can thermal models work so well for non-thermal systems? Is there some simple saturation of phase space? The thermal model description can eventually be made compelling for heavy ion collisions once the degree of thermalization in these collisions is understood.
6 Summary
-
•
What are we trying to understand?
We want to make and study new forms of high energy density matter. At early times in a heavy ion collisions, this might be a Color Glass Condensate, and at later times a Quark Gluon Plasma.
-
•
What have we already learned?
Matter has been produced at energy densities so high it can only be simply described in terms of quarks and gluons. This matter is strongly interacting with itself. The multiplicity distributions of matter produced in heavy ion collisions is consistent with it being a Colored Glass. Flow and distributions are consistent with both a Quark Gluon Plasma and a Colored Glass.
-
•
What do we expect to learn?
By measuring the distributions of heavy hadrons, we can resolve the differences between various theoretical descriptions of the evolution of the produced matter. By measuring high hadrons in AA and pA collisions, we can determine whether jet quenching occurs, and to what degree the matter has thermalized.
If thermalization has occurred, we can then perhaps measure the equation of state. This is important because the equation of state reflects the bulk properties of the matter, and determines hydrodynamic and static properties of Quark Gluon Matter.
-
•
What do we hope to learn?
Through measurements of lepton pairs, we can determine whether or not resonances have shifted in mass, have broadened or melted. Through measurements of pion pairs, we can find the spatial size and lifetime of the matter produced in heavy ion collisions, and test space-time pictures of ultrarelativistic nuclear collisions. Flavor abundances can tell us about the macroscopic properties of hadronic matter. The abundance may tell us whether the matter produced in these collisions is confining or not.
We must turn to the problem of determining the properties of matter made in heavy ion collisions. We have made matter at such a high energy density that it can only be simply described in terms of quarks and gluons. The future will be to understand the properties of this matter.
At present we are developing the theoretical and experimental tools to analyze ultra-relativistic heavy ion collisions. It is a learning time for both theorists and experimentalists. Ultimately, we will need experiments with , and to resolve the initial state effects due to a Color Glass Condensate from effects related to the evolution of the matter as a Quark Gluon Plasma. A more precise determination of the properties of Color Glass Condensate would be possible with a high energy collider or in the LHC heavy ion experiments.
7 Acknowledgments
I thank my colleagues in the theory groups at BNL who generously helped me in the development of this presentation.
This manuscript has been authorized under Contract No. DE-AC02-98H10886 with the U. S. Department of Energy.
References
- [1] J. C. Collins and M. J. Perry, Phys. Rev. Lett. 34, 1353 (1975); G. Baym and S. A. Chin, Phys. Lett. B62, 241 (1976).
- [2] L. McLerran and B. Svetitsky, Phys. Lett. B98, 195 (1981); Phys. Rev. D24, 450 (1981); J. Kuti, J. Polonyi, and K. Szlachanyi, Phys. Lett. B98, 199, (1981); J. Engels, F. Karsch and H. Satz, Phys. Lett. B101, 89 (1981).
- [3] B. Svetitsky and L. Yaffe, Phys. Rev. D26, 963 (1982); Nucl. Phys. B210, 423 (1982). R. Pisarski and F. Wilczek, Phys. Rev. D29, 338 (1984);
- [4] R. Rapp, T. Schafer E. Shuryak and M. Velkovsky, Phys. Rev. Lett. 81, 53 (1998) M. Alford, K. Rajagopal and F. Wilczek, Phys. Lett. B422, 247 (1998).
- [5] For a summary of recent results see the excellent review talk by F. Karsch, Lectures at the 40’th Internationale Universitatswochen fuer Theoretische Physik, Dense Matter, Schladming, Styria, Austria, 3-10 March 2001, hep-lat/0106019.
- [6] L. V. Gribov, E. M. Levin and M. G. Ryskin, Phys. Rept. 100, 1 (1983); A. H. Mueller and Jian-wei Qiu, Nucl. Phys. B268, 427 (1986); L. D. McLerran and R. Venugopalan, Phys. Rev. D49, 2233(1994); 3352 (1994); E. Iancu, A. Leonidov and L. D. McLerran, Nucl. Phys. A692(2001); E. Ferreiro E. Iancu, A. Leonidov and L. D. McLerran, hep-ph/0109115;
- [7] A. Kovner, L. D. McLerran and H. Weigert, Phys. Rev. D52, 6231 (1995); 3809 (1995); A. Krasnitz and R. Venugopalan, Phys. Rev. Lett 84, 4309 (2000); Nucl. Phys. B557, 237 (1999); A. Krasnitz, Y. Nara and R. Venugopalan, Phys. Rev. Lett. 87 , 192302 (2001).
- [8] J. D. Bjorken, Phys. Rev. D27, 140 (1983).
- [9] C. Adler et. al. Phys. Rev. Lett. 87, 112303 (2001)
- [10] K. Adcox et. al. Phys. Rev. Lett. 86, 3500 (2001); 87, 052301 (2001).
- [11] M. D. Back et. al. Phys. Rev. Lett. 85, 3100 (2000); 88, 22302 (2002).
- [12] J. Beardon et. al. Phys. Lett. B523, 227 (2001)
- [13] D. Kharzeev and M. Nardi, Phys. Lett B507, 121 (2001).
- [14] B. Back et. al. nucl-ex/0105011; K. Adcox et. al. Phys. Rev. Lett. 86, 3500 (2001).
- [15] M. Gyulassy and Xin-Nian Wang, Comput. Phys. Commun 83, 307 (1994).
- [16] K. Eskola, K. Kajantie, P. Ruuskanen and K. Tuominen, Nucl. Phys. B570, 379 (2000); K. Eskola, K. Kajantie and K. Tuominen, Phys. Lett. B497, 39 (2001)
- [17] D. Kharzeev and E. Levin, nucl-th/0108006.
- [18] B. Back et. al. Phys. Rev. Lett. 87, 102303 (2001); I. Beardon et. al. Nucl-ex/0112001.
- [19] S. Voloshin and Y. Zhang, Z. Phys. C70, 665 (1996); A. M. Poskhanzer and S. A. Voloshin, Phys. Rev. C58, 1671 (1998); J. Y. Ollitrault, Phys. Rev. D46, 229 (1992)
- [20] K, H. Ackermann et. al. Phys. Rev. Lett. 86, 402 (2001); C. Adler et. al. Phys. Rev. Lett. 87, 182301 (2001).
- [21] R. Lacey (for the PHENIX collaboration), Nucl. Phys. A698, 559 (2002)
- [22] Peter F. Kolb, J. Sollfrank, and U. Heinz, Phys. Lett. B459, 667 (1999); P. F. Kolb, P. Huovinen, U. Heinz and H. Heiselberg, Phys. Lett. B500, 232 (2001).
- [23] A. Krasnitz, Y. Nara and R. Venugopalan, in preparation.
- [24] C. Adler, Phys. Rev. Lett. 87 112303 (2001)
- [25] K. Adcox et. al. Phys. Rev. Lett 88, 022301 (2002).
- [26] J. Schaffner-Bielich, D. Kharzeev, L. D. McLerran and R. Venugopalan, nucl-th/0108048.
- [27] D. Teaney and E. V. Shuryak, Phys. Rev. Lett. 83, 4951 (1999): D. Teaney, J. Lauret and E. V. Shruyak, nucl-th/0110037
- [28] D. K. Srivastava, Phys. Rev. C64, 064901 (2001).
- [29] G. Agakishiev et. al. Nucl. Phys. A638, 159 (1998).
- [30] G. E. Brown and M. Rho, Phys. Rept., 269, 333 (1996).
- [31] J. Kapusta, D. Kharzeev, L. D. McLerran, Phys. Rev. D53, 5028 (1996).
- [32] R. Rapp, G. Chanfry and J. Wambach, Phys. Rev. Lett. 76, 368 (1996).
- [33] For the latest results, see M. C. Abreau et. al. Nucl. Phys. A661, 93 (1999).
- [34] J. Geiss, E. Bratskaya, W. Cassing and C. Greiner, nucl-th/981005,; C. Spieles, R. Vogt, L. Gerland, S. A. Bass, M. Bleicher, H. Stocker and W. Greiner, Phys. Rev. C60, 054901 (1999); D. E. Kahana and S. H. Kahana, Phys. Rev. C60, 065206 (1999); N. Armesto, A. Capella, E. Ferreiro, A. Kaidalov and D. Sousa, Nucl. Phys. A698, 583 (2002).
- [35] T. Matsui and H. Satz, Phys. Lett., bf B178, 416 (1986).
- [36] D. Kharzeev and H. Satz, Phys. Lett. B334, 155 (1994).
- [37] Jean-Paul Blaizot and Jean-Yves Ollitrault, Phys. Rev. Lett. 77, 1703 (1996).
- [38] J. Armesto and A. Capella, Phys. Lett. B430, 23 (1998); A. Capella, E. G. Ferreiro, A. Kaidalov, Phys. Rev. Lett. 85, 2080 (2000).
- [39] Jian-wei Qiu, James P. Vary and Xiao-fei Zhang, hep-ph/9809442.
- [40] R. Thews, M. Schroeder and J. Rafelski, Phys. Rev. C63, 054905 (2001).
- [41] P. Braun-Munzinger and J. Stachel, Phys. Lett. B490, 196 (2000).
- [42] P. Braun-Munzinger and K. Redlich, Eur. Phys. J. C16, 519 (2000).
- [43] M. Gorenstein and M. Gazdzicki, Phys. Rev. Lett. 83, 4009 (1999). M. Gorenstein, A. P. Kostyk, H. Stoecker and W. Greiner, Phys. Lett. B509, 277 (2001); M. Gorenstein, A. Kostyk, L. McLerran, H. Stoecker and W. Greiner, hep-ph/0012292; M. Gorenstein, A. Kostyk, H. Stocker and W. Greiner, Phys. Lett. B524, 265 (2002)
- [44] M. Gyulassy, S. Kauffmann and L. Wilson, Phys. Rev. C20, 2267 (1979).
- [45] C. Adler et. al. Phys. Rev. Lett. 87 , 082301 (2001).
- [46] K. Adcox et. al. nucl-es/0201008.
- [47] S. Chapman, P. Scotto and U. Heinz, Phys. Rev. Lett. 74, 4400 (1995); S. Chapman and U. Heinz, Phys. Lett B340, 250 (1994).
- [48] S. Soff, S. Bass and A. Dumitru, Phys. Rev. Lett. 86, 3981 (2001).
- [49] B. Muller and J. Rafelski, Phys. Rev. Lett. 48 1066 (1986); P. Koch, B. Muller and J. Rafelski, Phys. Rept. 142 167 (1986).
- [50] For a summary see: M. Kaneta and N. Xu, J. Phys. G27, 589 (2001).
- [51] For a state of the art assessment review, see Jean. Cleymans, hep-ph/0201142; J. Cleymans and K. Redlich, Phys. Rev. Lett. 81, 5284 (1998); Phys. Rev. C60, 054908 (1999).
- [52] P. Braun-Munzinger, J. Stachel, J. P. Wessels and N. Xu, Phys. Lett. B365, 1 (1996); P. Braun-Munzinger, I. Heppe and J. Stachel, Phys. Lett. B465, 15 (1999).
- [53] G. Yen and M. Gorenstein, Phys. Rev. C59, 2788 (1999).