Evidence for Neutrinoless Double Beta Decay
Abstract
The data of the HEIDELBERG-MOSCOW double beta decay experiment for the measuring period August 1990 - May 2000 (54.9813 kg y or 723.44 molyears), published recently, are analyzed using the potential of the Bayesian method for low counting rates. First evidence for neutrinoless double beta decay is observed giving first evidence for lepton number violation. The evidence for this decay mode is 97 (2.2) with the Bayesian method, and 99.8 c.l. (3.1) with the method recommended by the Particle Data Group. The half-life of the process is found with the Bayesian method to be (95% c.l.) with a best value of . The deduced value of the effective neutrino mass is, with the nuclear matrix elements from [1], = (0.11 - 0.56) eV (95 c.l.), with a best value of 0.39 eV. Uncertainties in the nuclear matrix elements may widen the range given for the effective neutrino mass by at most a factor 2. Our observation which at the same time means evidence that the neutrino is a Majorana particle, will be of fundamental importance for neutrino physics. PACS. 14.69.Pq Neutrino mass and mixing - 23.40.Bw Weak-interaction and lepton (including neutrino) aspects - 23.40.-s Beta decay; double beta decay; electron and muon capture.
The neutrino oscillation interpretation of the atmospheric and solar neutrino data, deliver a strong indication for a non-vanishing neutrino mass. While such kind of experiments yields information on the difference of squared neutrino mass eigenvalues and on mixing angles, the absolute scale of the neutrino mass is still unknown. Information from double beta decay experiments is indispensable to solve these questions [11, 10]. Another important problem is that of the fundamental character of the neutrino, whether it is a Dirac or a Majorana particle [2, 3]. Neutrinoless double beta decay could answer also this question. Perhaps the main question, which can be investigated by double beta decay with high sensitivity, is that of lepton number conservation or non-conservation.
Double beta decay, the rarest known nuclear decay process, can occur in different modes:
| (1) | |
| (2) | |
| (3) |
While the two-neutrino mode (1) is allowed by the Standard Model of particle physics, the neutrinoless mode ( ) (2) requires violation of lepton number (L=2). This mode is possible only, if the neutrino is a Majorana particle, i.e. the neutrino is its own antiparticle (E. Majorana [2], G. Racah [3], for subsequent works we refer to [5, 6, 7], for some reviews see [8, 9, 10, 12]). First calculations of decay based on the Majorana theory have been done by W.H. Furry [4].
Neutrinoless double beta decay can not only probe a Majorana neutrino mass, but various new physics scenarios beyond the Standard Model, such as R-parity violating supersymmetric models, R-parity conserving SUSY models, leptoquarks, violation of Lorentz-invariance, and compositeness (for a review see [10, 13, 14]). Any theory containing lepton number violating interactions can in principle lead to this process allowing to obtain information on the specific underlying theory. The experimental signature of the neutrinoless mode is a peak at the Q-value of the decay.
The HEIDELBERG-MOSCOW double beta decay experiment in the Gran Sasso Underground Laboratory searches for double beta decay of + 2 + (2) since 1990. It is the most sensitive double beta experiment since almost eight years now. The experiment operates five enriched (to 86) high-purity detectors, with a total mass of 11.5 kg, the active mass of 10.96 kg being equivalent to a source strength of 125.5 mol nuclei. This is the largest source strength in use.
The high energy resolution of the Ge detectors assures that there is no background for a line from the two-neutrino double beta decay in this experiment.
The unique feature of neutrinoless double beta decay is that a measured half-life allows to deduce information on the effective Majorana neutrino mass , which is a superposition of neutrino mass eigenstates. The half-life is given, when ignoring contributions from right-handed weak currents, by [8, 9].
| (1) |
| (2) |
Here () are the contributions to from individual mass eigenstates, with denoting relative Majorana phases connected with CP violation and, denotes a nuclear matrix element, which can be calculated.
The effective mass is closely related to the parameters of neutrino oscillation experiments. The importance of for solving the problem of the structure of the neutrino mixing matrix and in particular to fix the absolute scale of the neutrino mass spectrum which cannot be fixed by - oscillation experiments alone, has been discussed in detail in e.g. [11].
In this paper, we present a new, refined analysis of the data obtained in the HEIDELBERG-MOSCOW experiment during the period August 1990 - May 2000 [15]. The analysis concentrates on the neutrinoless decay mode which is the one relevant for particle physics (see, e.g. [11, 10]). A description of the HEIDELBERG-MOSCOW experiment has been given recently in [16], and in [15].
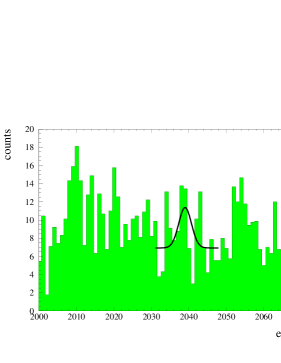
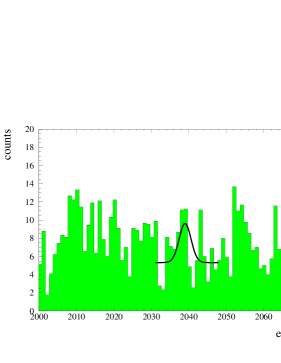
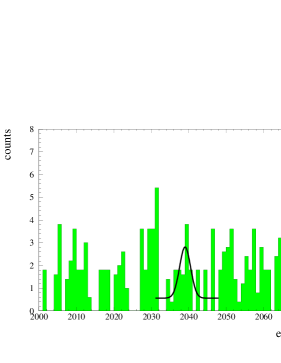
Fig. 1 shows the combined spectrum of the five enriched detectors obtained over the period August 1990 - May 2000, with a statistical significance of 54.981 kg y (723.44 molyears), around the Q-value of double beta decay. The latter has been determined to be Qββ = 2039.006(50) keV in a recent precision experiment [17]. Fig. 2 shows the spectrum obtained with detectors Nr. 1,2,3,5 over the period August 1990 - May 2000, with a significance of 46.502 kg y. Fig. 3 shows the spectrum of single site events (SSE) obtained for detectors 2,3,5 in the period November 1995 - May 2000, under the restriction that the signal simultanously fulfills the criteria of all three methods of pulse shape analysis we have recently developed [18, 19] and with which we operate all detectors except detector 1 (significance 28.053 kg y). Double beta events are single site events confined to a few mm region in the detector, corresponding to the track length of the emitted electrons, in contrast to e.g. multiple scattering - events. From simulation we expect that about 5 of the double beta single site events should be seen also as MSE. This is caused by bremsstrahlung of the emitted electrons [20].
All the spectra are obtained after rejecting coincidence events between different Ge detectors and events coincident with activation of the muon shield. The spectra which are taken in bins of 0.36 keV are shown in Figs. 1,2,3 in 1 keV bins, which explains the broken number in the ordinate. We do the analysis of the measured spectra with (Fig. 1) and without the data of detector 4 (Figs. 2,3) since the latter does not have a muon shield and has the weakest energy resolution. We ignore for each detector the first 200 days of operation, corresponding to about three half-lives of ( = 77.27 days), to allow for some decay of short-lived radioactive impurities.
The background rate in the energy range 2000 - 2080 keV is found to be (0.17 0.01) events/ kg y keV (without pulse shape analysis) considering all data as background. This is the lowest value obtained in such type of experiments. The energy resolution at the Qββ value in the sum spectra is extrapolated from the strong lines in the spectrum to be (4.00 0.39) keV for the spectra with detector 4, and (3.74 0.42) keV (FWHM) for those without detector 4. The energy calibration of the experiment has an uncertainty of 0.20 keV. For more experimental details see [16, 15].
1. Bayesian method, which is used widely at present (see, e.g. [21]). This method is particularly suited for low counting rates, where the data follow a Poisson distribution, that cannot be approximated by a Gaussian (see, also [22, 23]).
2. Method recommended by the Particle Data Group [25].
The - method is not used since it is expected to have some limitation for application at low counting rates, as also the Maximum Likelihood Method. The limitation is due to the Gaussian approximations inherent in these methods.
To be conservative, we first concentrate on the spectra without pulse shape analysis. For the evaluation, we consider the raw data of the detectors. After that we shall turn to the analysis of the spectrum obtained with pulse shape discrimination.
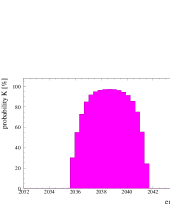
Figs. 4,5,6 show the result of a Bayesian peak detection procedure. One knows that the lines in the spectrum are Gaussians with a standard deviation = 1.70 (1.59) keV corresponding to 4.0 (3.7) keV FWHM. Given the position of a line, we used Bayes theorem to infer the contents of the line and the level of a constant background. We first describe the procedure summarily and then give some mathematical details.
Bayesian inference yields the joint probability distribution for both parameters. The background level was integrated out. This yielded the distribution of the line contents. If the distribution has its maximum at zero contents, only an upper limit for the contents can be given and the procedure does not suggest the existence of a line. If the distribution has its maximum at non-zero contents, the existence of a line is suggested and one can define the probability K that there is a line with non-zero contents. It is associated with an error interval containing with probability K the true value of the contents. The Bayesian probability K agrees with the confidence of classical statistics in the case of a Gaussian likelihood function.
For every energy E of the spectra of Figs. 1,2,3, we have determined the probability K that there is a line at E. All the remainder of the spectrum was considered to be background in this search. The result is given on the left-hand sides of Figs. 4,5,6.
We define the Bayesian procedure in some more detail. It starts from the distribution of the count rates in the bins 1..M of the spectrum - given two parameters . The distribution is the product
| (3) |
of Poissonians for the individual bins. The expectation value is the superposition
| (4) |
of the form factors f1 of the line and f2 of the background; i.e. f1(k) is the Gaussian centered at E with the above-mentioned standard deviation and f2(k)f2 is a constant.
Since
| (5) |
one has
| (6) |
Hence, parametrizes the total intensity in the spectrum, and is the relative intensity in the Gaussian line.
Prior distributions are given by Jeffreys’ rule (5.35 of [24]). The parameter is integrated out and the posterior distribution P() of the relative contents of the spectral line is obtained.
The peak detection procedure yields lines at the positions of known weak -lines from the decay of at 2010.7, 2016.7, 2021.8 and 2052.9 keV [27]. In addition, a line centered at 2039 keV shows up. This is compatible with the Q-value [17, 26] of the double beta decay process. We emphasize, that at this energy no -line is expected according to the compilations in [27]. We do not find indications for the lines from at 2034.7 keV and 2042 keV discussed earlier [20] (Figs. 4,5).
Bayesian peak detection suggests a line at Qββ whether or not one includes detector Nr. 4 without muon shield (Figs. 4,5). The line is also suggested in Fig. 6 after removal of multiple site events (MSE), see below.
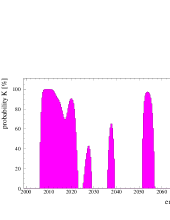
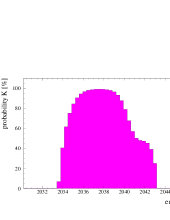
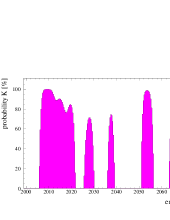
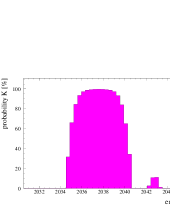
On the left-hand side of Figs. 4,5,6, the background intensity (1-) identified by the Bayesian procedure is too high because the procedure averages the background over all the spectrum (including lines) except for the line it is trying to single out. Therefore on the right-hand side of Figs. 4,5,6, the peak detection procedure is carried out within an energy interval that does not contain (according to the left-hand side) lines other than the one at Qββ. Still the interval is broad enough (about 5 standard deviations of the Gaussian line) for a meaningful analysis. We find the probability K = 96.5 that there is a line at 2039.0 keV in the spectrum shown in Fig. 1. This is a confidence level of 2.1 in the usual language. For the spectrum shown in Fig. 2, we find a probability for a line at 2039.0 keV of 97.4 (2.2 ). In this case the number of events is found to be 1.2 to 29.4 with 95 c.l.. It is 7.3 to 22.6 events with 68.3 c.l..The most probable number of events (best value) is 14.8 events.
We also applied the method recommended by the Particle Data Group [25]. This method (which does not use the information that the line is Gaussian) finds a line at 2039 keV on a confidence level of 3.1 (99.8 c.l.). Such value is obtained in a wide range of the assumed width of the signal and the energy range of evaluation.
| N | N Bin | Energy keV | N | N Bin | Energy keV |
|---|---|---|---|---|---|
| 1. | 5653 | 2034.66 | 6. | 5666 | 2039.33 |
| 2. | 5658 | 2036.46 | 7. | 5669 | 2040.41 |
| 3. | 5660 | 2037.18 | 8. | 5674 | 2042.21 |
| 4. | 5664 | 2038.61 | 9. | 5680 | 2044.37 |
| 5. | 5665 | 2038.97 |
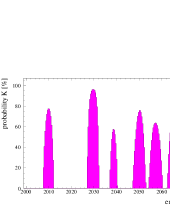
From the analysis of the single site events, we find after 28.053 kg y of measurement 9 SSE events in the region 2034.1 - 2044.9 keV ( 3 around Qββ) (Table 1). Analysis with the Bayesian method of the single site event spectrum (Fig. 3), as described before, shows again evidence for a line at the energy of Qββ (Fig. 6). Analyzing the range of 2032 - 2046 keV, we find the probability of 96.8 that there is a line at 2039.0 keV. We thus see a signal of single site events, as expected for neutrinoless double beta decay, precisely at the Qββ value obtained in the precision experiment of [17]. The analysis of the line at 2039.0 keV before correction for the efficiency yields 4.6 events (best value) or (0.3 - 8.0) events within 95 c.l. ((2.1 - 6.8) events within 68.3 c.l.). Corrected for the efficiency to identify an SSE signal by successive application of all three PSA methods, which is 0.55 0.10, we obtain a signal with 92.4 c.l.. The signal is (3.6 - 12.5) events with 68.3 c.l. (best value 8.3 events).
The PDG method gives a signal at 2039.0 keV of 2.8 (99.4). The analysis given in Fig. 6 (left part) shows partly drastic differences in the relative intensities of other identified lines compared to the full spectra, which should reflect their different composition of single site and multiple site events.
We emphasize that we find in all analyses of our spectra a line at the value of Qββ. Under the assumption that the signal at Qββ is not produced by a background line of presently unknown origin, we can translate the observed number of events into half-lives. We give in Table 2 conservatively the values obtained with the Bayesian method and not those obtained with the PDG method. Also given in Table 2 are the effective neutrino masses deduced using the matrix elements of [1, 29].
We derive from the data taken with 46.502 kg y the half-life (95 c.l.). The analysis of the other data sets, shown in Table 2, and in particular of the single site events data, which play an important role in our conclusion, confirm this result.
| Significan- | Detectors | eV | Conf. | |
| ce | level | |||
| 54.9813 | 1,2,3,4,5 | (0.08 - 0.54) | ||
| 54.9813 | 1,2,3,4,5 | (0.26 - 0.47) | ||
| 54.9813 | 1,2,3,4,5 | 0.38 | Best Value | |
| 46.502 | 1,2,3,5 | (0.11 - 0.56) | ||
| 46.502 | 1,2,3,5 | (0.28 - 0.49) | ||
| 46.502 | 1,2,3,5 | 0.39 | Best Value | |
| 28.053 | 2,3,5 SSE | (0.10 - 0.51) | ||
| 28.053 | 2,3,5 SSE | (0.25 - 0.47) | ||
| 28.053 | 2,3,5 SSE | 0.38 | Best Value |
The result obtained is consistent with the limits given earlier by the HEIDELBERG-MOSCOW experiment [15], considering that the background had been determined more conservatively there. It is also consistent with all other double beta experiments - which still reach less sensitivity. A second Ge-experiment, which has stopped operation in 1999 after reaching a significance of 9 kg y yields (if one believes their method of ’visual inspection’ in their data analysis) in a conservative analysis a limit of (90% c.l.). The geochemical experiment yields eV (68 c.l.), the cryogenic experiment yields eV and the CdWO4 experiment eV, all derived with the matrix elements of [1, 29] to make the results comparable to the present value (for references see [10]).
Concluding we obtain, with more than 95 probability, first evidence for the neutrinoless double beta decay mode.
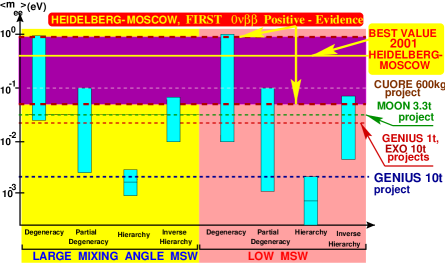
As a consequence, on the same confidence level, lepton number is not conserved. Further the neutrino is a Majorana particle. We conclude from the various analyses given above the effective mass to be = (0.11 - 0.56) eV (95 c.l.), with best value of 0.39 eV. Allowing conservatively for an uncertainty of the nuclear matrix elements of 50 (for detailed discussions of the status of nuclear matrix elements we refer to [29, 12, 10, 30]) this range may widen to = (0.05 - 0.84) eV (95 c.l.).
In this conclusion, it is assumed that contributions to decay from processes other than the exchange of a Majorana neutrino (see, e.g. [28, 10]) are negligible.
With the limit deduced for the effective neutrino mass, the HEIDELBERG-MOSCOW experiment excludes several of the neutrino mass scenarios allowed from present neutrino oscillation experiments (see Fig. 7) - allowing mainly only for degenerate and partially degenerate mass scenarios and an inverse hierarchy 3 - scenario (the latter being, however, strongly disfavored by a recent analysis of SN1987A. In particular hierarchical mass schemes are excluded at the present level of accuracy.
Assuming the degenerate scenarios to be realized in nature we fix - according to the formulae derived in [11] - the common mass eigenvalue of the degenerate neutrinos to m = (0.05 - 3.4) eV. Part of the upper range is already excluded by tritium experiments, which give a limit of m 2.2 eV (95 c.l.) [34]. The full range can only partly (down to 0.5 eV) be checked by future tritium decay experiments, but could be checked by some future experiments (see, e.g. [10, 31]). The deduced best value for the mass is consistent with expectations from experimental branching limits in models assuming the generating mechanism for the neutrino mass to be also responsible for the recent indication for as anomalous magnetic moment of the muon [33]. It lies in a range of interest also for Z-burst models recently discussed as explanation for super-high energy cosmic ray events beyond the GKZ-cutoff [32].
The neutrino mass deduced allows neutrinos to still play an important role as hot dark matter in the Universe.
New approaches and considerably enlarged experiments (as discussed, e.g. in [31]) will be required in future to fix the neutrino mass with higher accuracy.
Acknowledgments
One of the authors - H.V. Klapdor-Kleingrothaus - would like to thank all colleagues who have contributed to the experiment over the last decade of operation. They are particularly grateful to Dr. F. Petry, Dr. B. Maier, Dr. J. Hellmig and Dr. B. Majorovits who have developed the pulse shape discrimination methods and set up the VME electronics applied in the experiment since 1995. They thank Dr. T. Kihm for his highly efficient permanent support in the field of electronics and Dr. G. Heusser for his important contribution in the field of low-level techniques. They thank Mr. H. Strecker for his invaluable technical contributions. They thank Prof. D. Schwalm for his scientific interest and his efficient support of this project and would like to thank the director of the Gran Sasso Underground Laboratory, Prof. E. Bettini and also the former directors of Gran Sasso Profs. P. Monacelli and E. Bellotti, for invaluable support. Our thanks extend also to the technical staff of the Max-Planck Institut für Kernphysik and of the Gran Sasso Underground Laboratory. We thank Perkin Elmer (former ORTEC) Company, and in particular Dr. M. Martini, and Dr. R. Collatz for the fruitful cooperation. We are grateful to Dr. G. Sawitzki and Prof. W. Beiglböck from the Institute for Applied Mathematics of the University of Heidelberg for encouraging discussions. We acknowledge the invaluable support from BMBF and DFG of this project. We are grateful to the former State Committee of Atomic Energy of the USSR for providing the enriched material used in this experiment.
References
- [1] A. Staudt, K. Muto and H.V. Klapdor-Kleingrothaus, Europh. Lett. 13 (1990) 31.
- [2] E. Majorana, Nuovo Cimento 14 (1937) 171 - 184.
- [3] G. Racah, Nuovo Cimento 14 (1937) 322 - 328.
- [4] W.H. Furry, Phys. Rev. 56 (1939) 1184 - 1193.
- [5] J. A. Mclennan, Jr. Phys. Rev. 106 (1957) 821,
- [6] K. M. Case, Phys. Rev. 107 (1957) 307,
- [7] D. V. Ahluwalia, Int. J. Mod. Phys. A 11 (1996) 1855.
- [8] M. Doi, T. Kotani and E. Takasugi, Prog. of Theor. Phys. Suppl. 83 (1985) 1 - 175.
- [9] K. Muto and H.V. Klapdor, in “Neutrinos”, Graduate Texts in Contemporary Physics”, ed. H.V. Klapdor, Berlin, Germany: Springer (1988) 183.
- [10] H.V. Klapdor-Kleingrothaus, “60 Years of Double Beta Decay - From Nuclear Physics to Beyond the Standard Model”, World Scientific, Singapore (2001) 1281 pp.
- [11] H.V. Klapdor-Kleingrothaus, H. Päs and A.Yu. Smirnov, Phys. Rev. D 63 (2001) 073005, and hep-ph/0103076.
- [12] P.Vogel in “Current Aspects of Neutrino Physics”, ed. D.O. Caldwell, Berlin, Heidelberg, Germany: Springer (2001) 177 - 198.
- [13] H.V. Klapdor-Kleingrothaus, in Proc. of Int. Symposium on Lepton and Baryon Number Violation, Trento, Italy, 20-25 April, 1998, ed. H.V. Klapdor-Kleingrothaus and I.V. Krivosheina, IOP, Bristol, (1999) 251-301 and Preprint: hep-ex/9901021
- [14] H.V. Klapdor-Kleingrothaus, Springer Tracts in Modern Physics, 163 (2000) 69-104, Springer-Verlag, Heidelberg, Germany (2000).
- [15] H.V. Klapdor-Kleingrothaus et al.,(HEIDELBERG-MOSCOW Collaboration), Eur. Phys. J. A 12 (2001) 147 and hep-ph/0103062.
- [16] M. Günther et al. (HEIDELBERG-MOSCOW Collaboration), Phys. Rev. D 55 (1997) 54.
- [17] G. Douysset et al., Phys. Rev. Lett. 86 (2001) 4259 - 4262.
- [18] J. Hellmig and H.V. Klapdor-Kleingrothaus, Nucl. Instrum. Meth. A 455 (2000) 638 - 644 and J. Hellmig, F. Petry and H.V. Klapdor-Kleingrothaus, Patent DE19721323A.
- [19] B. Majorovits and H.V. Klapdor-Kleingrothaus. Eur. Phys. J. A 6 (1999) (1999) 463.
- [20] B. Maier, Dissertation, November 1995, MPI-Heidelberg; F. Petry, Dissertation, November 1995, MPI-Heidelberg; J. Hellmig, Dissertation, November 1996, MPI-Heidelberg; B. Majorovits, Dissertation, December 2000, MPI-Heidelberg; A. Dietz, Dipl. Thesis, Univ. Heidelberg, 2000 (unpublished), and Dissertation, in preparation.
- [21] G. D’Agostini, hep-ex/0002055, W. von der Linden and V. Dose, Phys. Rev. E 59 6527 (1999), and F.H. Fröhner, JEFF Report 18 NEA OECD (2000) and Nucl. Sci. a. Engineering 126 (1997) 1.
- [22] H.L. Harney, Preprint: physics/0103030.
- [23] H.L. Harney, “Bayesian Inference. Data Evaluation and Decisions”, Monograph in preparation, Springer Verlag, Heidelberg 2002.
- [24] A. O’Hagan, “Bayesian Inference”, Vol. 2B of Kendall’s Advanced Theory of Statistics, Arnold, London (1994).
- [25] D.E Groom et al., Particle Data Group, Eur. Phys. J. C 15 (2000) 1.
- [26] J.G. Hykawy et al., Phys. Rev. Lett. 67 (1991) 1708.
- [27] R.B. Firestone and V.S. Shirley, Table of Isotopes, Eighth Edition, John Wiley and Sons, Incorp., N.Y. (1998).
- [28] R.N. Mohapatra and P.B. Pal, “Massive Neutrinos in Physics and Astrophysics”, Singapore, Singapore: World Scientific, World Scientific lecture notes in physics, 41 (1991) 318 pp.
- [29] T. Tomoda, Rept. Prog. Phys. 54 (1991) 53 - 126.
- [30] A. Faessler and F. Simkovic, J. Phys. G 24 (1998) 2139 - 2178 and Preprint hep-ph/9901215 (1999) 1 - 32.
- [31] H.V. Klapdor-Kleingrothaus, hep-ph/0103074 and in Proc. of 2nd Workshop on Neutrino Oscillations and Their Origin (NOON 2000), Tokyo, Japan, 6-18 Dec. 2000, ed: Y. Suzuki et al., World Scientific (2001), Nucl. Phys. Proc. Suppl. 100 (2001) 309 - 313 (hep-ph/0102276), Part. Nucl. Lett. 104 (2001) 20 - 39 (hep-ph/0102319).
- [32] T.J. Weiler, in Proc. Beyond the Desert 1999, Accelerator, Non-Accelerator and Space Approaches, Ringberg Castle, Tegernsee, Germany, 6-12 Juni 1999, edited by H.V. Klapdor–Kleingrothaus and I.V. Krivosheina, IOP Bristol, (2000) 1085 - 1106; H. Päs and T.J. Weiler, Phys. Rev. D 63 (2001) 113015 and hep-ph/0101091.
- [33] E. Ma and M. Raidal, Phys. Rev. Lett. 87 (2001) 011802; Erratum-ibid. 87 (2001) 159901 and hep-ph/0102255.
- [34] C. Weinheimer, in Proc. of 3rd International Conference on Dark Matter in Astro and Particle Physics (Dark 2000), Heidelberg, Germany, 10-16 July, 2000, ed. H.V. Klapdor-Kleingrothaus, Springer, Heidelberg (2001) 513 - 519.