Determination of the longitudinal structure function at HERA
Abstract
Recent results from the HERA experiment H1 on the longitudinal stucture function of the proton are presented. They include proton structure function analyses with particular emphasis on those kinematic regions which are sensitive to . All results can be consistently described within the framework of perturbative QCD.
1 Introduction
Deep inelastic lepton nucleon scattering (DIS) experiments have played a key role in the understanding of hadronic matter. They have revealed the structure of hadrons being made out of constituents and the interaction between the latter.
In fixed target DIS experiments scaling violations have been observed, i.e. the variation at fixed values of Bjorken- of the structure functions with , the squared four-momentum transfer between lepton and nucleon. These scaling violations are well described by perturbative Quantum Chromodynamics (pQCD). The evolution of the proton structure function is related to the gluon momentum distribution in the proton, , and the strong interaction coupling constant, . Both, and , can be determined with precision DIS cross section data.
HERA offers the possibility to study the structure of the proton over a wide kinematic range of and , several orders of magnitude larger than in the earlier fixed target experiments. Already first measurements of at HERA, for and 20 GeV2, revealed a steep rise of towards low for fixed [1, 2]. Later measurements of by H1[3, 4, 5] and ZEUS[6, 7] in a wide kinematic range, for values from to 30000 GeV2 and for , have confirmed this trend. The strong scaling violations observed at low are attributed to the high gluon density in the proton. The validity of the DGLAP evolution equation [8], which neglects higher-order terms [9, 10] proportional to , is questionable in the low range and therefore has to be tested against the data. At sufficiently low , non-linear gluon interaction effects have been considered in order to damp the rise of the cross section in accordance with unitarity requirements [11].
The measurement of the longitudinal structure function is of great theoretical importance, since it may allow distinguishing between different models describing the QCD evolution at low . In fact, the structure function measurements at HERA remain incomplete until the longitudinal structure function is actually measured. The direct, classical measurement by substantial variation of the beam energies[12] is yet to come at HERA. However, while waiting for this to happen in the HERA II period, the H1 collaboration have extracted experimental results on by measuring the cross section in a kinematic region where the contribution is substantial (the high region, see below) and comparing these measurements with the extrapolation of the measurements. These results are described in this report.
2 Neutral current cross section and the proton structure functions
The cross section of the inclusive electron-proton DIS neutral current process (Figure 1), , depends on the three independent variables and and , the center of mass energy squared.

and are defined in terms of the four momenta of the incident and the scattered electron, and , and of the incident proton, as
| (1) |
Another important variable is the inelasticity
| (2) |
which is related to , and by 777 Here and in the following formulae the proton and electron masses are neglected..
In the one-photon exchange approximation ( exchange neglected: ) the cross section of the process can be expressed as
| (3) |
Here denotes the leptonic tensor, describing the interaction between the electron and the virtual photon. In QED the lepton-photon vertex is well defined and therefore can be calculated exactly. The hadronic tensor corresponds to the photon-proton interaction and is not calculable. However, using Lorenz invariance and current conservation the hadronic tensor can be reduced to only two functions related to the structure of the proton. The double differential DIS cross section can then be written as
| (4) |
One can consider the scattering process as the interaction of a flux of virtual photons [13] with the proton. The DIS cross section can then be written as
| (5) |
where stands for the flux factor, defines the photon polarization and correspond to the cross sections of the interaction of transverse and longitudinally polarized photons, respectively. These cross sections are related to the structure functions as
| (6) |
The longitudinal structure function is directly proportional to . Due to the positivity of the cross sections, the two structure functions and obey the relation
| (7) |
The “reduced” cross section is defined as
| (8) |
Since the contribution of the longitudinal structure function to the cross section can be sizeable only at large values of , in a large kinematic range the relation holds to a very good approximation.
In the Quark Parton Model (QPM) [14] the structure function can be expressed as a sum of the quark-antiquark momentum distributions weighted with the square of the quark electric charges
| (9) |
For spin 1/2 partons QPM also predicts , which leads to the so-called Callan-Gross relation [15]: .
The naive QPM has to be modified in QCD as quarks interact through gluons, and can radiate gluons. Radiated gluons in turn can split into quark-antiquark pairs (“sea quarks”) or gluons. The gluon radiation results in a transverse momentum component of the quarks. Consequently, quarks can also couple to longitudinally polarized photons and the Callan-Gross relation is no longer satisfied exactly. Thus, in QCD the longitudinal structure function is non-zero. Due to its origin, is directly dependent on the gluon distribution in the proton and therefore the measurement of provides a sensitive test of perturbative QCD.
3 Experimental procedure
3.1 Kinematic reconstruction
At HERA 27.5 GeV positrons collided with 820 GeV protons. For the last two years the proton beam energy was increased to 920 GeV, and consequently the center of mass energy from 300 to 319 GeV.
The kinematic variables (or ) and can be reconstructed either from the energy and the polar angle of the scattered positron, or from the energy and the polar angle of the hadronic final state, or using a combination of these energies and polar angles. The overconstrained kinematics allows cross checks, as well as the choice of the method with the best experimental precision for a given kinematic range.
In the “electron method” the event kinematics is reconstructed using the energy and the polar angle of the scattered positron
| (10) |
While the electron method is accurate at large values of , corresponding to low energies , the resolution rapidly degrades for where approaches the positron beam energy . The kinematic variables at low are reconstructed using also information from the hadronic final state. The inelasticity can also be determined as [16]
| (11) |
where and are energy and longitudinal momentum components of the particle in the hadronic final state. In the “ method” [17] and are reconstructed as
| (12) |
The method has good resolution also at low , and is insensitive to the initial state radiation. The cross section is extracted using a combination of the electron method and the method.
3.2 H1 detector
The H1 detector [18] combines tracking in a solenoidal magnetic field of 1.15 T with nearly hermetic calorimetry to investigate high energy interactions at HERA. For polar angles the scattered positron energy is measured in the backward electromagnetic lead-fibre scintillator calorimeter (SPACAL) [19] which has an integrated timing function to veto proton beam induced background interactions. Here is defined with respect to the proton beam direction. Identification of the scattered positron is improved and the polar angle measured with a backward drift chamber (BDC), situated in front of the SPACAL, and with the new backward silicon detector (BST) [20]. The BST consists of four detector planes, arranged perpendicular to the beam axis and equipped with 16 wedge shaped, double metal silicon strip detectors. The BST measures the polar angle of the crossing tracks with an internal resolution of about 0.2 mrad for between 172o and 177o. For polar angle the scatterd positron is measured in the LAr calorimeter.
The hadronic final state is reconstructed using the Liquid Argon (LAr) calorimeter, tracking detectors and the SPACAL. The interaction vertex is determined with the central drift chambers, the jet chamber CJC and two layers of drift chambers, mostly using the hadronic final state particles. This vertex determination is complemented by the inner proportional chamber CIP , for , and by BST, for .
The luminosity is determined with a precision of 1.5% using the small-angle bremsstrahlung process [21]. The final state photon and positron, scattered at very low , can be detected in calorimeters (“photon and electron taggers”) which are situated close to the beam pipe at distances of 103 m and 33 m from the interaction point in the positron beam direction.
3.3 Event selection and simulation
The event selection criteria are slightly different in the low and in the high ranges. In the low range the scattered positron is identified in the SPACAL. In the high range the positron is seen in the LAr calorimeter as that cluster of maximum transverse energy, for which the requirements on the cluster shape are satisfied. The difference is then mainly in the cluster definition and in the track validation. In the LAr cluster-track validation we use CJC tracks for , in the SPACAL cluster case we use CJC, BDC and BST tracks, where appropriate.
Longitudinal momentum conservation in neutral current DIS events gives the constraint that , summed over the final state particles, is about equal to . In events with initial state radiation the radiative photon may carry a significant fraction of the sum. Such events are thus suppressed by requiring 35 GeV.
Distributions of the selected events were compared with simulations of deep inelastic scattering, photoproduction and Compton scattering. The simulated Monte Carlo events were submitted to the same reconstruction and analysis chain as the real data. The track detection efficiencies were determined from the data utilizing the redundancy of the central and backward tracking detector system. Agreement at the few per cent level was reached between experiment and simulation for the large set of technical and physics distributions studied.
4 The longitudinal structure function
4.1 Photoproduction background estimate
For the measurement of the longitudinal structure function it is essential to reach the highest possible values of . This requires the identification of scattered positrons with energies down to only a few GeV as well as the efficient rejection of photoproduction background events in which low energy deposits in the SPACAL can mimic the signature of a deep inelastically scattered positron.
The main part of the background is due to photons from decays. In the low region a sizeable fraction of this background can be removed by requiring a track signal in the BST. The remaining background is due to photon conversion and showering in the passive material in front of the detectors, possible overlap of decays with charged tracks, and misidentified charged pions. It is subtracted bin by bin using the PHOJET [22] MC simulation. The photoproduction background can be estimated experimentally using tagged events in which the scattered positron is detected in the electron tagger.
At above 10 GeV2, for the photoproduction background is subtracted using the PHOJET simulation. For values above 0.75 experimental information is used by employing the charge assignment of central tracks associated with SPACAL energy clusters. This allows the energy range to be extended down to 3 GeV, corresponding to . The candidates with negative charge are taken to represent the background in the positron data sample. This statistical subtraction procedure requires the study of any process which may cause a charge asymmetry. Suchs asymmetry is e.g. due to the antiproton interaction cross section exceeding that for proton interactions at low energies [23]. Annihilation leads to larger energy deposits in SPACAL than proton interactions which introduces an asymmetry for low energies above a given threshold. This charge asymmetry can be measured using tagged photoproduction events which fulfill the DIS event selection criteria and is taken into account in the measurement of the positron DIS cross section at high .
As already stressed above, the detailed understanding of the data down to 3 GeV scattered positron energy is essential for the measurement of the DIS cross sections at high , enabling the determination of . Control plots illustrating the cross section measurements at high are shown in Figures 2 and 3.
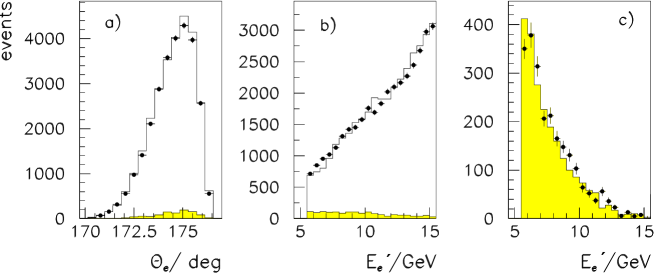
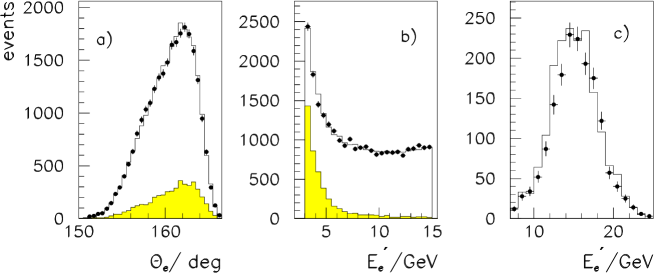
4.2 Cross section at large
The cross section is determined by converting the measured number of events, after background subtraction, in bin averaged cross sections using acceptance calculations from the Monte Carlo sample. The precision for this measurement is dominated by systematic uncertainties of typically 3%, extending to about 7% at the edges of the covered range.
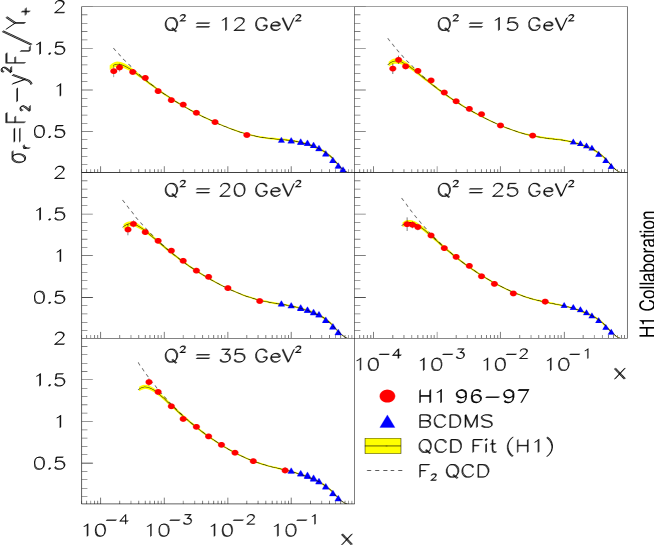
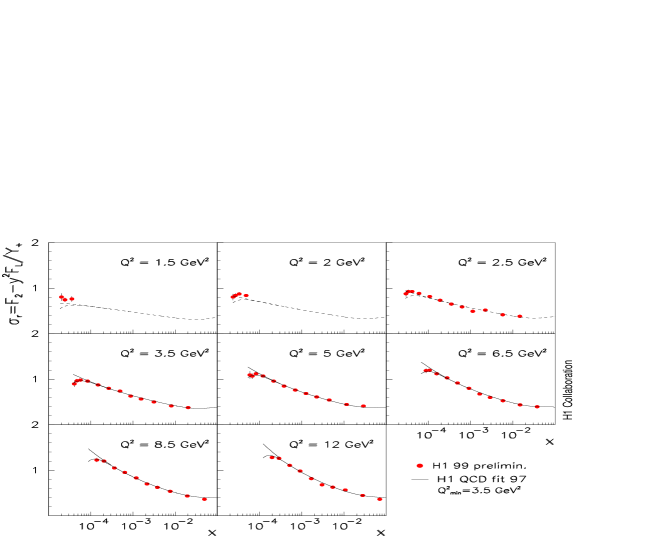
The measured reduced cross section is shown in Figures 4 and 5 for two data samples, taken in 1996/97 and 1999 with 820 GeV and 920 GeV proton beam energy, respectively. The cross section rises towards low , turning over at values corresponding to 0.6. This behaviour, for 3.5 GeV2, is well described by the NLO QCD fit [25] to the 820 GeV data. Note that this fit used H1 data with a minimum = 3.5 GeV2. The extrapolation of the fit to values lower than 2.5 GeV2 falls below the measured data.
4.3 Determination of
The extraction of the longitudinal structure function is based on the reduced cross section (8), which depends on and . The effect of is enhanced with , and the reduced cross section tends to as . For the extraction of the longitudinal structure function from the inclusive cross section the data at large are very important. An important advantage of HERA, compared to fixed target DIS lepton-nucleon experiments, is the wide range of values covered. This allows the behaviour of at low to be determined reliably and to be extrapolated into the region of high .
Two methods are used by H1 to perform the extraction of the longitudinal structure function:
For 10 GeV2 the “extrapolation method”, introduced in [25], is used. A NLO DGLAP QCD fit is used to extrapolate into the high region. This fit uses only H1 data in the restricted kinematic range and GeV2. In Figure 4 the fit is compared with the measured cross section for bins above 10 GeV2, accessing the high region. The difference between the measured and the extrapolated is used to determined . Systematic errors, which are common to the lower and the larger region, are considered in the fit as described in [26].
At low 10 GeV2, the behaviour of as a function of is used in a new extraction method [5]. This so called “ derivative method” is based on the cross section derivative .
The derivative of the reduced cross section, taken at fixed , is given by
| (13) |
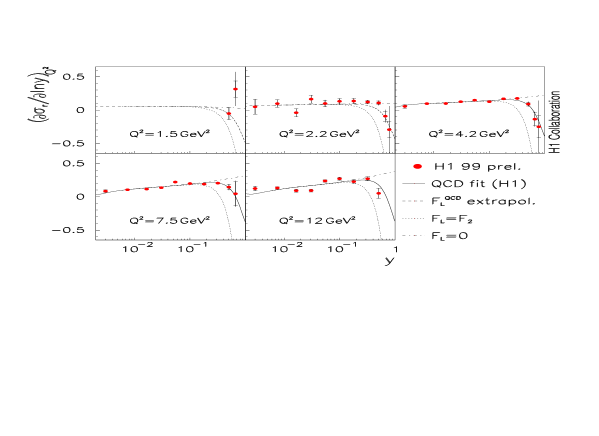
For the cross section derivative tends to the limit , neglecting the contribution from the derivative of . At largest the contribution dominates the derivative of the reduced cross section . This is in contrast to the influence of on which is dominated by the contribution of for all . A further advantage of the derivative method is that it can be applied down to very low 1 GeV2 where a QCD description of is complicated due to higher order and possible non-perturbative corrections. The cross section derivatives are shown in Figure 6 as function of . This measurement of was used to determine the longitudinal structure function. The assumption has been made that the derivative is a linear function of up to large . In each bin straight line fits were made to the derivative data for 0.3. The line fits describe the data very well and the extrapolation of the straight line was taken to represent the contribution of at high . The extrapolations were compared with the values obtained from QCD and good agreement was found. The uncertainties of the straight line extrapolation were included into the systematic errors of the measurement. The small contribution of to the derivative was corrected for by using NLO QCD and the size of the full correction was added to the overall error of the measured .
4.4 Results
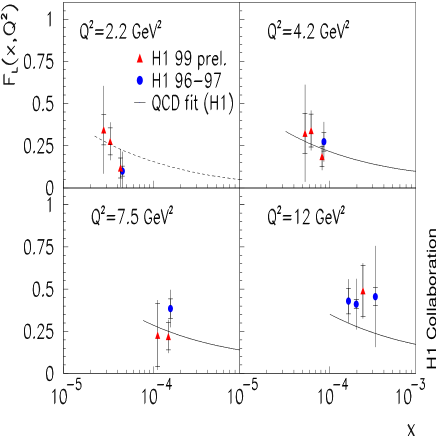
The longitudinal structure function determined by the derivative method is shown in Figure 7. The data extend into the lower range and are consistent with previous H1 results. The curves represent NLO QCD calculations of based on a fit to the 1996/97 data for 0.35, i.e. in a region where can be measured practically independently of .
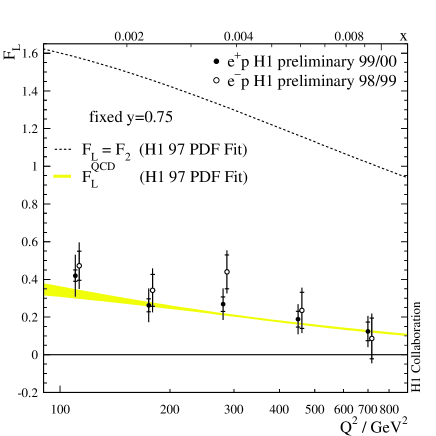
In Figure 8 the determination of at high is shown for and data sets. The extrapolation method is used. Both data sets are consistent and in agreement with the QCD fit. The possible extreme values for ( and ) are shown for comparison.
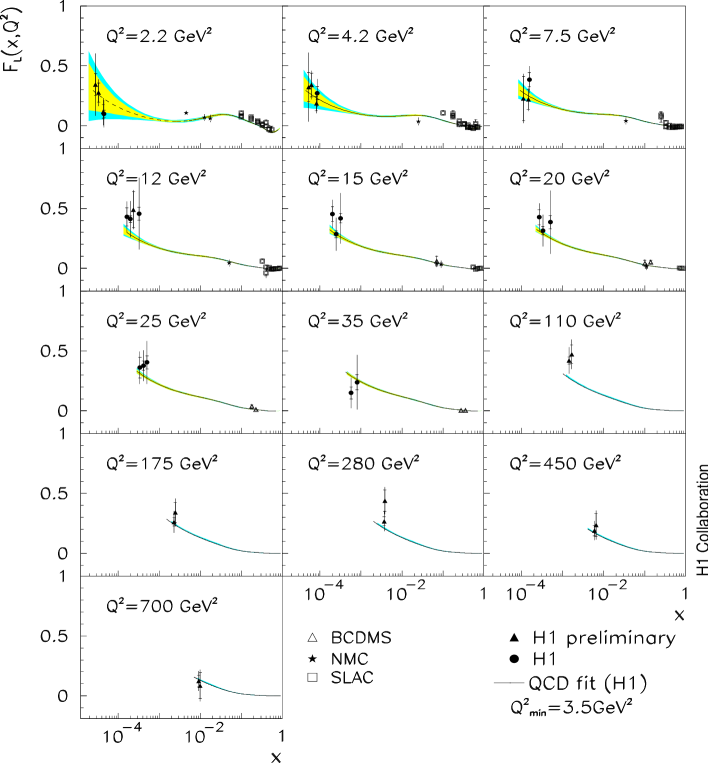
An overview of all current H1 data on , from = 2.2 GeV2 to 700 GeV2 is given in Figure 9. The data extend the knowledge of the longitudinal structure function into the region of low , much beyond the region of fixed target lepton-proton scattering experiments. The increase of towards low is consistent with the NLO QCD calculation, reflecting the rise of the gluon momentum distribution in this region. The values of are thus severely constrained by the present data, unless there are deviations from the assumed extrapolation of into the region of large corresponding to the smallest . A measurement of the dependence of , independent of assumptions about the behaviour of , can be performed with a variation of the proton beam energy at HERA [12].
A NLO QCD fit has also been performed by the ZEUS collaboration [27]. Within this fit was calculated, and found to be consistent with the H1 data.
Several theoretical models were compared to the H1 data. Predictions based on the saturation model [28] are shown in Figure 10 together with the H1 data points. At large and values data are well described by the model, while at low and low higher twist contributions are clearly needed to describe the distribution.

In Figure 11 the H1 data are compared to the Donnachie-Dosch model [29] predictions. This model is based on a dipole picture in which large dipoles couple to a soft pomeron and small dipoles couple to a hard pomeron. The parameters are fixed by proton-proton scattering data and by the measured proton structure function . This simple approach is able to describe the data well. One can see that with increasing the importance of the hard pomeron is increasing, and it is dominating at the high values.

5 Summary
New results on the extraction of the longitudinal structure function are presented for a wide range from 2.2 GeV2 to 700 GeV2 and for much lower values (), compared to the fixed target experiments. The extraction results are possible due to the improved detectors in the H1 backward region, used for the identification and measurement of the scattered positrons at low and high .
Two different methods are used to determine . The partial derivative of the reduced cross section, , is used to extract at low 10 GeV2. At 10 GeV2 the difference between the measured reduced cross section and , calculated from an extrapolation of a NLO QCD fit to low data, is used for the determination. Thus the longitudinal structure function at low is determined more precisely than hitherto and in a larger range.
The observed rise of towards low is consistent with the NLO QCD calculations and reflects the rise of the gluon momentum distributions in this kinematical region.
The data are also well described by calculations based on a colour dipole model and on a combination of the colour dipole with a two pomeron model.
Acknowledgments
I would like to thank the organizers for the excellent organization and for creating an inspiring conference atmosphere. The results presented here are due to the common efforts and the success of the HERA machine group and of the H1 Collaboration and it is a pleasure for me to thank all their members. Special thanks to J. Dainton, D. Eckstein, J. Gayler, M. Klein, K. Long, J. Olsson, and P. Schleper for useful discussions, comments and help in preparing the talk.
References
References
- [1] H1 Collaboration, I. Abt et al., Nucl. Phys.B407, 515 (1993)
- [2] ZEUS Collaboration, M. Derrick et al., Phys. Lett.B316, 412 (1993)
- [3] H1 Collaboration, S. Aid et al., Nucl. Phys.B470, 3 (1996)
- [4] H1 Collaboration, C. Adloff et al., Eur.Phys.J. C13, 609 (2000)
- [5] H1 Collaboration, C. Adloff et al., Eur.Phys.J. C21, 33 (2001)
- [6] ZEUS Collaboration, M. Derrick et al., Z.Phys. C72, 399 (1996)
- [7] ZEUS Collaboration, S. Chekanov et al., Eur.Phys.J. C21, 443 (2001)
-
[8]
L.V. Gribov, L.N. Lipatov, Sov. J. Nucl. Phys. 15,
438 and 675 (1972);
Yu.L. Dokshitzer, Sov. Phys. JETP 46, 641 (1977);
G. Altarelli, G. Parisi, Nucl. Phys.B126, 298 (1977) -
[9]
E.A. Kuraev, L.N. Lipatov, V.S. Fadin, Sov. Phys. JETP
44, 443 (1976);
ibid. 45, 199 (1977);
Y.Y. Balitsky, L.N. Lipatov, Sov. Journ. Nucl. Phys. 28, 822 (1978) -
[10]
M. Ciafaloni, Nucl. Phys.B296, 49 (1988);
S. Catani, F. Fiorani, G. Marchesini, Nucl. Phys.B336, 18 (1990);
G. Marchesini, Nucl. Phys.B445, 49 (1995) - [11] L.V. Gribov, E.M. Levin, M.G. Ryskin, Phys. Rep. 100, 1 (1983)
- [12] L. Bauerdick, A. Glazov, M. Klein, Future Measurement of the Longitudinal Proton Structure Function at HERA, Proc. Workshop on Future Physics at HERA, eds. G. Ingelmann, A. De Roeck, R. Klanner, Hamburg, DESY (1996), p.77; hep-ex/9609017 (1996)
-
[13]
L.N. Hand, Phys. Lett.B129, 1834 (1963);
S.D. Drell and J.D. Walecka, Ann. Phys., NY28, 18 (1964);
F.J. Gilman, Phys. Rev.4, 95 (1972) - [14] J.D. Bjorken, Phys. Rev.179, 1547 (1969)
- [15] C.G. Callan, D.J. Gross, Phys. Rev. Lett.22, 156 (1969)
- [16] A. Blondel, F. Jacquet, Proc. ep Facility for Europe, Amsterdam 1979, DESY 79/48, 391 (1979)
- [17] U. Bassler, G. Bernardi, Nucl. Instrum. MethodsA361, 197 (1995)
- [18] H1 Collaboration, I. Abt et al., Nucl. Instrum. MethodsA386, 310 (1997) and A386, 348 (1997)
- [19] R.D. Appuhn et al., Nucl. Instrum. MethodsA386, 397 (1997)
- [20] W. Eick et al., Nucl. Instrum. MethodsA386, 81 (1997)
- [21] H1 Collaboration, I. Abt et al., Z. Phys.C66, 529 (1995)
- [22] R. Engel, J. Ranft, Phys. Rev.D54, 4244 (1996)
- [23] Particle Data Group Report, D.E. Groom et al., Eur.Phys.J. C15, 1 (2000)
- [24] H1 Collaboration, Paper no. 799 submitted to the International Europhysics Conference on High Energy Physics, EPS2001, July, 2001, Budapest
- [25] H1 Collaboration, S. Aid et al., Phys. Lett.B393, 452 (1997)
- [26] C. Pascaud, F. Zomer, LAL preprint, LAL/95-05 (1995)
- [27] K.Nagano, see these proceedings; ZEUS Collaboration, Paper no. 628 submitted to the International Europhysics Conference on High Energy Physics, EPS2001, July, 2001, Budapest
-
[28]
J. Bartels, K. Golec-Biernat, K. Peters, Eur.Phys.J.
C17, 121 (2000);
K. Golec-Biernat, M. Wüsthoff, Phys. Rev.D59, 014017 (1999) - [29] A. Donnachi, H.G. Dosch, hep-ph/0106169 (2001)