Resonance Production at STAR
Abstract
We present the first measurement of mid-rapidity vector meson production in collisions at RHIC ( GeV) from the STAR detector. For the 11% most central collisions, the slope parameter from an exponential fit to the transverse mass distribution is 37951(stat) 45(syst) MeV, the yield 5.730.37(stat) 0.57(syst) per event and the ratio is found to be 0.0210.001(stat) 0.004(syst). We currently place the value of the ratio between 0.10 and 0.16. The measured ratios and , as well as for the meson at mid-rapidity do not change for the selected centrality bins.
1 Introduction
The central topic of relativistic heavy ion physics is the study of Quantum Chromodynamics (QCD) in extreme conditions of high temperature and high energy density over large volumes [1]. Vector mesons may probe the dynamics of particles and chiral symmetry [2] in relativistic heavy ion collisions: their production mechanisms and subsequent dynamical evolution have been a topic of experimental investigation [3, 4, 5, 6]. The meson is of particular interest due to its valence quark content, which may make the sensitive to strangeness production from a possible early partonic phase [7, 8, 9].
In central collisions at the CERN SPS (nucleon-nucleon center of mass energy GeV), the slope parameter () in an exponential fit to the transverse mass () distribution at mid-rapidity () follows a systematic trend as a function of hadron mass for pions, kaons and protons [11]. This observation is indicative of a common expansion velocity developed in the final state for pions, kaons, and protons [12]. The slope parameters, however, measured for multi-strange hyperons and [13], and for J/ [14] show deviations from a linear mass dependence, suggesting that these particles do not interact as strongly in the final state at SPS energies [15]. Measurements of meson production at the SPS were inconclusive [3, 4]. Significantly different values for the slope parameter have been obtained from exponential fits to the measured spectra in central collisions when using the decay channel [3] and when using the decay channel [4] of the meson. This difference, however, is not apparent in peripheral collisions [16, 17]. Possible scenarios to explain the difference have been discussed in the literature [18, 19].
We report the first measurement of mid-rapidity () production in collisions at RHIC ( GeV) via the decay channel (branching ratio ) using the Solenoidal Tracker At RHIC (STAR) detector [20]. Systematics of meson production as a function of centrality at RHIC as well as its dependence will be discussed.
2 Analysis
The STAR detector consists of several detector sub-systems in a large solenoidal analyzing magnet. For the data taken in the year 2000 and presented here, the experimental setup consisted of a Time Projection Chamber (TPC), a Central Trigger Barrel (CTB), and two Zero Degree Calorimeters (ZDC) located upstream along the beam axis. The TPC is a cylindrical drift chamber with multi-wire proportional chamber readout. With its axis aligned along the beam direction, the TPC provided complete azimuthal coverage. Surrounding the TPC was the CTB, which measured energy deposition from charged particles. The ZDC’s measured beam-like neutrons from the fragmentation of colliding nuclei. The CTB was used in conjunction with the ZDC’s as the experimental trigger.
Data used in this analysis were taken with two different trigger conditions: a minimum-bias trigger requiring a coincidence between both ZDC’s and a central trigger additionally requiring a high hit multiplicity in the CTB. The central trigger corresponded to approximately the top 15% of the measured cross section for collisions. Data from both the minimum-bias trigger and central trigger were used for this analysis.
Reconstruction of the was accomplished by calculating the invariant mass (), transverse momentum (), and rapidity () of all permutations of candidate pairs. The resulting distribution consisted of the signal as well as combinatorial background. The shape of the combinatorial background was calculated using the mixed-event technique [22, 23].
For the centrality measurement, the raw total charged multiplicity distribution within a pseudo-rapidity window 0.75 was divided into three bins corresponding to 85–26%, 26–11% and the top 11% of the measured cross section for collisions [24, 25, 26]. Events were selected with a primary vertex z position () from the center of the TPC of cm. These events were further divided according to in 16 bins, and event mixing was performed for events within each bin to construct background distributions with reduced acceptance-induced distortions in the mixed-event background. Consistent results were obtained when we constructed the background distribution using like-sign pairs from the same event.
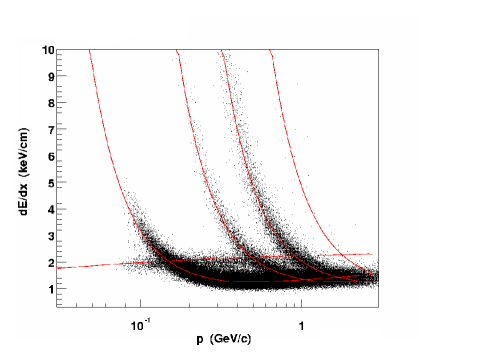
Particle identification (PID) was achieved by correlating the ionization energy loss () of charged particles in the TPC gas with their measured momentum (left panel of Figure 1). By truncating the largest 30% values along the track, a sample was selected to calculate the mean . For the most central events, the average resolution was found to be about 11%. The measured is reasonably described by the Bethe-Bloch function smeared with a resolution of width . Tracks within of the kaon Bethe-Bloch curve were selected for this analysis.
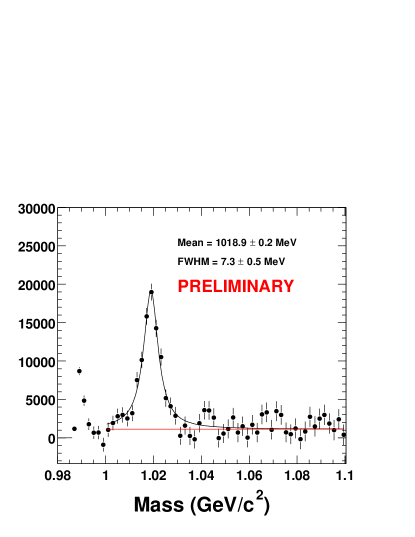
To obtain the spectra, same event and mixed event distributions were accumulated and background subtraction was done in each bin. The mixed event background distribution was normalized to the same event distribution in the region above the mass (). The raw yield in each bin was then determined by fitting the background subtracted distribution to a Breit-Wigner function plus a linear background in a limited mass range (left panel of Figure 2). A slight mismatch between the same-event and mixed-event background distributions, due to Coulomb interactions, track merging and other residual correlations leads to a structure in the subtracted mass distribution [27]. The width of the fit to the invariant mass distribution is consistent with the natural width of the convoluted with the resolution of the TPC.
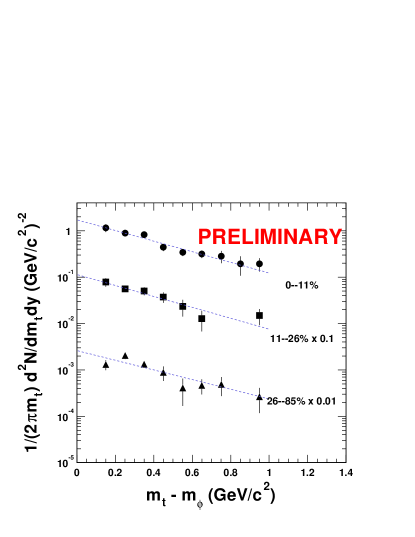
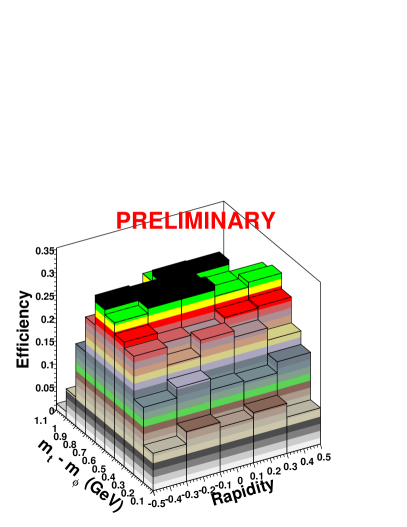
The resulting raw yield for each , and centrality bin was then corrected for tracking efficiency and acceptance using Monte Carlo simulations of physics processes and detector response. The reconstruction efficiency depended on the of the , ranging from % at GeV/c up to % at GeV/c (right panel of Figure 1). The PID efficiency correction for the was calculated as the square of the single kaon PID efficiency and included the centrality dependence of the resolution. The corrected invariant yields for three centrality bins are shown in the right panel of Figure 2. All results presented here are for reconstructed mesons within one unit of rapidity centered around () and GeV/c. In the region where the pion band crosses the kaon band in [26], corresponding to the kaon , the signal to background ratio degrades. This leads to the larger statistical error bars in the most central bin and prevented the extraction of the yields in this region for the two lower centrality bins. The spectra were fit to an exponential
| (1) |
with the slope parameter and yield set as free parameters. The results obtained are listed in Table 1. The fraction of mesons in the measured region assuming an exponential distribution is . Also listed is the midrapidity ratio of the yield to the negative hadron () yield [28] for three multiplicity bins.
The major systematic uncertainties for this analysis include contributions from PID efficiency and tracking efficiency. By varying PID and track quality requirements, we estimate a systematic uncertainty of 12% for and 10% for . Systematic errors for the ratio also includes the uncertainty in the yield. The full range of the systematic uncertainty for is .
| Event Centrality | 0–11% | 11–26% | 26–85% |
|---|---|---|---|
| (MeV) | 37951 | 36973 | 41776 |
| 5.730.37 | 3.330.38 | 0.980.12 | |
| 0.0210.001 | 0.0190.002 | 0.0190.002 | |
| 0.10 to 0.16 | |||
| All numbers are preliminary | |||
3 Results
For the most central heavy ion collisions, there is an increase in from the AGS [6] to SPS [3] to RHIC. The slope parameters, however, from collisions show no significant dependence on collision energy up to GeV [3, 29].
Since the and anti-proton have similar masses and very different scattering cross sections [8], comparison of the spectral shapes would shed light on collision dynamics. In the most central collisions at RHIC, the slope parameter is 37951(stat) 45(syst) and there is no dependence on event centrality (Table 1) within our statistical uncertainty. The anti-proton slope parameter using the same fit function, however, measured in the range GeV/c and without correction for feed-down from anti-hyperons, is found to be over 150 MeV higher than the meson slope measured in GeV/c [30]. Note that if a strong collective flow develops in the system, the measured slope parameter should depend strongly on the fitting range. Measurements of the and anti-proton over a much broader range of will yield a more definitive conclusion on the dynamics of these particles.
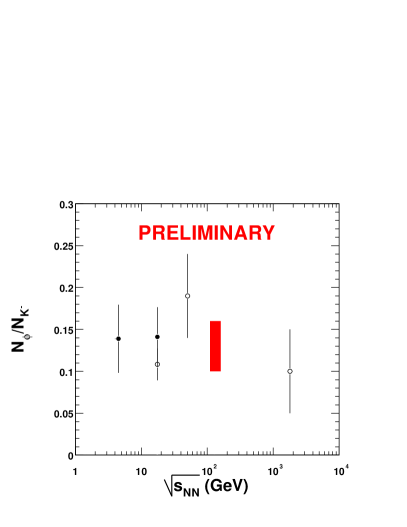
The energy dependence of the mid-rapidity ratio is shown in the left panel of Figure 3. The shaded region corresponds to our best estimate of the ratio in GeV collisions at RHIC. The ratio has no measurable dependence on collision energy and system size over three orders of magnitude from collisions at the AGS [6] to collisions at the Tevatron [31].
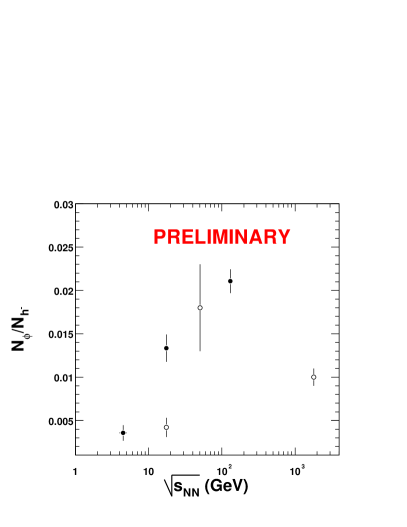
The energy dependence of the mid-rapidity ratio is shown in the right panel of Figure 3. In heavy ion collisions, increases with collision energy indicating that production increases faster than production up to GeV. Although there seems to be a significant increase in ratio from collisions between 17 and 63 GeV [3, 29], the statistical uncertainty in the 63 GeV point is too large to determine the energy dependence. Note that the ratio at Tevatron energies ( at GeV) was found to be about 0.01 [31].
4 Conclusion
In summary, using the STAR detector we have measured mid-rapidity production from collisions at GeV. In the most central collisions, the slope parameter, 37951(stat) 45(syst) MeV, is lower than that of anti-protons in the measured region. Within statistical uncertainty, there is no variation in slope parameters and the ratio for the selected centrality bins. There is no measurable dependence of the on collision energy and system size spanning three orders of magnitude. The slope parameter and the ratio increase from to 130 GeV.
References
- [1] F. Wilczek, Physics Today, 53, Aug. 2000, pg. 22.
- [2] T. Hatsuda and T. Kunihiro, Phys. Rep. 247, 221 (1994).
- [3] S.V. Afanasiev et al., NA49 Collaboration, Phys. Lett. B491, 59 (2000).
- [4] N. Willis et al., NA50 Collaboration, Nucl. Phys. A661, 534c (1999).
- [5] Y. Akiba et al., E802 Collaboration, Phys. Rev. Lett. 76, 2021 (1996).
- [6] R.K. Seto and H. Xiang, E917 Collaboration, Nucl. Phys. A661, 506c (1999).
- [7] J. Rafelski and B. Müller, Phys. Rev. Lett. 48, 1066 (1982).
- [8] A. Shor, Phys. Rev. Lett. 54, 1122 (1985).
- [9] P. Koch, B. Müller and J. Rafelski, Phys. Rep. 142, 167 (1986).
- [10] S.A. Bass et al., Nucl. Phys. A661, 205 (1999).
- [11] I. Bearden et al., NA44 Collaboration, Phys. Rev. Lett. 78, 2080 (1997).
- [12] U. Heinz, Nucl. Phys. A610, 264c (1996).
- [13] E. Andersen et al., WA97 Collaboration, Phys. Lett. B433, 209 (1998).
- [14] M.C. Abreu et al., NA50 Collaboration, Phys. Lett. B499, 85 (2001).
- [15] H. van Hecke, H. Sorge and N. Xu, Phys. Rev. Lett. 81, 5764 (1998).
- [16] V. Friese et al., NA49 Collaboration, Quark Matter, (2001).
- [17] C. Quintans et al., NA50 Collaboration, J. Phys. G.: Nucl. Part. Phys. 27, 405c (2001).
- [18] S. Johnson, B. Jacak and A. Drees, Eur. Phys. J. C18, 645–649 (2001).
- [19] S. Soff et al., J. Phys. G.: Nucl. Part. Phys. 27, 449c (2001).
- [20] K.H. Ackermann et al., STAR Collaboration, Nucl. Phys. A661, 681c (1999).
- [21] H. Wieman et al., IEEE Trans. Nucl. Sci. 44, 671 (1997).
- [22] D. L’Hote, Nucl. Instrum. Meth. A337, 544 (1994).
- [23] D. Drijard, H. G. Fischer and T. Nakada, Nucl. Instrum. Meth. A225, 367 (1984).
- [24] K.H. Ackermann et al., STAR Collaboration, Phys. Rev. Lett. 86, 402 (2001).
- [25] The measured cross-section is approximately 90% of the total inelastic Au+Au cross-section. Our centrality bins correspond to approximately 77–23%, 23–10% and top 10% of the inelastic Au+Au cross-section.
- [26] J. Harris et al., STAR Collaboration, Quark Matter, (2001).
- [27] E. Yamamoto, Ph.D. Thesis, University of California - Los Angeles, (2001).
- [28] C. Adler et al., Phys. Rev. Lett. 87, 112303 (2001).
- [29] T. Åkesson et al., AFS Collaboration, Nucl. Phys. B203, 27 (1982).
- [30] C. Adler et al., STAR Collaboration, Submitted to Phys. Rev. Lett. September 2001.
- [31] T. Alexopoulos et al., E735 Collaboration, Phys. Rev. D48, 984 (1993) and T. Alexopoulos et al., E735 Collaboration, Z. Phys. C67, 411 (1995).