Measurement of the Total Cross Section and Differential Cross Section in Collisions at TeV
pacs:
13.85.Ni, 12.38.Qk, 13.25.Hw, 14.40.NdD. Acosta,13 T. Affolder,24 H. Akimoto,46 M. G. Albrow,12 P. Amaral,9 D. Ambrose,33 D. Amidei,26 K. Anikeev,25 J. Antos,1 G. Apollinari,12 T. Arisawa,46 A. Artikov,10 T. Asakawa,44 W. Ashmanskas,9 F. Azfar,31 P. Azzi-Bacchetta,32 N. Bacchetta,32 H. Bachacou,24 S. Bailey,17 P. de Barbaro,37 A. Barbaro-Galtieri,24 V. E. Barnes,36 B. A. Barnett,20 S. Baroiant,5 M. Barone,14 G. Bauer,25 F. Bedeschi,34 S. Belforte,43 W. H. Bell,16 G. Bellettini,34 J. Bellinger,47 D. Benjamin,11 J. Bensinger,4 A. Beretvas,12 J. P. Berge,12 J. Berryhill,9 A. Bhatti,38 M. Binkley,12 D. Bisello,32 M. Bishai,12 R. E. Blair,2 C. Blocker,4 K. Bloom,26 B. Blumenfeld,20 S. R. Blusk,37 A. Bocci,38 A. Bodek,37 G. Bolla,36 Y. Bonushkin,6 D. Bortoletto,36 J. Boudreau,35 A. Brandl,28 S. van den Brink,20 C. Bromberg,27 M. Brozovic,11 E. Brubaker,24 N. Bruner,28 E. Buckley-Geer,12 J. Budagov,10 H. S. Budd,37 K. Burkett,17 G. Busetto,32 A. Byon-Wagner,12 K. L. Byrum,2 S. Cabrera,11 P. Calafiura,24 M. Campbell,26 W. Carithers,24 J. Carlson,26 D. Carlsmith,47 W. Caskey,5 A. Castro,3 D. Cauz,43 A. Cerri,34 A. W. Chan,1 P. S. Chang,1 P. T. Chang,1 J. Chapman,26 C. Chen,33 Y. C. Chen,1 M. -T. Cheng,1 M. Chertok,5 G. Chiarelli,34 I. Chirikov-Zorin,10 G. Chlachidze,10 F. Chlebana,12 L. Christofek,19 M. L. Chu,1 J. Y. Chung,29 Y. S. Chung,37 C. I. Ciobanu,29 A. G. Clark,15 A. P. Colijn,12 A. Connolly,24 M. Convery,38 J. Conway,39 M. Cordelli,14 J. Cranshaw,41 R. Culbertson,12 D. Dagenhart,45 S. D’Auria,16 F. DeJongh,12 S. Dell’Agnello,14 M. Dell’Orso,34 S. Demers,37 L. Demortier,38 M. Deninno,3 P. F. Derwent,12 T. Devlin,39 J. R. Dittmann,12 A. Dominguez,24 S. Donati,34 J. Done,40 M. D’Onofrio,34 T. Dorigo,17 N. Eddy,19 K. Einsweiler,24 J. E. Elias,12 E. Engels, Jr.,35 R. Erbacher,12 D. Errede,19 S. Errede,19 Q. Fan,37 H.-C. Fang,24 R. G. Feild,48 J. P. Fernandez,12 C. Ferretti,34 R. D. Field,13 I. Fiori,3 B. Flaugher,12 G. W. Foster,12 M. Franklin,17 J. Freeman,12 J. Friedman,25 Y. Fukui,23 I. Furic,25 S. Galeotti,34 A. Gallas,(∗) 17 M. Gallinaro,38 T. Gao,33 M. Garcia-Sciveres,24 A. F. Garfinkel,36 P. Gatti,32 C. Gay,48 D. W. Gerdes,26 E. Gerstein,8 P. Giannetti,34 P. Giromini,14 V. Glagolev,10 D. Glenzinski,12 M. Gold,28 J. Goldstein,12 I. Gorelov,28 A. T. Goshaw,11 Y. Gotra,35 K. Goulianos,38 C. Green,36 G. Grim,5 P. Gris,12 C. Grosso-Pilcher,9 M. Guenther,36 G. Guillian,26 J. Guimaraes da Costa,17 R. M. Haas,13 C. Haber,24 S. R. Hahn,12 C. Hall,17 T. Handa,18 R. Handler,47 W. Hao,41 F. Happacher,14 K. Hara,44 A. D. Hardman,36 R. M. Harris,12 F. Hartmann,21 K. Hatakeyama,38 J. Hauser,6 J. Heinrich,33 A. Heiss,21 M. Herndon,20 C. Hill,5 A. Hocker,37 K. D. Hoffman,9 R. Hollebeek,33 L. Holloway,19 B. T. Huffman,31 R. Hughes,29 J. Huston,27 J. Huth,17 H. Ikeda,44 J. Incandela,(∗∗) 12 G. Introzzi,34 A. Ivanov,37 J. Iwai,46 Y. Iwata,18 E. James,26 M. Jones,33 U. Joshi,12 H. Kambara,15 T. Kamon,40 T. Kaneko,44 M. Karagoz Unel,(∗) 40 K. Karr,45 S. Kartal,12 H. Kasha,48 Y. Kato,30 T. A. Keaffaber,36 K. Kelley,25 M. Kelly,26 D. Khazins,11 T. Kikuchi,44 B. Kilminster,37 B. J. Kim,22 D. H. Kim,22 H. S. Kim,19 M. J. Kim,8 S. B. Kim,22 S. H. Kim,44 Y. K. Kim,24 M. Kirby,11 M. Kirk,4 L. Kirsch,4 S. Klimenko,13 P. Koehn,29 K. Kondo,46 J. Konigsberg,13 A. Korn,25 A. Korytov,13 E. Kovacs,2 J. Kroll,33 M. Kruse,11 S. E. Kuhlmann,2 K. Kurino,18 T. Kuwabara,44 A. T. Laasanen,36 N. Lai,9 S. Lami,38 S. Lammel,12 J. Lancaster,11 M. Lancaster,24 R. Lander,5 A. Lath,39 G. Latino,34 T. LeCompte,2 K. Lee,41 S. Leone,34 J. D. Lewis,12 M. Lindgren,6 T. M. Liss,19 J. B. Liu,37 Y. C. Liu,1 D. O. Litvintsev,12 O. Lobban,41 N. S. Lockyer,33 J. Loken,31 M. Loreti,32 D. Lucchesi,32 P. Lukens,12 S. Lusin,47 L. Lyons,31 J. Lys,24 R. Madrak,17 K. Maeshima,12 P. Maksimovic,17 L. Malferrari,3 M. Mangano,34 M. Mariotti,32 G. Martignon,32 A. Martin,48 J. A. J. Matthews,28 P. Mazzanti,3 K. S. McFarland,37 P. McIntyre,40 M. Menguzzato,32 A. Menzione,34 P. Merkel,12 C. Mesropian,38 A. Meyer,12 T. Miao,12 R. Miller,27 J. S. Miller,26 H. Minato,44 S. Miscetti,14 M. Mishina,23 G. Mitselmakher,13 Y. Miyazaki,30 N. Moggi,3 E. Moore,28 R. Moore,26 Y. Morita,23 T. Moulik,36 M. Mulhearn,25 A. Mukherjee,12 T. Muller,21 A. Munar,34 P. Murat,12 S. Murgia,27 J. Nachtman,6 V. Nagaslaev,41 S. Nahn,48 H. Nakada,44 I. Nakano,18 C. Nelson,12 T. Nelson,12 C. Neu,29 D. Neuberger,21 C. Newman-Holmes,12 C.-Y. P. Ngan,25 H. Niu,4 L. Nodulman,2 A. Nomerotski,13 S. H. Oh,11 Y. D. Oh,22 T. Ohmoto,18 T. Ohsugi,18 R. Oishi,44 T. Okusawa,30 J. Olsen,47 W. Orejudos,24 C. Pagliarone,34 F. Palmonari,34 R. Paoletti,34 V. Papadimitriou,41 D. Partos,4 J. Patrick,12 G. Pauletta,43 M. Paulini,8 C. Paus,25 D. Pellett,5 L. Pescara,32 T. J. Phillips,11 G. Piacentino,34 K. T. Pitts,19 A. Pompos,36 L. Pondrom,47 G. Pope,35 F. Prokoshin,10 J. Proudfoot,2 F. Ptohos,14 O. Pukhov,10 G. Punzi,34 A. Rakitine,25 F. Ratnikov,39 D. Reher,24 A. Reichold,31 P. Renton,31 A. Ribon,32 W. Riegler,17 F. Rimondi,3 L. Ristori,34 M. Riveline,42 W. J. Robertson,11 T. Rodrigo,7 S. Rolli,45 L. Rosenson,25 R. Roser,12 R. Rossin,32 C. Rott,36 A. Roy,36 A. Ruiz,7 A. Safonov,5 R. St. Denis,16 W. K. Sakumoto,37 D. Saltzberg,6 C. Sanchez,29 A. Sansoni,14 L. Santi,43 H. Sato,44 P. Savard,42 A. Savoy-Navarro,12 P. Schlabach,12 E. E. Schmidt,12 M. P. Schmidt,48 M. Schmitt,(∗) 17 L. Scodellaro,32 A. Scott,6 A. Scribano,34 A. Sedov,36 S. Segler,12 S. Seidel,28 Y. Seiya,44 A. Semenov,10 F. Semeria,3 T. Shah,25 M. D. Shapiro,24 P. F. Shepard,35 T. Shibayama,44 M. Shimojima,44 M. Shochet,9 A. Sidoti,32 J. Siegrist,24 A. Sill,41 P. Sinervo,42 P. Singh,19 A. J. Slaughter,48 K. Sliwa,45 C. Smith,20 F. D. Snider,12 A. Solodsky,38 J. Spalding,12 T. Speer,15 P. Sphicas,25 F. Spinella,34 M. Spiropulu,9 L. Spiegel,12 J. Steele,47 A. Stefanini,34 J. Strologas,19 F. Strumia, 15 D. Stuart,12 K. Sumorok,25 T. Suzuki,44 T. Takano,30 R. Takashima,18 K. Takikawa,44 P. Tamburello,11 M. Tanaka,44 B. Tannenbaum,6 M. Tecchio,26 R. J. Tesarek,12 P. K. Teng,1 K. Terashi,38 S. Tether,25 A. S. Thompson,16 E. Thomson,29 R. Thurman-Keup,2 P. Tipton,37 S. Tkaczyk,12 D. Toback,40 K. Tollefson,37 A. Tollestrup,12 D. Tonelli,34 H. Toyoda,30 W. Trischuk,42 J. F. de Troconiz,17 J. Tseng,25 D. Tsybychev,13 N. Turini,34 F. Ukegawa,44 T. Vaiciulis,37 J. Valls,39 S. Vejcik III,12 G. Velev,12 G. Veramendi,24 R. Vidal,12 I. Vila,7 R. Vilar,7 I. Volobouev,24 M. von der Mey,6 D. Vucinic,25 R. G. Wagner,2 R. L. Wagner,12 N. B. Wallace,39 Z. Wan,39 C. Wang,11 M. J. Wang,1 S. M. Wang,13 B. Ward,16 S. Waschke,16 T. Watanabe,44 D. Waters,31 T. Watts,39 R. Webb,40 H. Wenzel,21 W. C. Wester III,12 A. B. Wicklund,2 E. Wicklund,12 T. Wilkes,5 H. H. Williams,33 P. Wilson,12 B. L. Winer,29 D. Winn,26 S. Wolbers,12 D. Wolinski,26 J. Wolinski,27 S. Wolinski,26 S. Worm,39 X. Wu,15 J. Wyss,34 W. Yao,24 G. P. Yeh,12 P. Yeh,1 J. Yoh,12 C. Yosef,27 T. Yoshida,30 I. Yu,22 S. Yu,33 Z. Yu,48 A. Zanetti,43 F. Zetti,24 and S. Zucchelli3
(CDF Collaboration)
1 Institute of Physics, Academia Sinica, Taipei, Taiwan 11529, Republic of China
2 Argonne National Laboratory, Argonne, Illinois 60439
3 Istituto Nazionale di Fisica Nucleare, University of Bologna, I-40127 Bologna, Italy
4 Brandeis University, Waltham, Massachusetts 02254
5 University of California at Davis, Davis, California 95616
6 University of California at Los Angeles, Los Angeles, California 90024
7 Instituto de Fisica de Cantabria, CSIC-University of Cantabria, 39005 Santander, Spain
8 Carnegie Mellon University, Pittsburgh, PA 15218
9 Enrico Fermi Institute, University of Chicago, Chicago, Illinois 60637
10 Joint Institute for Nuclear Research, RU-141980 Dubna, Russia
11 Duke University, Durham, North Carolina 27708
12 Fermi National Accelerator Laboratory, Batavia, Illinois 60510
13 University of Florida, Gainesville, Florida 32611
14 Laboratori Nazionali di Frascati, Istituto Nazionale di Fisica Nucleare, I-00044 Frascati, Italy
15 University of Geneva, CH-1211 Geneva 4, Switzerland
16 Glasgow University, Glasgow G12 8QQ, United Kingdom
17 Harvard University, Cambridge, Massachusetts 02138
18 Hiroshima University, Higashi-Hiroshima 724, Japan
19 University of Illinois, Urbana, Illinois 61801
20 The Johns Hopkins University, Baltimore, Maryland 21218
21 Institut für Experimentelle Kernphysik, Universität Karlsruhe, 76128 Karlsruhe, Germany
22 Center for High Energy Physics: Kyungpook National University, Taegu 702-701; Seoul National University, Seoul 151-742; and SungKyunKwan University, Suwon 440-746; Korea
23 High Energy Accelerator Research Organization (KEK), Tsukuba, Ibaraki 305, Japan
24 Ernest Orlando Lawrence Berkeley National Laboratory, Berkeley, California 94720
25 Massachusetts Institute of Technology, Cambridge, Massachusetts 02139
26 University of Michigan, Ann Arbor, Michigan 48109
27 Michigan State University, East Lansing, Michigan 48824
28 University of New Mexico, Albuquerque, New Mexico 87131
29 The Ohio State University, Columbus, Ohio 43210
30 Osaka City University, Osaka 588, Japan
31 University of Oxford, Oxford OX1 3RH, United Kingdom
32 Universita di Padova, Istituto Nazionale di Fisica Nucleare, Sezione di Padova, I-35131 Padova, Italy
33 University of Pennsylvania, Philadelphia, Pennsylvania 19104
34 Istituto Nazionale di Fisica Nucleare, University and Scuola Normale Superiore of Pisa, I-56100 Pisa, Italy
35 University of Pittsburgh, Pittsburgh, Pennsylvania 15260
36 Purdue University, West Lafayette, Indiana 47907
37 University of Rochester, Rochester, New York 14627
38 Rockefeller University, New York, New York 10021
39 Rutgers University, Piscataway, New Jersey 08855
40 Texas A&M University, College Station, Texas 77843
41 Texas Tech University, Lubbock, Texas 79409
42 Institute of Particle Physics, University of Toronto, Toronto M5S 1A7, Canada
43 Istituto Nazionale di Fisica Nucleare, University of Trieste/ Udine, Italy
44 University of Tsukuba, Tsukuba, Ibaraki 305, Japan
45 Tufts University, Medford, Massachusetts 02155
46 Waseda University, Tokyo 169, Japan
47 University of Wisconsin, Madison, Wisconsin 53706
48 Yale University, New Haven, Connecticut 06520
(∗) Now at Northwestern University, Evanston, Illinois 60208
(∗∗) Now at University of California, Santa Barbara, CA 93106
Abstract
We present measurements of the meson total cross section and
differential cross section . The measurements use a 98 4 pb-1 sample
of collisions at TeV collected by the CDF
detector. Charged meson candidates are reconstructed through the
decay with . The total cross section, measured in the central rapidity region
for GeV/, is b.
The measured differential cross section is substantially larger than
typical QCD predictions calculated to next-to-leading order.
PACS numbers: 13.85.Ni, 12.38.Qk, 13.25.Hw, 14.40.Nd
I Introduction
Quantum Chromodynamics (QCD) can be used to compute the expected cross sections for the production of heavy quarks at hadron collider energies. Calculations of the hard-scattering cross section have been carried out to next-to-leading order in perturbation theory QCDcalc . Experimental measurements must show that these predictions provide an adequate description of the cross section at 1.8 TeV before they can be confidently extrapolated to higher energies or more exotic phenomena. Unfortunately the QCD predictions are affected by large theoretical uncertainties such as the dependence on the choice of the factorization and renormalization scales, the parton density parameterization and the quark mass Mangano .
Experiments at CERN ua1 and at the Tevatron tevatron have shown that the quark production cross section is higher than the theoretical predictions obtained with the standard choice of parameters by about a factor of 2–3. Closer agreement between theory and the experimental measurements can be achieved by choosing rather extreme values of the theoretical parameters Mangano . It has also been suggested that the large discrepancy could be explained by pair production of light gluinos that decay into bottom quarks and bottom squarks Berger .
This paper describes a measurement of the meson total cross section and differential cross section in hadronic collisions using fully reconstructed mesons decaying into the exclusive final state . The measurement uses a data sample of 98 4 pb-1 collected by the Collider Detector at Fermilab (CDF) experiment from collisions with a center-of-mass energy of 1.8 TeV produced by the Fermilab Tevatron. The data were collected in the run period from 1992 to 1995 which is referred to as Run 1. Our previously published result CDFold based upon pb-1 of data (Run 1A) found that the total cross section for and is = 2.39 0.54(stat syst) b.
The paper is organized as follows. In Section II we review previous measurements of the cross section using exclusive decays. In Section III we briefly describe the components of the CDF detector relevant to the analysis presented in this paper. The data collection, event selection procedures and the reconstruction of are discussed in Section IV. The measurement of the differential and total cross sections is presented in Sections V and VI, respectively.
II Previous Measurement of the Production Cross Section
The Run 1A measurement of the meson differential cross section was determined from fully reconstructing the decays and CDFold . The measurement of the transverse momentum spectrum showed that next-to-leading-order QCD adequately described the shape of this distribution for GeV/. In the Run 1A publication, CDF used a branching ratio = and a product of branching fractions = Cleo . The current world average for is which yields . The change in the branching fractions scales the published result up by about 10% to ( 6.0 GeV/, ) = (stat syst)b.
This paper updates the measurement presented in 1995 by using the complete Run 1 data sample of 98 4 pb-1 . For this measurement, we use only the decay mode where we require both muon candidates from the decay to be well measured by the silicon vertex detector (SVX). Such a restriction allows us to use fewer selection requirements since the decay mode has a lower combinatorial background than , and the SVX information enables us to substantially reduce the prompt background. Moreover, several of the efficiencies are measured using a large sample of candidates rather than relying on Monte Carlo calculations for detailed modeling of detector effects.
III The CDF detector
The CDF detector is described in detail in CDFdet . We summarize here the features of the detector subsystems that are important for this analysis. The CDF coordinate system has the axis pointing along the proton beam momentum, and the angle is measured from the plane of the Tevatron storage ring. The transverse (-) plane is normal to the proton beam.
The CDF experiment uses three separate detectors for tracking charged particles: the silicon vertex detector (SVX), the vertex detector (VTX), and the central tracking chamber (CTC). These devices are immersed in a magnetic field of 1.4 Tesla pointed along the axis generated by a superconducting solenoid of length 4.8 m and radius 1.5 m.
The innermost device is the SVX CDFsvx which provides spatial measurements in the - plane. The SVX consists of two cylindrical barrels that cover a region 51 cm long in . Each barrel consists of four layers of silicon strip sensors with strips oriented parallel to the beam axis. The distribution of the collisions along the beamline is Gaussian in with a of about 30 cm. Therefore only about % of all events have both muon tracks reconstructed in the SVX.
The SVX is surrounded by the VTX, a set of time projection chambers which measure the coordinate of the interaction (primary vertex). Surrounding the SVX and the VTX is the CTC. The CTC is a 3.2 m long cylindrical drift chamber with 84 layers of sense wires ranging in radius from 31 cm to 133 cm. The combined momentum resolution of the tracking chambers is = where is the component of the momentum transverse to the axis and is measured in GeV/. Charged track trajectories reconstructed in the CTC that are matched to strip clusters in the SVX have an impact parameter resolution of m resol with in units of GeV/. The track impact parameter is defined as the distance of closest approach of the track helix to the beam axis measured in the plane perpendicular to the beam.
The central muon system consists of three components (CMU, CMP and CMX) and detects muons with GeV/ in the pseudorapidity range . The CMU system covers the region and consists of four layers of drift chambers outside the hadron calorimeter. Outside the CMU there is an additional absorber of 60 cm of steel followed by four layers of drift chambers (CMP). The CMX system extends the coverage to pseudorapidity but is not used in this analysis.
CDF employs a three level trigger system. The first two levels are implemented in custom electronics. To select events in the third level, we employ a CPU farm using a version of the CDF event reconstruction program optimized for speed.
IV Data Sample Selection
IV.1 Dimuon Trigger
The data sample consists of events that pass the trigger. In the first level of this trigger, we require two muon track segments in the central muon chambers separated by at least in azimuth. The trigger efficiency for each muon at Level 1 rises from 50% for = 1.7 GeV to 95% for = 3.3 GeV.
In the second level, we require muon segments found in Level 1 to be associated with tracks identified by the Central Fast Tracker (CFT) CFT . The resolution of the CFT is . In Run 1A and for a subset of the Run 1B data, we required one of the two muons to be matched to a CFT track with greater than about 3 GeV while in the bulk of the Run 1B sample, we required two muon segments to have an associated track with a threshold of about 2 GeV. In Run 1A (1B), the extrapolation of the track was required to be typically within 10∘ (5∘) of the muon segment. The efficiency of the track requirements was measured in a data sample using events in which the muon under study need not have satisfied the requirements for the event to be accepted. The efficiency for the nominal 2 (3) GeV threshold rose from 50% of the plateau efficiency at 1.95 (3.05) GeV to 95% of the plateau efficiency at 2.2 (3.4) GeV. That plateau efficiency changed over the course of the run because of aging of the CTC and subsequent modifications to the CFT algorithms. That dependence on time is accounted for in the calculation of the trigger efficiencies.
The Level 3 software trigger required two muon candidates with an effective mass in the mass region after full reconstruction. Runs with known hardware problems for muons were removed yielding for this analysis a total Run 1 luminosity of 98 pb-1.
IV.2 Reconstruction
Background events in the dimuon sample collected with these triggers are suppressed by applying additional muon selection cuts. Track quality requirements are used to reduce the backgrounds arising from poor track measurements. Tighter cuts are imposed on the correlation between the track in the muon chamber and the extrapolated CTC track.
The transverse momentum of each muon from the for Run 1A is required to be greater than 1.8 GeV/ with one muon of the pair greater than 2.8 GeV/. For Run 1B, both muons are required to have a transverse momentum greater than 2.0 GeV/. Events passing both the trigger and requirements identical to those of Run 1A are also accepted. The muons must have opposite charge and the separation in between the two tracks must be less than 5.0 cm at the point of closest approach to the beamline. The coordinate of the decay vertex is required to be within cm of the detector center.
The invariant mass and uncertainty () of the candidates are calculated after constraining the two muon tracks to come from a common point in space (vertex constraint) to improve the mass resolution. The width of the reconstructed mass peak is 16 MeV/. The signal region is defined to be those dimuon candidates with reconstructed mass within 3.3 of the known mass PDG . We find over background. In this analysis, the two muons from the decay are required to be reconstructed in the silicon detector.
IV.3 Primary Vertex Selection
Knowledge of the distance between the primary interaction vertex and the secondary decay vertex in the transverse plane is crucial to this analysis since the meson proper lifetime is used to discriminate between mesons and background events. We find the transverse position of the primary vertex using the average beamline calculated for each Tevatron store CDFlife . The longitudinal coordinate of the primary vertex is measured using data from the VTX detector. The slopes and intercepts of the run-averaged beam position are combined with the event-by-event locations of the vertices to determine the vertex position. The primary vertex uncertainties , and are estimated to be 25, 25 and 300 m, respectively.
IV.4 Reconstruction
To select charged candidates we considered each charged particle track as a kaon candidate to be combined with a . A charged track in an event is combined with the two muons if the parameter of the track is within 5 cm of the position of the candidate decay vertex. The exit radius of the kaon candidate, which corresponds to the radius at which the track trajectory intersects the plane of the CTC endplate, is required to be greater than cm to limit the search to a region of high tracking efficiency. A cut on the kaon transverse momentum of GeV/ is imposed to reduce the large combinatorial background. This cut is very effective since kaons from meson decay have a considerably harder spectrum than particles from the underlying event and from events with prompt production. The muon and kaon tracks are constrained to come from a common point of origin and the mass of the pair is constrained to the known mass. Since the intrinsic width of the is significantly smaller than our experimental resolution, the mass constraint improves the resolution of the reconstructed mass.
The of each candidate is required to be greater than GeV/. The proper decay length is required to be greater than 100 m to suppress backgrounds associated with prompt mesons. The signed proper decay length in the rest frame is defined as
| (1) |
where
| (2) |
and is the relativistic boost of the meson . The are the transverse coordinates of the decay vertex, and the are the transverse coordinates of the event primary vertex. The intersection of the muon tracks as measured in the SVX determines the location of the meson decay.
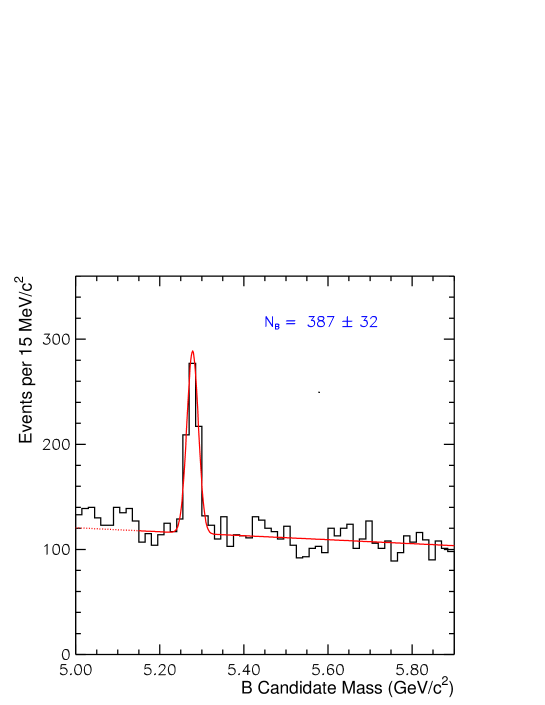
The candidate mass distribution is shown in Figure 1. The distribution is fit with a Gaussian signal function plus a linear background using an unbinned maximum likelihood fit. The region below 5.15 GeV/ has been excluded from the fit since it includes contributions from partially reconstructed higher-multiplicity -decay modes. The fit yields mesons.
V Differential cross section
To measure the differential cross section, we divide the candidate sample into four ranges. The invariant mass distributions for each of the ranges are then fitted using an unbinned maximum likelihood fit which is described in Section A. The determination of the geometric acceptance, the efficiencies and the luminosity are described in Sections B, C and D respectively. The systematic uncertainties are discussed in Section E, and the results are presented in Section F.
V.1 Fitting Technique
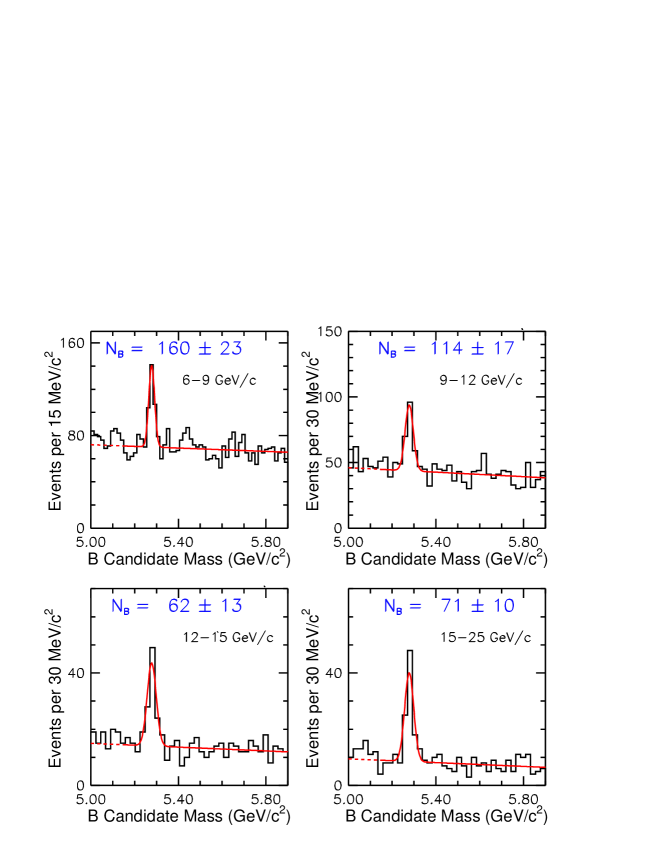
To measure the meson differential cross section as a function of , the candidate sample is divided into four bins: 6–9, 9–12, 12–15, and 15–25 . The invariant mass distribution for each of the ranges is then fitted using an unbinned maximum likelihood fit to determine the number of candidates in each range, as shown in Figure 2. The likelihood function is a Gaussian signal plus a linear background:
| (3) |
where the free parameter is the number of signal events and is the total number of candidates in each momentum bin. The function is the Gaussian signal mass function:
| (4) |
where is the candidate mass obtained from a kinematic fit of the muon and kaon tracks. The uncertainty on the mass is scaled by a free parameter in the unbinned maximum likelihood fit which is typically . The parameter is the mean mass obtained by fitting Figure 1. The background mass function is linear:
| (5) |
where is the slope of the background and is the mass range in the fit ( to GeV/). The region well above the mass yields a better estimate of the slope of the background since it is not affected by partially reconstructed decays. The likelihood function is minimized with respect to the parameters , and . The fit yields , , and events in the four transverse momentum bins.
V.2 Acceptances and Trigger Efficiencies
The acceptance is determined from a Monte Carlo simulation based on a next-to-leading-order QCD calculation QCDcalc using the MRST parton distribution functions MRST . The -quark pole mass is taken to be . The quarks are produced in the rapidity range with . The renormalization scale is , and the fragmentation scale is equal to the renormalization scale. The fragmentation into mesons is modeled using the Peterson fragmentation function pete with the parameter set to peterson . This value was extracted in a fit to data collected at colliders. Recent results from LEP and SLD suggest that lower values of and other functions better describe the fragmentation of quarks into hadrons SLDLEP . Futhermore the assumption that a fragmentation function extracted from data is an accurate description of fragmentation at a collider lacks a strong theoretical basis Mangano . However, the uncertainties due to these factors are expected to be smaller than the uncertainty on the renormalization scale.
Decays of Monte-Carlo-generated mesons into the and kaon final states are performed using a modified version of the CLEO Monte Carlo program qq which accounts for the expected longitudinal polarization. Once the mesons are generated and decayed into their final state, a simulation of the CDF detector is utilized. A simulation of the trigger efficiency has also been included in the acceptance calculation. The events are then processed by the same analysis code used on the data to determine the combined acceptance and trigger efficiency for each momentum bin. The Run 1A and 1B results which incorporate different trigger requirements are listed in Table 1 together with the combined results. The uncertainties given are statistical only.
| range | Trigger efficiency acceptance (%) | ||
|---|---|---|---|
| (GeV/) | Run 1A | Run 1B | Run 1 |
| 6–9 | 2.01 0.02 | 1.61 0.02 | 1.70 0.02 |
| 9–12 | 5.29 0.05 | 4.20 0.04 | 4.44 0.03 |
| 12–15 | 8.36 0.10 | 6.53 0.09 | 6.93 0.07 |
| 15–25 | 11.96 0.14 | 9.26 0.12 | 9.86 0.10 |
V.3 Efficiencies of the Additional Selection Requirements
The detector acceptance and trigger efficiencies described in the previous section did not account for all of the criteria for selecting a candidate. The efficiencies of the additional selection requirements are discussed in this section. Most of these efficiencies are determined using large CDF data samples.
There are two components that comprise the tracking efficiencies. The first part is the efficiency of the tracking in the Level 3 trigger system which is determined using an inclusive single muon data set. The efficiency is measured to be for Run 1B. During Run 1A, a portion of the data-taking suffered from the start time of each event being incorrectly determined. The result was an inefficiency in reconstruction at Level 3 which was determined to be l3effi averaged over all of Run 1A. The Level 3 Run 1A efficiency is .
Once an event has been accepted at Level 3, one must account for the offline CTC track reconstruction which may improve the muon track quality or find new tracks that are missed at Level 3. It is also necessary to correct for the track finding efficiency for the kaon track since it is not required in the Level 3 trigger. A detailed study thesis of the CTC track reconstruction efficiencies was conducted. To measure the efficiency, we simulate single kaon tracks with the CDF Monte Carlo. We then combine the generated CTC hits for such a kaon with the hits in an event with an identified displaced from the CDF data sample. Hits in the CTC are characterized by a leading edge and a time-over-threshold. Where a real and simulated hit overlap, the hits are combined. Thus the leading edges used in the track reconstruction may be obscured for the simulated kaon as they would be for real particles. We then run the full track reconstruction program on the modified event and search for a track corresponding to the embedded kaon. We find the efficiency of the track reconstruction to be for particles with 0.8 GeV that traversed all layers of the CTC, independent of instantaneous luminosity. The Run 1A single track reconstruction efficiency of is taken from Ref. CDFold .
The muon segment reconstruction efficiency is found to be resulting in a combined efficiency of . The efficiency of requiring both muons from the to have a muon chamber track segment that matches a track reconstructed in the CTC is found to be . The efficiency of this cut is determined from a sample of candidate events containing muons that were required to pass less stringent matching requirements at Level 3.
The fraction of events in which both muons from the have been reconstructed in the SVX is measured using a large data set. This fraction is for Run 1A and for Run 1B. The fraction for Run 1B is larger than Run 1A because the inner layer of the SVX detector was moved closer to the beamline, eliminating a small separation between silicon wafers in the first layer present in Run 1A.
The efficiency to reconstruct a meson with a proper decay length greater than 100 is determined using Monte Carlo simulations. The resolution is measured in the data set by fitting the proper lifetime of events in the sidebands of the candidate mass distribution with a Gaussian function for the prompt component and an exponential function for the long-lived component. The lifetimes of the Monte Carlo generated events are then smeared using the resolution measured in each range. The efficiency showed no significant variation with the transverse momentum even though the proper resolution was degraded by a factor of 2 from the lowest to the highest bin. The efficiency of is the mean of the values measured in each bin.
The reconstruction efficiencies are summarized in Table 2. For the candidates decaying to particles completely contained within the detector acceptance, the reconstruction efficiency is .
| Source | Efficiency in % | |
|---|---|---|
| Run1A | Run1B | |
| CTC tracking | ||
| L3 tracking | ||
| CTC- linking | ||
| Muon chamber | ||
| efficiency | ||
| matching cut | ||
| vertex cut | ||
| SVX fraction | ||
| 100 m | ||
| Total | ||
V.4 Luminosity Determination
At CDF the luminosity is measured using two telescopes of beam-beam counters to an accuracy of about 4%. We studied the quality of the integrated luminosity calculation in the inclusive sample. After correcting for the time-dependent trigger efficiency, we found that in Run 1B the measured cross section fell linearly as a function of instantaneous luminosity . However, for any narrow range of , was constant as a function of time. Since the minimum luminosity of the data sample is , we have considered two possible extrapolations of as a function of to to calculate a corrected integrated luminosity. The first extrapolation is performed assuming that the linear dependence is valid below and that:
| (6) |
We also perform the extrapolation assuming that no correction is needed below . The luminosity correction is taken to be the average of the two extrapolations and we assign a systematic uncertainty that covers the range between the two hypotheses. The correction to the integrated luminosity for Run 1B is
| (7) |
V.5 Systematic Uncertainties
We divide the systematic uncertainties in the measurement of the meson production cross section into two classes: dependent uncertainties that change from one bin to the next and fully correlated uncertainties that are independent of .
V.5.1 dependent systematic uncertainties
The dependent systematic uncertainties include variations of the production and decay kinematics that would affect the determination of the acceptance. We have considered effects due to the model used to generate the quark spectrum and uncertainties in our knowledge of the trigger efficiency.
The model used to generate the quarks is based on a QCD calculation at next-to-leading order. Large uncertainties in the calculation are due to unknown higher-order effects. These effects are quantified by estimating the scale dependence when the renormalization and factorization scales are varied by a factor of 2 above and below their central value of . The Peterson fragmentation parameter is varied by around its central value of . In each case the uncertainty on the acceptance is taken to be the difference between the acceptance found with the central value and the value found when each variable is varied by the indicated amounts. The dependence of acceptance on the parton density parametrization and the quark mass are much smaller and are not included in the systematic uncertainty. In addition, the parameters of the trigger simulation are varied by . The total dependent uncertainty is given by the sum in quadrature of the dependent systematic uncertainties summarized in Table III.
V.5.2 Correlated systematic uncertainties
The correlated systematic uncertainties include uncertainties that are independent of the meson spectrum. The largest of these uncertainties is due to limited knowledge of the branching ratio PDG which yields a systematic uncertainty of about 10%. Other sources of correlated uncertainties are due to the uncertainty on the total reconstruction efficiency shown in Table II and knowledge of the integrated luminosity collected at CDF during Run 1. There is an additional systematic uncertainty associated with the reconstruction of kaons that decay inside the CTC volume. A simulation shows that about of the kaons decay in flight, of which half are successfully reconstructed CDFold . We assign the full value of the correction as an uncertainty for the kaon acceptance of %. This assumes that such tracks are modeled realistically in the simulation. The total correlated uncertainty of is given by the sum in quadrature of the fully correlated systematic uncertainties summarized in Table IV.
| Source | Fractional uncertainty in each bin | |||
| range (GeV/) | 6–9 | 9–12 | 12–15 | 15–25 |
| QCD renormalization uncertainty | 1.6% | 1.5% | 1.7% | 1.5% |
| Peterson parameter uncertainty | 0.7% | 1.6% | 1.0% | 1.7% |
| Trigger efficiency uncertainty | 3.1% | 2.7% | 2.1% | 1.7% |
| dependent total (syst) | 3.6% | 3.5% | 2.9% | 2.8% |
| Source | Fractional uncertainty |
|---|---|
| Reconstruction efficiency | |
| Luminosity uncertainty | |
| Luminosity correction | |
| Branching ratio uncertainty | |
| Kaon decay-in-flight uncertainty | |
| Fully correlated total (systfc) |
V.6 Results
The differential cross section is calculated using the following equation:
| (8) |
where is the number of charged mesons determined from the likelihood fit of the mass distribution in each range. The factor of 1/2 is included because both and mesons are detected while we report the cross section for mesons assuming charge invariance in the production process. The width of the bin is and is the corrected integrated luminosity of the sample. The geometric and kinematic acceptance is determined from the Monte Carlo simulation and includes the kinematic and trigger efficiencies. The efficiency is the additional reconstruction efficiency not included in the simulation. The product of branching ratios is determined using the the world-average PDG branching fractions:
| (9) |
| (10) |
Table V lists the differential cross section as a function of . The three uncertainties quoted on the cross section are statistical (stat), dependent systematic (syst), and fully correlated systematic (systfc), respectively.
| Events | Acceptance | Cross section | |
|---|---|---|---|
| ( ) | (%) | (nb/[GeV/]) | |
| 7.34 | 160 23 | 1.70 0.02 | 815 117(stat) 31(syst) 104(systfc) |
| 10.35 | 114 17 | 4.44 0.03 | 222 33(stat) 8(syst) 28(systfc) |
| 13.36 | 62 13 | 6.93 0.07 | 77.5 16.2(stat) 2.4(syst) 9.9(systfc) |
| 18.87 | 71 10 | 9.86 0.10 | 18.7 2.6(stat) 0.6(syst) 2.4(systfc) |
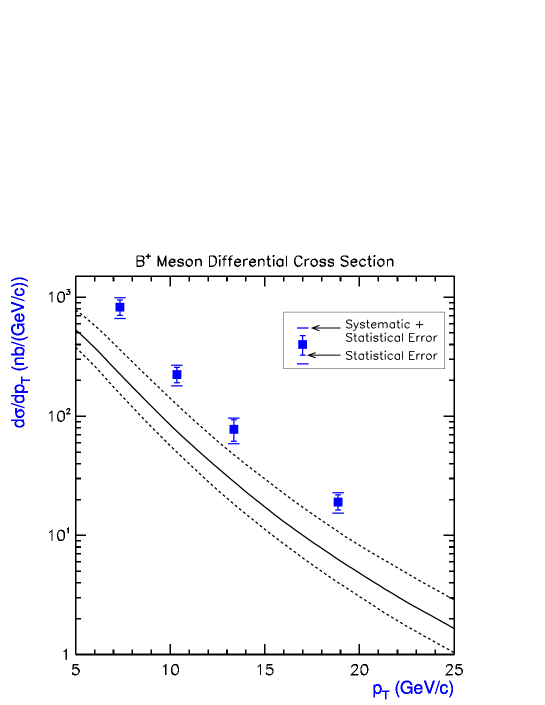
Figure 3 shows the measured differential cross section at the mean of each bin compared to the next-to-leading-order QCD QCDcalc calculation using the MRST parton density functions MRST . The experimental points are plotted at which is the value of for which the theoretical differential cross section MRST equals the mean cross section in each momentum range
| (11) |
The dashed lines in Figure 3 indicate the change in the theoretical predictions as the quark mass is varied between and , the renormalization scale is varied between and , and the Peterson fragmentation parameter is varied between 0.004 and 0.008. The solid curve is for the central values of these parameters: GeV/, , and . The fraction of quarks that fragment into is CDFfrag . This fraction is varied between 0.352 and 0.398.
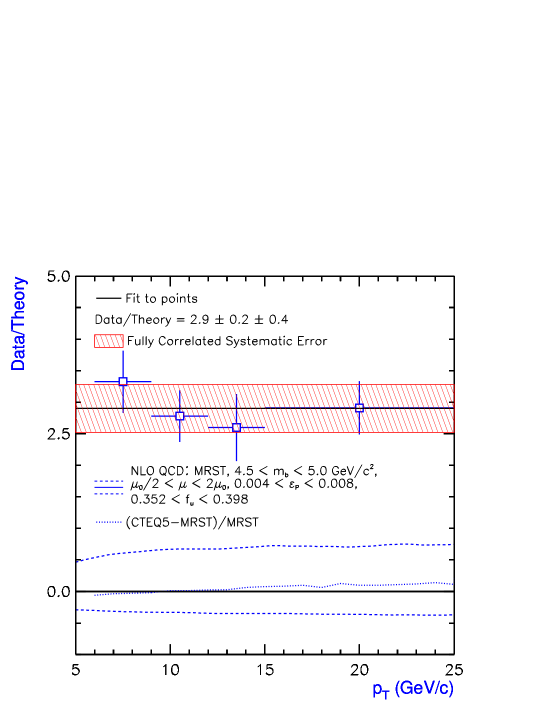
The comparison between data and theory for is aided by plotting the ratio of data/theory on a linear scale, as shown in Figure 4. The level of agreement between the data and the theoretical prediction is determined by fitting a line through the four ratio points. The fit yields a scale factor for data/theory of with a confidence level of 72%. The first uncertainty on the scale factor is the uncertainty returned by the fit to the ratio points whose uncertainties were determined by summing the statistical and the dependent systematic uncertainties in quadrature. The second uncertainty is the fully correlated systematic uncertainty. The hatched band shows the magnitude of the fully correlated uncertainty which arises mainly due to the poor knowledge of the branching franction. Also shown is a comparison between the shape of the QCD predictions obtained using a different set of parton distribution functions determined by the CTEQ collaboration CTEQ . The effect of changing the parton distribution functions is negligible in comparison with the variation associated with uncertainties in the quark mass, the fragmentation parameter and the renormalization scale shown by the dashed curves.
VI The total cross section
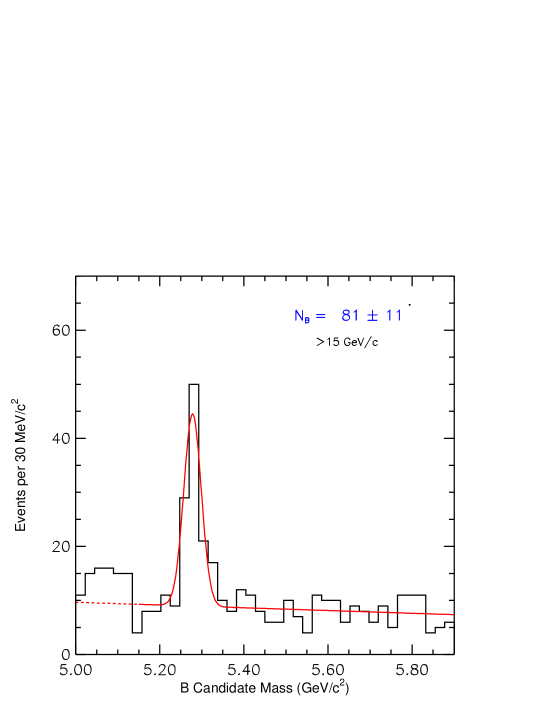
The total cross section is obtained by using a method similar to the one used for the determination of the differential cross section. However, the last tranverse momentum bin, 15–25 GeV/, is replaced with the invariant mass distribution for candidate events with 15 shown in Fig. 5. With 81 11 candidates and an acceptance of (10.19 0.16)%, the integrated cross section for GeV/ is 207 28(stat) 5(syst) 26(systfc) nb. The integrated cross section for transverse momentum GeV/ and is given by:
| (12) |
where is the number of charged candidate events in each momentum bin, is the acceptance and is reconstruction efficiency. The total cross section is:
| (13) |
where the first uncertainty is the sum in quadrature of the statistical and dependent systematic uncertainty, and the second uncertainty is the fully correlated systematic uncertainty.
VII Summary
The exclusive decay has been used to measure the production cross section of the meson from data collected by the CDF detector. A sample size of events is obtained from 98 4 pb-1 of 1.8 TeV collisions produced by the Fermilab Tevatron collider.
The measured total production cross section for and is
| (14) |
where the uncertainty is the sum in quadrature of the statistical and both correlated and dependent systematic uncertainties. The differential cross section is measured to be times higher than the NLO QCD predictions with agreement in shape. The first uncertainty is the sum in quadrature of the statistical and dependent systematic uncertainty and the second is the correlated systematic uncertainty. The new measurement of the differential cross section confirms that the absolute rate is larger than the limits of that predicted by typical variations in the theoretical parameters.
These measurements supersede those of reference CDFold .
Acknowledgements.
We thank the Fermilab staff and the technical staffs of the participating institutions for their vital contributions. This work was supported by the U.S. Department of Energy and National Science Foundation; the Italian Istituto Nazionale di Fisica Nucleare; the Ministry of Education, Science, Sports and Culture of Japan; the Natural Sciences and Engineering Research Council of Canada; the National Science Council of the Republic of China; the Swiss National Science Foundation; the A.P. Sloan Foundation; the Bundesministerium fuer Bildung und Forschung, Germany; and the Korea Science and Engineering Foundation.References
- (1) Nason et al., Nucl. Phys. B327, 49 (1989), erratum ibid. B335, 260 (1990); Beeneker et al., Nucl. Phys. B351, 505 (1991).
- (2) S. Frixione, M. Mangano, P. Nason, and G. Ridolfi, Heavy Flavors II, eds. A.J. Buras and M. Lindner, Advanced Series on direction in High Energy Physics, World Scientific Publishing Co., Singapore, 1997.
- (3) UA1 Collaboration, C. Albajar et al., Phys. Lett. B 186, 237 (1987); 256, 121 (1991).
- (4) CDF Collaboration, F. Abe et al., Phys. Rev. Lett. 71, 500 (1993); ibid. 79, 572 (1997) Phys. Rev., Lett. 75, 1451 (1995); D0 Collaboration, B. Abbot et al., Phys. Lett. B 487, 264 (2000); D0 Collaboration, B. Abbot et al., hep-ex/0008021.
- (5) E. L. Berger, B. W. Harris, D. E. Kaplan, Z. Sullivan, T. M. P. Tait, C. E. M. Wagner, Phys.Rev. D 63, 115001 (2001).
- (6) CDF Collaboration, F. Abe et al., Phys. Rev. Lett. 75, 1451 (1995).
- (7) M. S. Alam et al., Phys. Rev. D 50, 43 (1994).
- (8) CDF Collaboration, F. Abe et al., Nucl. Instrum. Methods Phys. Res., Sect. A271, 388 (1988).
- (9) S. Tkaczyk et al., Nucl. Instrum. Methods Phys. Res., Sect. A342, 240 (1994); D. Amidei et al., Nucl. Instrum. Methods Phys. Res., Sect. A360, 137 (1995).
- (10) D. Amidei et al., Nucl. Instrum. Methods Phys. Res., Sect. A350, 73 (1994).
- (11) G. Foster et al., Nucl. Instrum. Methods Phys. Res., Sect.A269, 93 (1988).
- (12) Particle Data group, C. Caso et al., Eur. Phys. J. C 3, 1 (1998).
- (13) CDF Collaboration, F. Abe et al., Phys. Rev. D 57, 5382 (1998); Phys. Rev. D 59, 32004 (1999); Phys. Rev. D 58, 92002 (1998).
- (14) A. Martin, W. Stirling and R. Roberts, Phys. Lett. B 306, 145 (1993); Phys. Lett. B 443, 301 (1998); Eur. Phys. J. C 4 , 463 (1998).
- (15) C. Peterson et al., Phys. Rev. D 27, 105 (1983).
- (16) J. Chrin, Z. Phys. C 36, 163 (1987).
- (17) OPAL Collaboration, G. Alexander et al., Phys. Lett. B 364, 93 (1995); SLD Collaboration, K. Abe et al., Phys. Rev. Lett. 84, 4300 (2000); ALEPH Collaboration, A. Heister et al., Phys. Lett. B 512, 30 (2001).
- (18) P. Avery, K. Read and G. Trahern, “QQ: A Monte Carlo Generator”, CLEO Internal Software Note CSN-212, Cornell University, 1985.
- (19) CDF Collaboration, F. Abe et al., Phys. Rev. Lett. 75, 4358 (1995).
- (20) T. Keaffaber, “Measurement of the Meson Cross section in Proton-Antiproton Collisions at 1.8 TeV Using the Fully Reconstructed Decay , Purdue University Dissertation, 2000.
- (21) CDF Collaboration, F. Abe et al., Phys. Rev. D 57, R3811 (1998).
- (22) CDF Collaboration, T. Affolder et al., Phys. Rev. D 60 92005, (1999); CDF Collaboration, T. Affolder et al., Phys. Rev. Lett. 84 1663, (2000).
- (23) H. L. Lai et. al, “Global QCD Analysis of Parton Structure of the Nucleon: CTEQ5 Parton Distributions”, hep-ph/9903282, (1999).