Preprint IHEP 2001-13
hep-ph/0111128
Universal scaling behaviour of the transverse
polarization for inclusively produced hyperons
in hadron-hadron collisions
V.V.Abramov1
Experimental Physics Department,
Institute for High Energy Physics, P.O. Box 35,
Protvino, 142281 Moscow region, Russia
1E-mail: abramov_v@mx.ihep.su
Abstract
Experimental data on the polarization of hyperons, inclusively produced in hadron-hadron collisions, have been analyzed. It is shown that the existing data can be described by a function of transverse momentum () and two scaling variables = : . The function is proportional to , which results for some reactions in an oscillation of as a function of . The , as well as the magnitude and the sign of the hyperon polarization depend on quark composition of hadrons participating in a reaction. The atomic weight dependence of the hyperon polarization is characterized by the parameter . There is an analogy between the scaling properties of the hyperon polarization and the analyzing power () in hadron production reactions. This new scaling law allows one to predict hyperon polarization for reactions and kinematic regions, yet unexplored in experiments and to confront these predictions with future experiments and various models.
Keywords: Inclusive Reaction; Polarization; Asymmetry; Spin; QCD
PACS: 13.85.Ni; 13.88.+e; 12.38.Qk
1 Introduction
The understanding of spin-dependent effects in inclusive hadron production processes in the framework of QCD is still far from being satisfactory, despite significant experimental and theoretical progress over the past few years. In particular, the study of hyperon polarization () and the analyzing power () could provide invaluable and completely new insight into the field of “spin physics” and, in addition, might also yield a better understanding of the hadronization process.
In this paper we will study the existing data for one measured spin-dependent quantity (transverse hyperon polarization in inclusive reactions ) from an empirical point of view in collisions of unpolarized protons, antiprotons, , or hyperons with protons or nuclei.
Experiments on hyperon production performed during more than two decades since the first polarization observation [1] have shown that the hyperon polarization is significant in a wide range of beam energies. Almost all the existing data (with an equivalent proton momentum on a fixed target from 4 up to 2049 GeV/c) at medium and high energies are used for the analysis.
The study of hyperon polarization in and collisions has been carried out in many experiments and revealed an approximate scaling behaviour as a function of variable at fixed , as well as a function of at fixed [2]-[13]. Further investigations of the hyperon and proton polarization using different beams and targets have shown its dependence on the hyperon and the beam flavors, as well as on the target atomic weight [14]-[42]. It has to be mentioned that a large value of the hyperon polarization represents a significant problem for the existing strong interaction theory which predicts, in the framework of pertubative Quantum Chromodynamics (pQCD), the vanishing of the polarization at high and energy [43]. For the review of the hyperon polarization data and the existing models see [44, 45, 46].
Recently a new scaling law has been proposed for a hadron production analyzing power () in reactions
where , and are hadrons, and the hadron is transversely polarized [47, 48]. Since the hyperon polarization and the hadron analyzing power could be closely related [49], it is reasonable to expect that similar scaling properties take place for the inclusive hyperon production in collisions of unpolarized hadron beams with protons or nuclei. According to Ref. [48] at high energies ( GeV) and high transverse momentum ( GeV/c) can be described by a simple function of two variables, and :
| (1) |
where
| (2) |
Here, , and are four-momenta of the produced hadron, the target hadron and the beam hadron, respectively. The energies (produced hadron) and (beam hadron) are measured in a reference frame, where a polarized ( or ) particle strikes an unpolarized target ( or ) which is at rest. There are also alternative expressions for the scaling variable , which are close to (2) numerically at the high beam and secondary hadron energies [48]. In particular, neglecting masses in (2), we have in the c.m. frame
| (3) |
where and . Here , and is momentum of the produced hadron, its longitudinal component and the maximum possible value of it, respectively, all in the c.m. reference frame. Eqs. (1) and (3) describe for most of the hadron production reactions almost as well as eqs. (1) and (2) [48]. The only exception is the for hyperon production in collisions, for which the variable (3) is preferable since it gives a smaller ( for (3) vs 39.4/44 for (2)), where is the number of degrees of freedom in a fit. It is interesting that hyperon polarization is also better described by eq. (1) if is given by (3).
It has to be mentioned that the variable was used to describe the scaling properties of the secondary hadron () spectra in the region [50].
A natural generalization of (3) is given by a linear function of and variables with relative weights which could be determined from the data fit:
| (4) |
where . For the variable in (4) is close to in the beam fragmentation region () and in the central region (). The variable have similar properties in the backward hemisphere (). For variable is identical to (eq.(3)).
The hyperon polarization features are different in some respects from the analyzing power features listed in [48]. In particular, we have to take into account that the polarization of hyperons produced in collisions is antisymmetric in by virtue of rotational invariance [11, 51]:
| (5) |
From the relation (5) we have also for the hyperon polarization for or other symmetric initial states in contrast to the analyzing power, which could be different from zero even at , see [48]. The initial state is not symmetric with respect to the rotation since one proton is polarized.
From a dimensional analysis alone, the polarization admits two types of contributions, which are functions of and :
| (6) |
where , and are Mandelstam variables:
| (7) | |||||
where in the last column the hadron masses are neglected. It is easy to show that at high energies the following approximations are valid:
| (8) |
| (9) |
where are given by eq. (4) with . Relations, similar to (8)-(9), have been used in Refs. [52, 53]. Using eqs. (7) - (9) it is easy to show that , where is given by eq. (2).
The expression, which takes into account (5)-(9) and other features of is given below:
| (10) |
where an additional phase and a signature parameter are introduced to take into account a possible violation of (5) for collisions, different from one (for collisions and ). It is assumed below that for collisions, while could be different from zero. The functions and are determined below from the experimental data.
Exactly the same approach can be used to derive an expression for the . The difference is that in the last case in (6), and dominates, at least for the reaction, as the data fit show, over .
For the process we use an expression
| (11) |
for the , where is a fit parameter and is measured in GeV/c. The other processes may require a different expression. The exact shape of the should be measured in future experiments. For the we use an expression
| (12) |
similar to the one, used in [48], which allows one to reproduce such features, as an approximate linear dependence of on the , and non-linear, sometimes oscillating behaviour of the hyperon polarization for other reactions. The difference of eq. (12) from the corresponding expression in [48] is that the former has an additional factor , that makes parameters and less correlated and reflects the tendency of hyperon polarization magnitude decrease with rise. The parameters , , , , and are determined from the data.
The polarization data fits indicate that both parameters and can depend on and only at high enough GeV/c are compatible with -independent constant values:
| (13) |
| (14) |
where the target dependent factor is introduced to insure for collisions, as required by relation (5). For a neutron target , so the phase is the only parameter in the above equations which makes the hyperon polarization for the proton target different from that of the neutron one. This feature of eq. (14) can be used to estimate the difference in the polarization of hyperons produced on the proton and the neutron targets.
The factor takes into account a possible atomic weight dependence of the hyperon polarization. The could be a constant or a function of kinematic variables:
| (15) |
where and are fit parameters.
In the beam fragmentation region , and , while . So, in this region the dependence of eq. (10) on is determined, mainly, by the first term . The second term in (10), has a weak dependence. In the target fragmentation region dependence is determined, mainly, by the .
Eq. (10) for can be expressed using (12) in a different way, with the explicit and dependences:
| (16) |
Eq. (10) has a more general form, but it coincides with (16) if we choose eq. (12) for and set . The magnitude of the hyperon polarization is about . It is assumed here that is equal unity at its maximum.
In case of the analyzing power measurements we have a non-zero contribution to the left-right asymmetry from the polarized hadron (beam or target) only and the feature (5) is not valid. Naively, we may say that the first term, , in (10), corresponding to a polarized beam, gives the main contribution to the analyzing power and, as a result, we have eq. (1) for it. For the case of hyperon polarization in the collisions both terms in (10), corresponding to the beam fragmentation and the target fragmentation, have non-zero contributions and cancel each other at , in accordance to (5).
Relation (5) is not valid in general for collisions of different hadrons, like or collisions. In these cases we have to use different functions and of and , respectively. In particular, parameter can be different from zero and can be different from unity.
It should be also mentioned, that in the case of a linear function and the terms are cancelled in (10). The use of in (12) makes non-linear, that prevents complete cancellation of terms in (10). A linear case corresponds to the limit in the above equations, while the data fits give for process , indicating a rather non-linear behaviour of at large values of arguments. As we will see in the following sections the can be expressed for different reactions via a linear combination of terms, which are functions of quantum numbers characterizing the particular reaction (see eq. (21)). Eq. (21) is used below to fix the in eq. (10) in data fits that allows us to estimate the other parameters with a better accuracy.
It follows from eqs. (10) - (15) that for the hadron-proton collisions the hyperon polarization and the analyzing power obey the Helmholtz equation:
| (17) |
Eq. (17) reflects the non-linearity of the dependence and its oscillation as a function of scaling variables , which is characterized by the parameter.
Most of the hyperon production experiments have been performed on nuclear targets, where relation (5) may not be exactly valid. Also, practically all the available data are concentrated in the forward hemisphere. We cannot exclude that future measurements in the backward hemisphere (nuclear target fragmentation region) will show some deviation from (15), which will require a correction of the polarization -dependence. An estimate of nuclear effects in the forward hemisphere will be given below on the base of existing data. We assume also for simplicity that the parameter is the same for the forward and the backward hemispheres and reflects the dynamics of strong interaction.
2 Lambda hyperon polarization in and collisions
The polarization of hyperons () in collisions has been measured in many experiments [2]-[13]. The data include proton collisions with protons and different nuclei ( and ).
We assume here that for the positive polarization and scattering to the left the hyperon spin is directed along the unit vector , which is the normal to the production plane. Here, and is a momentum of the beam hadron and that of the produced hyperon, respectively.
The fit parameters for eqs. (10)-(15) are shown in Table 1 for different fit conditions. The fits have been performed for the data [2]-[13].
In the fit # 1 all parameters are free. The use of -dependent phases and in eqs. (13)-(14) improves the fit quality significantly ( changed from 1.81 to 1.26).
The dependence of phases and on is shown in Fig. 1. As in the case of polarization dependence on (see Fig. 2) the phases and are described well by the terms with a plateau for above 1-2 GeV/c. The absolute value of is small in accordance with the approximate validity of the feature (5) for collisions.
The values of and for the fit # 1 are close to the expected ones (0.5 and 1, respectively) with . So, the fit # 1 supports the choice of scaling variables in the form and an approximate rotational asymmetry (5) for the polarization in collisions, though the experimental data exist only in the forward hemisphere. The parameter in the fit # 1 is equal to . The large value of excludes the possibility of a linear dependence of polarization on or variables.
The fit # 2 is made with four parameters fixed (, , and ) that simplifies eq. (10) and allows one to determine the other parameters with a better accuracy.
An interesting feature of the above fits is that at the first approximation the is proportional to . The higher is a hyperon momentum the more its polarization is attenuated by the interactions with a nuclear target. For a heavy nuclear target and a large we expect a significant attenuation of the polarization in comparison with the collisions case. In particular, for we have and the polarization on a Lead target is reduced by a factor . On a Beryllium target a corresponding factor is 0.79. A similar order of magnitude for the polarization degradation in complex nuclei can be found in [44], where it is also shown that the polarization degradation is -independent.
| Fit # | 1 | 2 | |
|---|---|---|---|
| -1.220.09 | -1.220.05 | ||
| 3.290.38 | |||
| 1.030.09 | 1.0 | ||
| 0.510.05 | 0.5 | ||
| 0.4040.034 | 0.4120.017 | ||
| 0.290.14 | 0.330.14 | ||
| 4.61.7 | 4.71.7 | ||
| 0.0770.025 | 0.0750.011 | ||
| 0.2180.061 | 0.2130.042 | ||
| 1.260.23 | 1.240.22 | ||
| 1.890.15 | 1.880.13 | ||
| -0.010.03 | 0.0 | ||
| -0.1330.053 | -0.1560.015 | ||
| 325.7/256 | 326.0/260 |
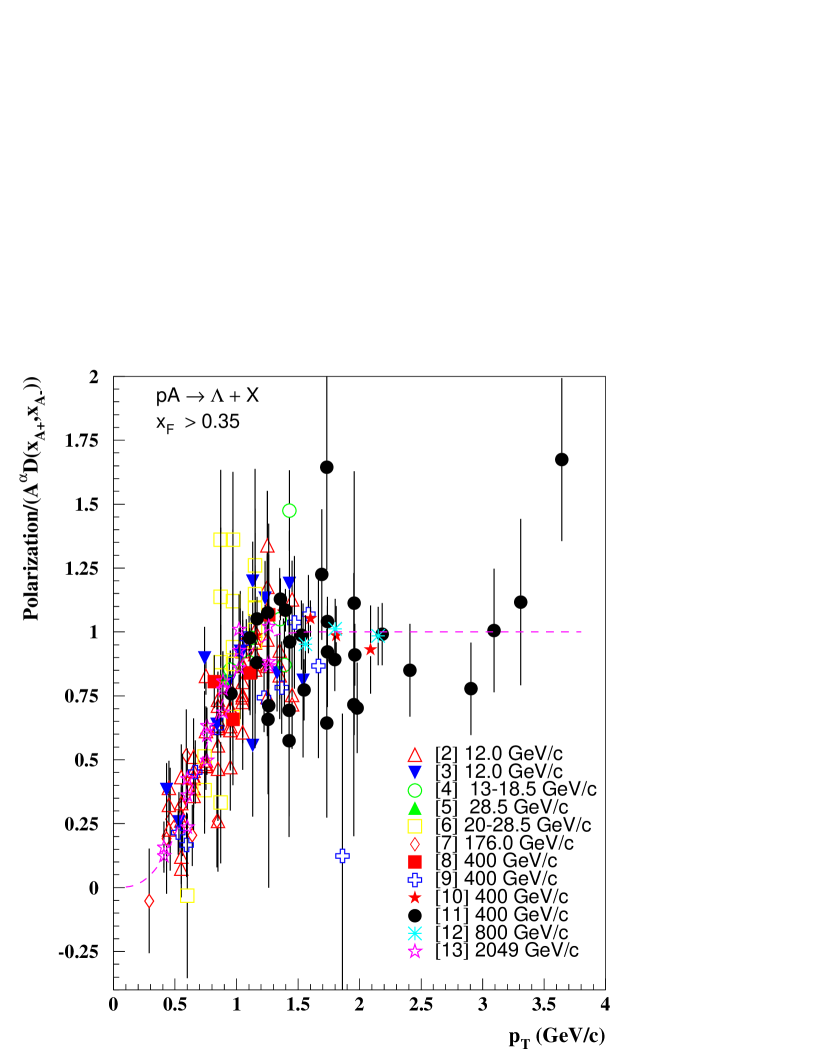
The dependence of is described by the function , which is sharply rising for GeV/c and is practically constant for higher . The experimental dependence of on is illustrated in Fig. 2 , where the ratio of and is shown, and
| (18) |
The ratio is assumed to be a function of only. An additional cut is used for the data shown in Fig. 2 to exclude the points with large fractional errors of the ratio. The data in Fig. 2 show the independence of the ratio on the beam energy, and the target type, and confirms the scaling behaviour and factorization of the and dependencies, assumed in (10). New measurements are desirable for GeV/c to clarify the and behaviour at high .
The dependence of on is illustrated in Fig. 3, where the most precise polarization data , measured in collisions at 400 and 800 GeV/c are shown [10, 11, 12]. The fitting curves reproduce the dependence, as well as small variations of it with .
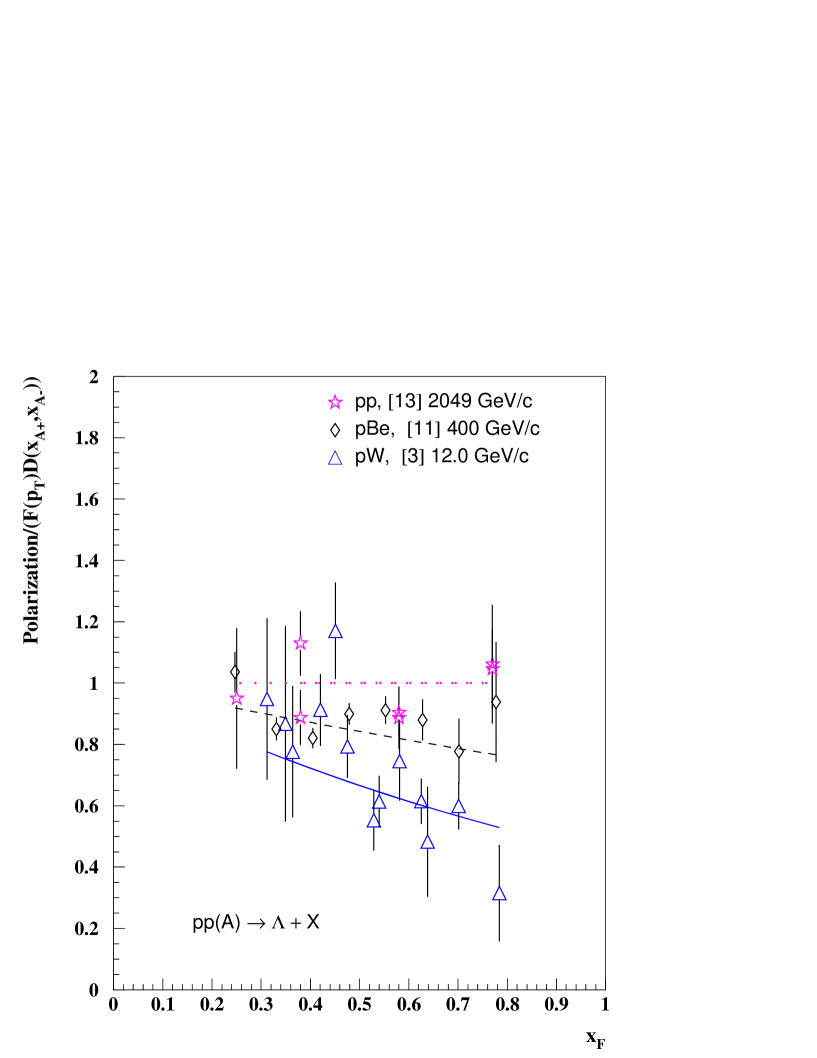
The attenuation of the polarization on nuclear targets and the dependence of the attenuation on are illustrated in Fig. 4. The measured polarization is divided by and the corresponding ratio is plotted in Fig. 4 vs . The data for the [13], [11], and [3] collisions show a decrease of polarization on and targets with rise in comparison with the proton-proton collisions case. The existing data on medium and heavy nuclear targets are limited in terms of their accuracy and kinematic range. Additional measurements on medium and heavy nuclear targets for positive and negative are desirable to confirm and clarify the polarization attenuation effects, shown in Fig. 4. It will be interesting also to measure the -dependence of the analyzing power and compare it with that of the hyperon polarization.
The general agreement between the data and the fits # 1 - # 2 can be considered a good one, taking into account statistical and possible systematic errors of the data in different experiments.
We may conclude that polarization reveals a scaling behaviour, when it is presented in a forward hemisphere as a function of two scaling variables (or and ) and .
3 Polarization of and hyperons in and collisions
In this section the polarization of and hyperons in and collisions is analyzed. The corresponding fit parameters are presented in Tables 2 and 3. The fits have been performed using eqs. (10)-(15), and eq.
| (19) |
for the function , which is found to be more appropriate for an approximation of the polarization dependence on . For this section and all the following the parameters and are fixed ( and ).
3.1 The hyperon polarization
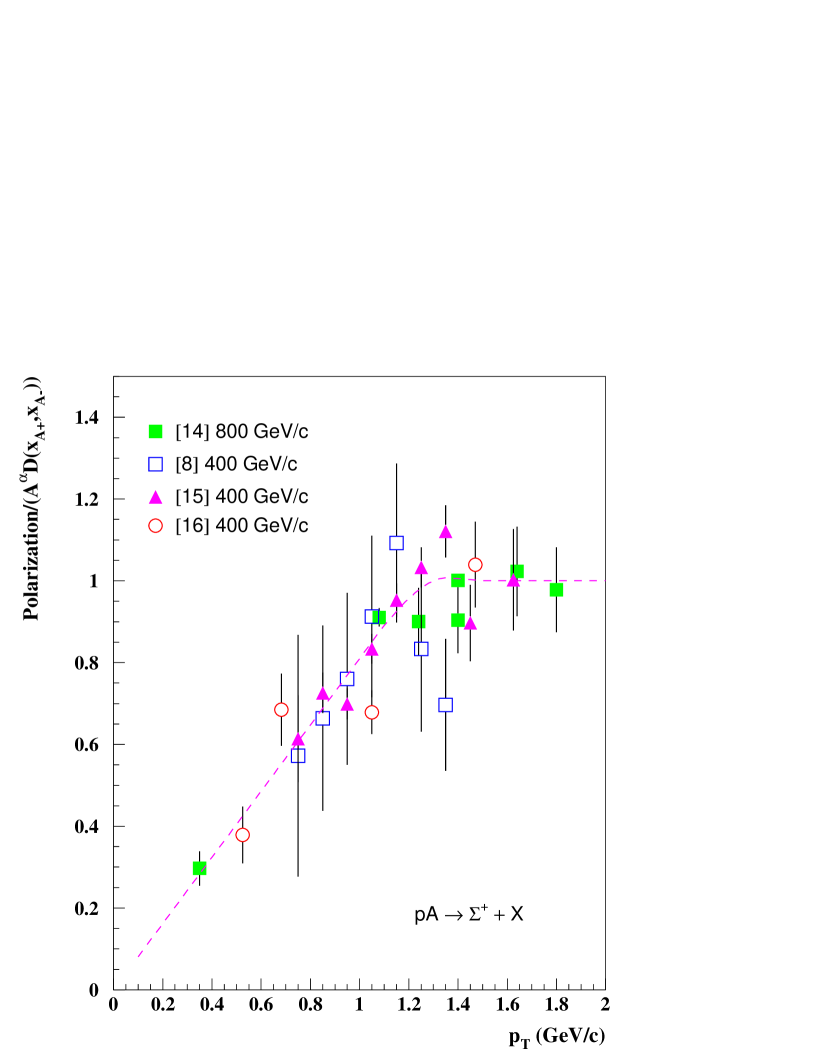
The polarization of hyperons () in collisions has been measured on a target at 800 GeV/c [14] and on a and a targets at 400 GeV [15, 16, 8]. A fit # 1 is made with some parameters fixed due to a limited data statistics. The parameter is compatible with the value of for the case of polarization discussed in the previous section. The fit # 2 is done with the value of , which follows from eq. (21).
The dependence of on is illustrated in Fig. 5, where a ratio of and is plotted. The curve corresponds to the function in eq. (19) with GeV/c (fit # 2). The function is well approximated by a linear dependence for GeV/c and a plateau for higher (see Fig. 5), but additional measurements are desirable for higher and different .
It was stated in [14] that the polarization at 800 GeV/c decreases as a function of at fixed . The results of the fit # 2 indicate that such unusual dependence is probably due to the dependence of the parameter in eq. (14). As we can see from eq. (16), the polarization (for ) is proportional to . Since and , the value of is about 0.09 for GeV/c, it starts to grow fast for GeV/c, and has a plateau for higher values. The value of in [14] is about 0.46, so and decreases with rise for GeV/c. This decrease of is not compensated by a corresponding increase of the , that leads to the observed polarization decrease with rise. If we take , such effect as a decrease of polarization with increasing is not expected. The results of three other polarization measurements, which have typical , do not reveal a decrease of with rise [15, 16, 8].
| Fit # | 1 | 2 | 3 | 4 |
|---|---|---|---|---|
| 4.41.0 | 4.00.9 | 4.22.5 | 4.24.2 | |
| 1.91.2 | 6.14.0 | 6.090 | ||
| 1.0 | 1.0 | 1.0 | 1.0 | |
| 1.210.07 | 1.240.06 | 0.66 | 0.66 | |
| -0.100.31 | 0.1070.059 | 0.25 | 0.250.20 | |
| -0.560.79 | -0.220.62 | 0.0 | 0.0 | |
| 4.77.5 | 519 | 0.0 | 0.0 | |
| 0.337 0.015 | 0.341 0.013 | 0.3070.058 | 0.310.11 | |
| 0.1720.054 | 0.1980.044 | 0.0 | 0.0 | |
| 0.820.28 | 0.980.20 | 0.0 | 0.0 | |
| -0.260.05 | -0.240.04 | -0.26 | -0.26 | |
| 33.0/17 | 33.6/18 | 0.06/3 | 0.06/3 |
| Fit # | 1 | 2 | 3 | 4 |
|---|---|---|---|---|
| -0.810.12 | -0.810.12 | -1.370.50 | -1.370.61 | |
| 5.950.74 | 6.090 | 6.090 | ||
| 1.0 | 1.0 | 1.0 | 1.0 | |
| 0.40.2 | 0.40.3 | 0.5 | 0.5 | |
| 0.290.11 | 0.2840.073 | 0.3360.023 | 0.3360.036 | |
| -0.0300.082 | -0.0330.060 | 0.0 | 0.0 | |
| 2 12 | 2.59.7 | 0.0 | 0.0 | |
| 0.000.22 | 0.020.13 | -0.2 | -0.200.15 | |
| 0.510.12 | 0.500.10 | 0.0 | 0.0 | |
| 3.01.9 | 2.91.5 | 0.0 | 0.0 | |
| 0.030.14 | 0.040.11 | -0.12 | -0.12 | |
| 71.0/46 | 71.0/47 | 5.7/13 | 5.7/13 |
It was also stated in [14] that an energy dependence of is observed by comparing the results at 800 GeV/c ( target) [14], at 400 GeV/c ( target) [15] and 400 GeV/c ( target) [16]. The observed difference is really due to the different targets ( vs ) and slightly different values used for this comparison. In the case of comparison of the data on and targets a strong -dependence is the reason of a higher polarization on the target, since (see fit # 1). For the data on target [16] the corresponding and , while the 800 GeV/c data are measured at and . The data [15] show that the increases by 0.05 or more, when is increased from 0.47 to 0.52. So, the expected for 800 GeV/c and is about , which is compatible with the measured value at 400 GeV/c.
The energy independence of the polarization is confirmed by Fig. 5, where all the data points at two beam energies and two different targets are approximated well by a single function and are compatible with the scaling law (10), described using and two scaling variables and .
The data fit indicates also that polarization decreases on a nuclear target (). The polarization attenuation is more significant at high values, similar to that of for the hyperons.
3.2 The hyperon polarization
The polarization of () has been measured at 400 GeV/c in [17] and [18] collisions. Since just a few points in and has been measured, some of the fit # 3 parameters are fixed, see Table 2. In addition, for the fit # 4 the parameter was fixed: . According to the fit the has a maximum near with corresponding .
3.3 The hyperon polarization
The polarization of () produced in has been measured at 28.5 GeV/c [5] and at 18.5 GeV/c [19]. Only two data points are available from these two experiments. At 28.5 GeV/c the value of is (, GeV/c ), and at 18.5 GeV/c it is (, GeV/c), which is consistent with the polarization in the same kinematic area.
3.4 The hyperon polarization
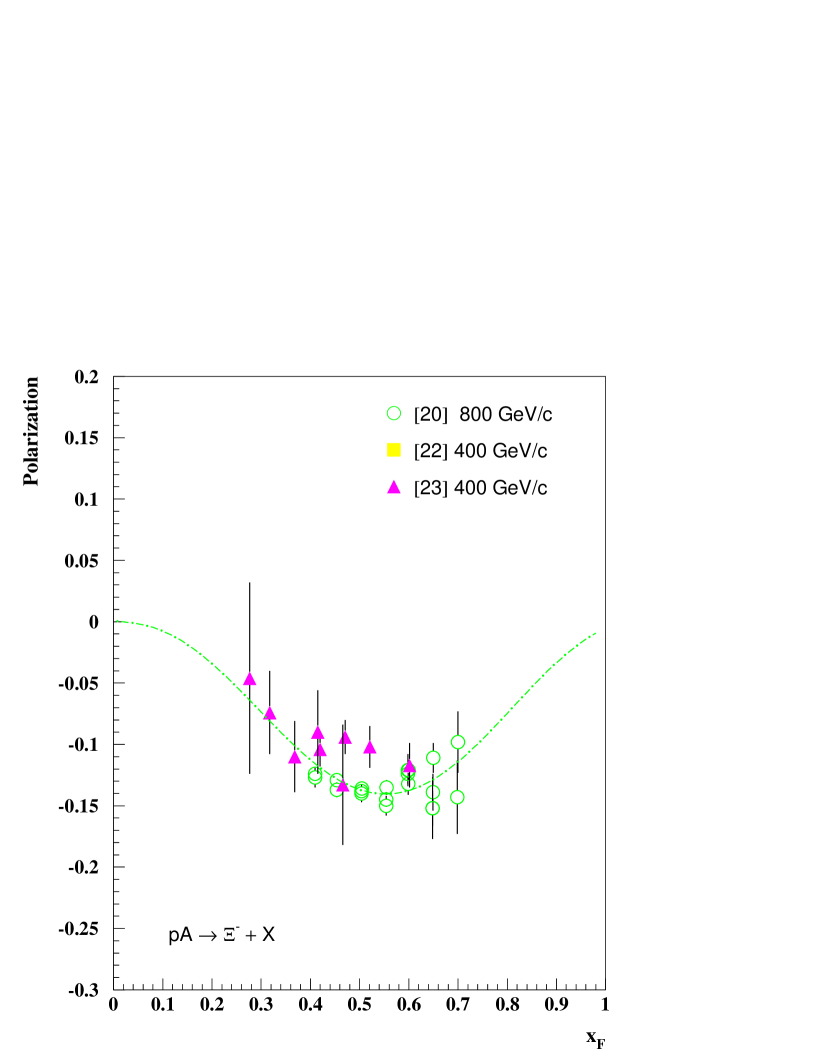
The polarization of () has been measured at 800 GeV/c in [20, 21] collisions, and at 400 GeV/c in [22] and [23] collisions. The fit # 1 is made with some parameters fixed. The value of parameter is . In the fit # 2 the is used and the corresponding curve is shown in Fig. 6 for 400 GeV/c collisions and GeV/c. The data shown in Fig. 6 have an additional cut GeV/c to reduce the smearing of the data points due to the dependence.
The fit # 2 and Fig. 6 data indicate a local maximum in the absolute value of polarization at .
The -dependence of the is not significant ().
3.5 The hyperon polarization
The polarization of () has been measured at 400 GeV/c in [9] collisions. The data are presented in Fig. 7 vs . Due to a small number of experimental points some of the fit parameters were fixed near the values which give the best . The fit # 3 is done with the free and the fit # 4 - with .
The fit # 4 and Fig. 7 data indicate a local maximum in the absolute value of polarization near .
The fits # 2 and # 4 indicate a possible decrease in the absolute value of and for due to a high value of . This feature makes these reactions different from the production in collisions, where we see a steady increase of polarization with rise.
An interesting observation follows from the analysis of the scaling properties of hyperon (, , and ) polarization in collisions - the parameter (“polarization oscillation frequency”) in eqs. (10)-(19), which describes the rate of change of the polarization with increase, is related with the number of sea quarks (), picked up from the sea during a hyperon production: .
4 Polarization of , and hyperons produced in collisions
In this section we analyze the hyperon polarization data in collisions. The corresponding fit parameters are presented in Table 4. Since the initial state () is not symmetric vs the rotation transformation and there are no measurements on nuclear targets, some modification of eqs. (10)-(19) is introduced. In particular, the parameters , are fixed at zero values, , and the factor in eq. (14) is omitted:
| (20) |
The function is given by eq. (19). The parameter in (10) could be different from unity due to an asymmetric initial state.
4.1 The polarization in collisions
The polarization of () hyperons in collisions has been measured at 176 GeV/c [7], at 32 GeV/c [24], at 14.3 GeV/c [25, 26], and at 10 and 16 GeV/c [27]. The data with lower beam momenta are not used for this analysis due to the energy dependence of the polarization below 9 GeV/c at fixed negative [24, 25, 26, 28]. The interesting feature of these beam data is that they include both, the beam and the target fragmentation regions. That feature allows us to estimate the parameter in eq. (10) and check that the scaling behaviour is valid for both hemispheres.
Only the data with are used for this analysis to avoid a large contribution of exclusive channels near the kinematic limits.
The data fits (# 1 and # 2) have been performed with some parameters fixed due to a limited statistics. In the fit # 1 the parameter is free, and in the fit # 2 its value is fixed at . Both fits have about 1.6 and indicate the maximum near and almost -independent polarization for the negative region. The parameter is in contrast to the data.
The dependence of the is compatible with a linear rise of the (see eq. (19)) for GeV/c.
| Fit # | 1 | 2 | 3 | 4 |
|---|---|---|---|---|
| 4.18 0.47 | 4.250.37 | 6.02.8 | 6.82.7 | |
| 3.53 0.22 | 3.58 | 3.040.88 | 3.58 | |
| -0.77 0.12 | -0.77 0.11 | -0.900.67 | -1.090.51 | |
| 1.0 | 1.0 | 1.0 | 1.0 | |
| 0.0760.019 | 0.0790.016 | 0.1270.049 | 0.1420.038 | |
| 0.81 0.21 | 0.80 0.20 | -0.01 0.13 | -0.0460.065 | |
| 26 | 26 | 26 | 26 | |
| 0.1910.063 | 0.190.06 | 0.060.16 | 0.090.08 | |
| 0.18 0.13 | 0.19 0.11 | -0.420.22 | -0.340.12 | |
| 7 | 7 | 27 | 27 | |
| 88.8/55 | 88.9/56 | 12.9/11 | 13.3/12 |
4.2 The polarization in collisions
The polarization of () hyperons in has been studied at 5 GeV/c [29] and at 4.2 GeV/c [30]. Since the polarization in [29] is integrated over one of the variables ( or ), we have to assign mean values for these integrated variables. As estimates of these mean values we take for the analysis , and GeV/c, respectively. Only data with are used for the analysis to exclude the resonance region, in particular in the extreme forward region () which is dominated by the baryon exchange process . The fit # 3 is made with the parameter free, and the fit # 4 is made for . As in the case of the polarization the parameter is negative, but with a much larger uncertainty.
Additional measurements are desirable for GeV/c where polarization could reach high values. Both, the and the dependencies of are similar to the case of the polarization in collisions.
4.3 The polarization in collisions
The polarization in collisions has been measured at 32 GeV/c [24]. Since just two points are available, only the magnitude of polarization is estimated which is about 0.4.
5 Hyperon polarization in collisions
The hyperon polarization data for collisions have been analyzed using eqs. (10)- (20). Only the data with are used for the analysis. The fit parameters are presented in Table 5.
5.1 The polarization in collisions
5.2 The polarization in collisions
The polarization in collisions has been measured at 32 and 70 GeV/c [33], at 8.2 and 16 GeV/c [31], at 32 GeV/c [24], and at 13 GeV/c [32]. The data [33] for 32 and 70 GeV/c are combined for this analysis and an average momentum 50 GeV/c is assigned to it. The fit # 3 and the fit # 4 have been performed with parameter free and fixed (), respectively. The fits result in a negative , similar to the case. The fits indicate the existence of significant phases and , which depend on . The hyperon polarization observed in this reaction is higher than in any other one.
| Fit # | 1 | 2 | 3 | 4 |
|---|---|---|---|---|
| -3.0 1.9 | -2.41.3 | 3.41.1 | 3.91.0 | |
| 4.4 1.5 | 3.58 | 4.41.9 | 5.55 | |
| 0.30 0.18 | 0.36 0.28 | -1.240.39 | -1.400.28 | |
| 0.4 | 0.4 | 0.4 | 0.4 | |
| -0.19 0.13 | -0.210.13 | 0.120.07 | 0.1300.049 | |
| 0.0 | 0.0 | 0.240.35 | 0.290.30 | |
| 0.0 | 0.0 | 1728 | 1720 | |
| -0.53 0.31 | -0.730.24 | 0.410.22 | 0.420.16 | |
| 0.0 | 0.0 | 0.540.32 | 0.530.17 | |
| 0.0 | 0.0 | 5.75.7 | 4.32.7 | |
| 9.6/12 | 9.8/13 | 12.4/19 | 13.0/20 |
6 The polarization in and collisions
The hyperon polarization data for collisions have been analyzed using eqs. (10)- (20). The fit parameters are presented in Table 6. A cut is used to reduce exclusive reaction contributions.
6.1 The polarization in collisions
The polarization in collisions has been measured at 3.95 GeV/c [34], at 6 GeV/c [35], at 15 GeV/c [36], at 16.1 GeV/c [37] and at 18.5 GeV/c [38]. The fit # 1 is made with the parameter free and the fit # 2 is performed with the . The polarization is positive in the target fragmentation region and is negative or near zero for positive .
6.2 The polarization in collisions
The polarization in collisions has been measured at 18.5 GeV/c [38]. The fit # 3 is made with the parameter free and the fit # 4 is made with the .
The polarization magnitude for hyperons produced in collisions is smaller than it is in the collisions.
| Fit # | 1 | 2 | 3 | 4 |
|---|---|---|---|---|
| -1.8 0.5 | -1.70.6 | -2.22.2 | -2.52.9 | |
| 4.33 0.94 | 3.58 | 5.26.5 | 3.58 | |
| 1.0 | 1.0 | 1.5 | 1.5 | |
| 1.0 | 1.0 | 1.0 | 1.0 | |
| 0.564 0.088 | 0.6320.081 | 0.450.46 | 0.640.10 | |
| 2.02.1 | 2.5 1.0 | 0.0 | 0.0 | |
| 5035 | 4916 | 0.0 | 0.0 | |
| 0.2760.044 | 0.2640.048 | -0.140.70 | -0.350.23 | |
| 0.45 0.47 | 0.50 0.43 | 0.9 | 0.9 | |
| 1211 | 1311 | 1.0 | 1.0 | |
| 20.9/19 | 21.2/20 | 0.40/3 | 0.42/4 |
7 Polarization of antihyperons produced using baryon and antibaryon beams
The reactions presented in this section can be considered as exotic ones due to a very unusual behaviour of the corresponding polarization with the rise of scaling variables. This behaviour cannot be predicted by the existing models. Most of the theoretical models predict zero polarization for antihyperon production in collision since they do not have valence quarks common with the beam or target hadrons. The recent experiments have revealed non-zero polarization for [21] and [14] hyperons. Other antihyperons also indicate non-zero polarizations with small but not negligible magnitudes.
The fit parameters are presented in Table 7. The parameter in eq. (10) is set to zero due to a limited statistics and too few used targets.
7.1 Polarization of in collisions
Although the magnitude of the polarization is very low (), the fit indicates an oscillation of the polarization as a function of with good . The data fits have been performed for parameter free (fit # 1) and (fit # 2). Due to a limited statistics and kinematic range of the data, the parameter is fixed at the same value (0.31) as it is for polarization in collisions. As we will see below the large value of is typical for such exotic process () which corresponds to the exchange, where is a baryon number.
7.2 Polarization of in collisions
The polarization have been measured at 800 GeV/c in collisions of a proton beam with a target [21]. The data fit has been performed (fit # 3), which follows from eq. (21). At the same time this value of is a minimal one which describes the unusual polarization dependence on with the middle point closer to zero than the other ones. The fit function indicates that polarization magnitude could be about 0.18. If such an unusual behaviour will be confirmed by future experiments that reaction will be a large challenge to the strong interaction theory. Much more data are desirable since we have only 3 data points for this reaction.
7.3 The polarization in collisions
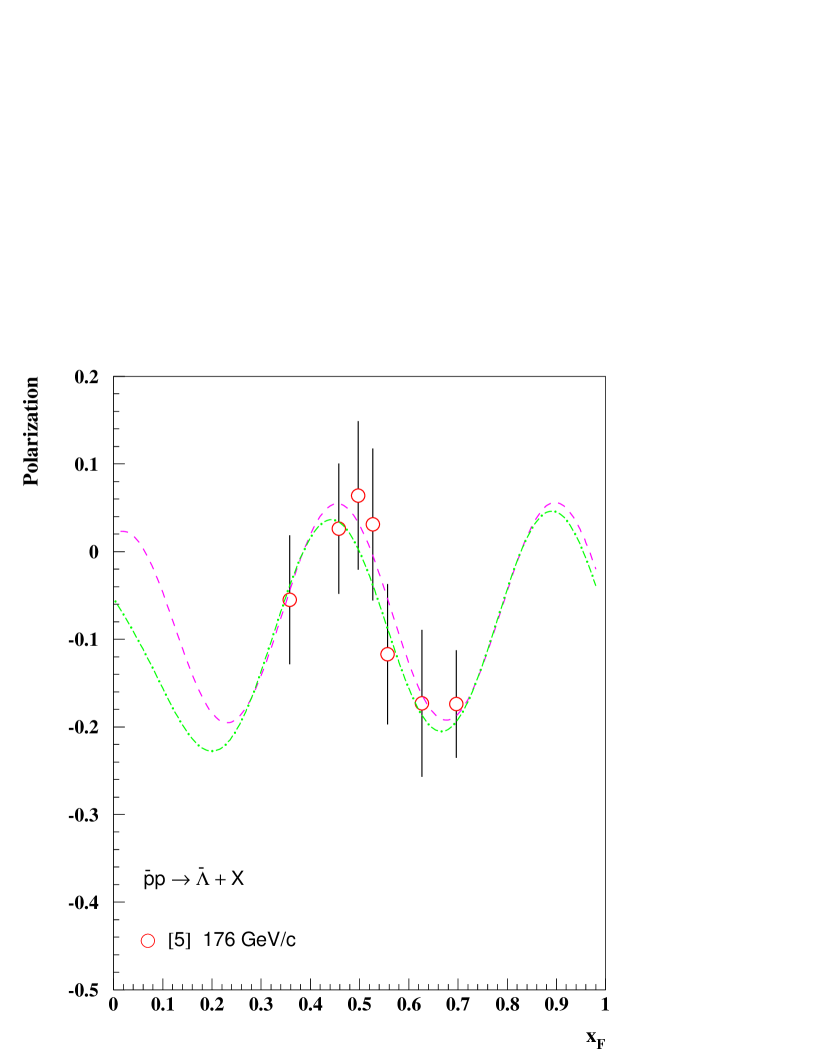
The polarization of () hyperons in collisions has been studied at 176 GeV/c [7]. The fit # 4 is made with parameter free, and the fit # 5 is made for . The dependence of on is shown in Fig. 8 along with fit # 5 predictions for GeV/c and GeV/c, respectively. The predictions are made for 176 GeV/c collisions. Both fits indicate local maximums of at and at and an oscillation of as a function of (). An interesting feature of the data is that almost a full period of the oscillations is covered by the data. This observation needs additional conformation in different kinematic regions due to a limited statistics and the kinematic range covered by the data. Additional measurements are desirable to clarify the dependence of the .
The large values of have been found also for and for reactions considered above. The dependence of the parameter on quantum numbers of the hadrons participating in the reaction will be discussed in details below.
| Fit # | 1 | 2 | 3 | 4 | 5 |
|---|---|---|---|---|---|
| -0.47 0.23 | -0.490.22 | -1612 | 4.52.9 | 3.51.2 | |
| 18.5 5.7 | 65.19 | 16.24.1 | |||
| 1 | 1 | 1 | -1 | -1 | |
| 0.34 | 0.34 | 0.4 | 0.60.9 | 0.40.6 | |
| 0.1850.029 | 0.1740.015 | 0.0450.007 | 0.0710.061 | 0.0420.016 | |
| 0.31 | 0.31 | 0.0 | 0.0 | 0.0 | |
| 3.71.9 | 4.31.1 | 0.0 | 0.0 | 0.0 | |
| 0.309 0.072 | 0.322 0.077 | 0.1810.007 | 0.2940.020 | 0.3030.021 | |
| 0.070.15 | 0.10 0.16 | 0.0 | 0.0 | 0.0 | |
| 1.27 | 1.27 | 0.0 | 0.0 | 0.0 | |
| 12.9/16 | 13.3/17 | 0.00/0 | 0.74/2 | 1.08/3 |
7.4 Polarization of in collisions
The polarization has been measured in the collisions at 800 GeV/c [14]. The fit was not made since only four data points have been measured at fixed . The sign of polarization is positive and its magnitude is about .
8 Polarization of and in collisions of hyperons and protons with nuclei
In this section we analyze the polarization of and hyperons produced by a neutral unpolarized beam containing hyperons and the polarization produced by beam. In addition, the and the proton polarizations in collisions are analyzed and compared with the hyperon polarization in different reactions. The parameter in eq. (10) is set to zero due to a limited number of used targets and statistics.
8.1 Polarization of in collisions of and with target
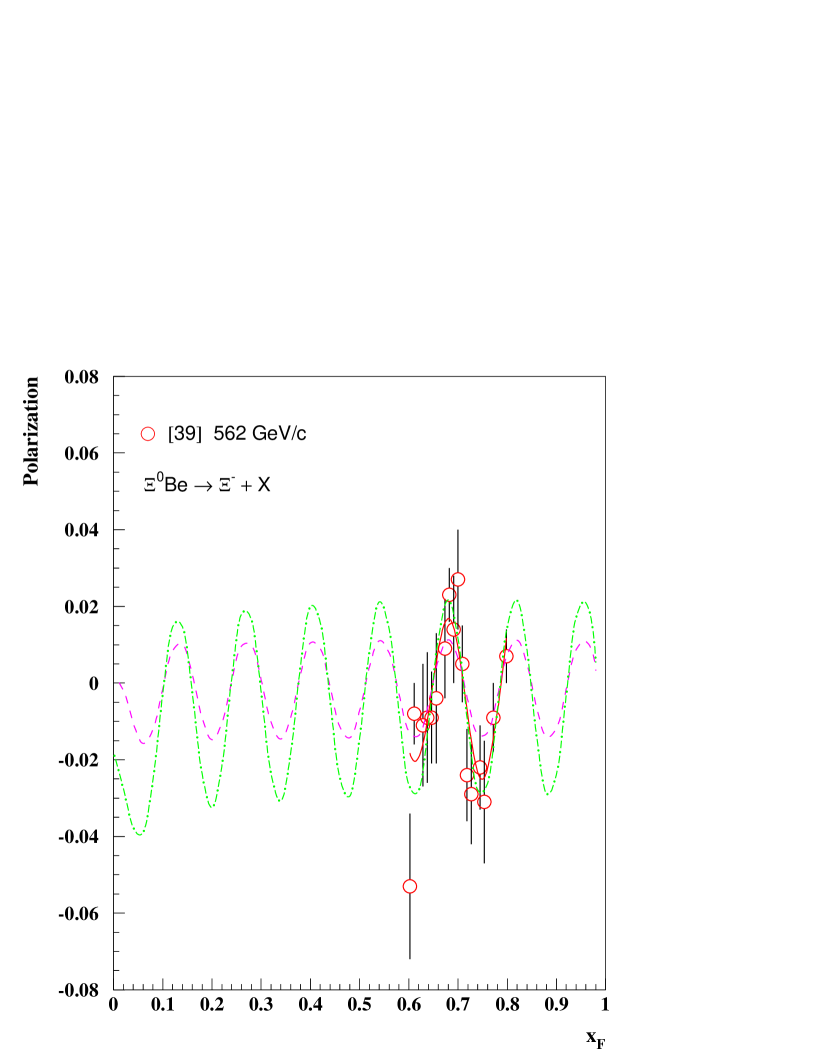
In this subsection we consider the data on polarization which have been measured using a neutral unpolarized high energy beam containing and hyperons [39]. The primary 800 GeV/c proton beam was used to produce a neutral strangeness containing beam, which in its turn interacted with a target. The average momentum of produced and hyperons was about 395 GeV/c. This value of momentum was used to estimate the momentum of the neutral beam. It is assumed in this analysis that the ratio () of the neutral beam momentum to the 800 GeV/c primary momentum is the same as the ratio of momentum to the neutral beam momentum. These relations give and the neutral beam momentum about GeV/c. Using this assumption we performed a fit of the data [39]. The fit parameters are presented in Table 8.
The polarization of was fitted with parameter free (fit # 1) and with (fit # 2). The dependence of polarization is shown in Fig. 9 along with the fit # 2 predictions for GeV/c and GeV/c. Though the magnitude of polarization () is about 0.026 only, a clear dependence is seen, which is consistent with the oscillation behaviour, predicted by eqs. (10)-(20). The frequency parameter is very large and more than a full period of oscillation is seen in Fig. 9.
8.2 Polarization of in collisions of and with target
The polarization has been measured using unpolarized neutral beam described in the previous subsection [39]. The polarization of was fitted with (fit # 3). The magnitude of polarization is about 0.11.
8.3 Polarization of in collisions
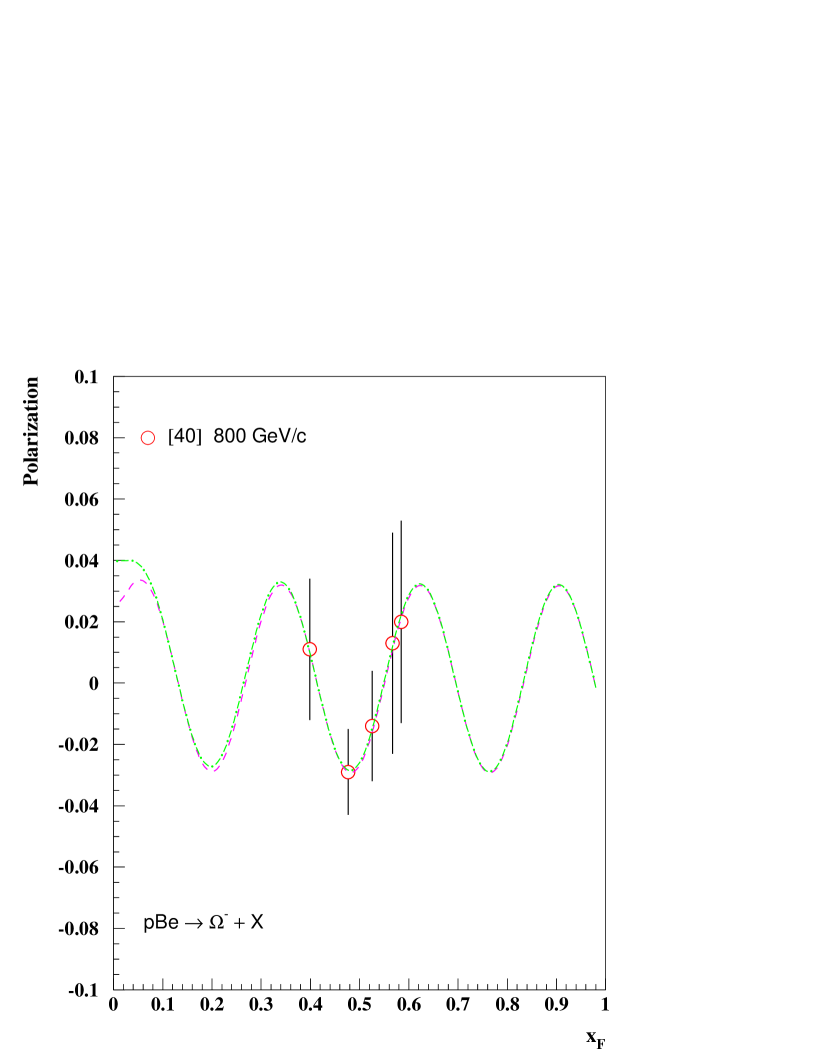
The polarization has been measured using 800 GeV/c collisions for and GeV/c [40]. The mean value of polarization in this kinematic range is , but the dependence of it on clearly indicates its oscillation as a function of (see Fig. 10). The fit # 4 is performed (see Table 8) with parameter fixed at 22.27 as is predicted by eq. (21). It has to be mentioned that this large value of was estimated using the other reactions and at the same time it is quite consistent with the observed dependence for the reaction. The magnitude of polarization oscillation is about .
| Fit # | 1 | 2 | 3 | 4 |
|---|---|---|---|---|
| 2.37 0.44 | 2.370.42 | 2.64.1 | 1.360.69 | |
| 46.0 3.7 | 22.27 | |||
| -1.0 | -1.0 | -1.0 | 1.0 | |
| 1.0 | 1.0 | 1.0 | 0.39 | |
| 0.1510.017 | 0.1510.003 | 0.240.10 | 0.0640.012 | |
| 0.0 | 0.0 | 0.0 | 0.0 | |
| 0.0 | 0.0 | 0.0 | 0.0 | |
| 0.0850.023 | 0.0850.002 | 0.140.03 | 0.3720.026 | |
| 0.0 | 0.0 | 0.0 | 0.0 | |
| 0.0 | 0.0 | 0.0 | 0.0 | |
| 13.75/13 | 13.75/14 | 0.04/1 | 0.01/2 |
8.4 Polarization of in collisions of with target
The polarization of has been measured using 330 GeV/c beam on Carbon and Copper targets [41]. The polarization of for a sample, combining the and the target measurements, was fitted with free parameter (fit # 1) and with (fit # 2). The fit parameters are presented in Table 9. The polarization is negative and its magnitude is about 0.4.
| Fit # | 1 | 2 | 3 | 4 |
|---|---|---|---|---|
| -1.530.56 | -1.510.48 | 0.74 0.14 | 0.730.10 | |
| 3.33.5 | 6.12 0.21 | 6.090 | ||
| 0.870.27 | 0.880.23 | 1.0 | 1.0 | |
| 1.0 | 1.0 | 0.4 | 0.4 | |
| -0.410.51 | -0.4460.042 | 0.647 0.014 | 0.6480.012 | |
| -0.200.28 | -0.210.29 | 0.2040.045 | 0.2050.045 | |
| 4.6 | 4.6 | 1.75 | 1.75 | |
| 0.840.71 | 0.880.23 | 1.4740.089 | 1.4760.090 | |
| 0.710.78 | 0.750.34 | 1.75 | 1.75 | |
| 1.3 | 1.3 | 1.75 | 1.75 | |
| 10.7/17 | 10.7/18 | 35.9/31 | 35.9/32 |
8.5 The proton polarization in collisions
It is interesting to compare the hyperon polarization data with the proton polarization data in collisions. The data have been measured at 100, 200, 300 and 400 GeV/c in collisions of a proton beam with protons and a Carbon target [42]. The data fits have been performed for parameter free (fit # 3) and (fit # 4). The value of is consistent with the corresponding values of for reactions, indicating a similar mechanism for the polarization origin. The dependence of the polarization is mainly due to a significant dependence of the phases and . The data are consistent with the scaling described by eq. (10) with given by eq. (19).
9 Dependence of the hyperon polarization on quantum numbers
There is a very interesting feature of the hyperon polarization, related with the value of the parameter in eqs. (10)-(14). The results of the data fits indicate (see Table 10) that for the hyperon and antihyperon production in , , , , , and collisions the parameter depends on flavors of the projectile, the produced hyperon and the target. It can be expressed for the reaction using the formula
| (21) |
where depends on the quark content of hadrons participating in the reaction, and are fit parameters. In particular,
| (22) |
| (23) |
| (24) |
| (25) |
| (26) |
where
| (27) |
and
| (28) |
In the above formulas is the minimal number of quarks in the system ( pairs of the same flavor are cancelled, see quark diagram in Fig. 11). The denotes additional (extra) quarks and antiquarks, produced in a process above the minimal level when a higher order quark level diagram is used, as in the case of the process . In the last mentioned process , and we assume that the inclusive protons are produced via a single valence quark fragmentation. So, four additional quarks and antiquarks are produced in this process, similar to the case of process, shown in Fig. 11. For all other processes presented in Table 10 the and . The sum can also be considered as the number of spectator quarks in a process .
We may conclude from the analysis of 22 reactions presented in Table 10 that non-zero number of spectator quark is always needed (which means quark exchange diagram) to generate a non-zero baryon polarization.
The is the net number of quarks or antiquarks in the system. The and are the baryon numbers of the and the systems, respectively. The , and are the corresponding baryon numbers, and is the number of quarks in a produced hadron .
The value is used in the Constituent Interchange model (CIM) [52] which predicts a cross section at of the form
| (29) |
The first term of eq. (21) contributes to the processes , where means baryon ( reactions # 1 - # 5), the second one takes into account the specific properties of the meson induced reactions # 6 - # 12, the third term is important for the antibaryon production, the takes into account very high “oscillation frequency” data for the (anti)hyperons, containing quarks when the beam hadron has () quarks (see reactions # 15-16).
The term is introduced to take into account the reactions , for which all other terms are zero. The preliminary analysis of analyzing power for these reactions gives (see also [47]). A detailed study of the meson induced reactions will be made in a separate paper.
The reactions in the Table 10 can be classified according to the set of values. The most simple is the case of baryon production in collisions when only the term is non-zero and the is related with the number of spectator quarks as is illustrated by a quark diagram in Fig. 11. We may suggest that the mean colour field created by the spectator quarks in these reactions is the reason of polarization oscillation as a function of .
The values presented in Table 10 were fitted using eq. (21) and the parameters are shown in Table 11. The reactions #11,15,18 and 20-22 were not used in the fit, since they have too few data points.
If the inclusive protons are produced via the single beam quark fragmentation similar to the reaction # 2, then for the number of spectator quarks the predicted value is in a good agreement with the estimated value .
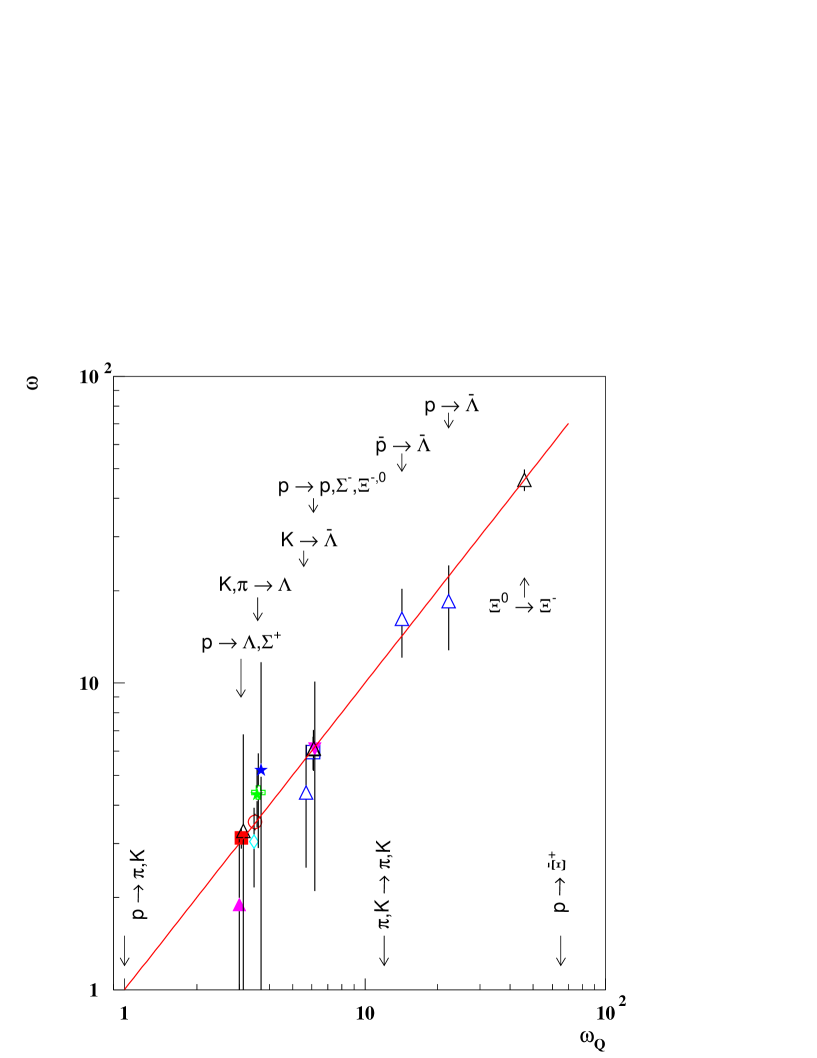
The dependence of the parameter vs is shown in Fig. 12 for 15 different reactions, presented in Table 10. The arrows indicate also the predictions of the for the analyzing power in the reactions , in the reactions , and for polarization in the reaction .
| # | reaction | ||||||||
|---|---|---|---|---|---|---|---|---|---|
| 1 | 2 | 0 | 0 | 0 | 3.130.24 | 3.045 | -0.2720.011 | -0.275 | |
| 2 | 4 | 0 | 0 | 0 | 6.100.92 | 6.090 | -0.1410.052 | -0.138 | |
| 3 | 4 | 0 | 0 | 0 | 5.950.74 | 6.090 | -0.1400.021 | -0.138 | |
| 4 | 2 | 0 | 0 | 0 | 1.91.2 | 3.045 | 0.3370.076 | 0.275 | |
| 5 | 4 | 0 | 0 | 0 | 4.0 | 6.090 | 0.340.26 | 0.275 | |
| 6 | 3 | -1 | 0 | 0 | 0.22 | 3.58 | 0.610.11 | 0.604 | |
| 7 | 3 | -1 | 0 | 0 | 0.88 | 3.58 | 0.530.17 | 0.604 | |
| 8 | 3 | -1 | 0 | 0 | 1.5 | 3.58 | 0.15 | -0.052 | |
| 9 | 3 | -1 | 0 | 0 | 0.94 | 3.58 | 0.14 | -0.178 | |
| 10 | 3 | -1 | 0 | 0 | 6.5 | 3.58 | 0.17 | -0.178 | |
| 11 | 3 | 1 | 0 | 0 | 5.55 | 0.40.4 | 0.302 | ||
| 12 | 3 | 1 | 0 | 0 | 1.9 | 5.55 | 0.780.25 | 0.604 | |
| 13 | 6 | 2 | 2 | 0 | 5.7 | 22.27 | 0.010 | -0.025 | |
| 14 | 2 | 0 | 2 | 0 | 16.24.1 | 14.21 | 0.046 | 0.194 | |
| 15 | 6 | 2 | 2 | 1 | 65.19 | 0.03 | -0.188 | ||
| 16 | 2 | 0 | 0 | 1 | 46.03.7 | 45.97 | 0.005 | 0.022 | |
| 17 | 2 | 0 | 0 | 0 | 3.33.5 | 3.045 | -0.40.4 | -0.275 | |
| 18 | 4 | 0 | 0 | 0 | 6.090 | 0.1110.067 | 0.132 | ||
| 19 | 4 | 0 | 0 | 0 | 6.120.21 | 6.090 | 0.014 | 0.072 | |
| 20 | 6 | 2 | 2 | 0 | 22.27 | 0.0320.016 | 0.031 | ||
| 21 | 6 | 2 | 2 | 0 | 22.27 | 0.0880.011 | 0.092 | ||
| 22 | 2 | 0 | 0 | 0 | 3.045 | 0.280.13 | 0.275 |
The line in Fig. 12 shows the result of the fit with and . This figure confirms a strong correlation of the parameter with the quantum numbers which characterize the reaction.
The magnitude of hyperon polarization () varies significantly with the hyperon, the projectile and the target flavors and the target atomic weight. The values of for different reactions were estimated for , where most of the data have been measured, using eqs. (10)-(20) and fit parameters, taken from Tables 1-9. The sign of the is indicated the same as that for the experimental data if it does not vary in the mentioned above region, and - otherwise. The results are presented in Table 10 for 22 different reactions.
It is easy to notice from Table 10 that there is a correlation between the value of and the parameter for the corresponding reactions. The product of these two values, varies much less than each value separately.
| 1.5230.045 | 0.980.24 | 5.61.70 | 43.03.7 | 3.57/12 | |
| 0.700.19 | 0.5450.066 | 4.940.73 | 11.61.5 | -4.730.74 | 5.5/16 |
The parameter was found to be consistent with
| (30) |
where
| (31) |
where , , and are hypercharges () of , , and strangeness change, respectively. The is the number of quarks with parallel spins in the hadron . It is assumed here, in accordance with the quark model [45, 54], that for the , for the , , protons, neutrons, and for the .
The magnitude of the polarization can be approximated by
| (32) |
where the value of is given by eq.
| (33) |
where
| (34) |
| (35) |
| (36) |
| (37) |
| (38) |
The and are the fit parameters, shown in Table 11.
The fit of using (the sign of was not taken into account) was made for the reactions # 1 - # 22. The values of are presented in Table 10 with the sign in the region given by eq. (32).
The magnitude of polarization in the reaction is , see eq. (32). For the and hyperon production in collisions the magnitude of polarization is due to the factor in eq. (31).
The parameter was found to be consistent with an approximation
| (39) |
where GeV/c.
Eqs. (21) and (32) should have their explanations in the models of strong interaction and ultimately in the QCD, perhaps, in the non-pertubative approach.
The value of parameter can also be estimated for the processes in which the analyzing power is measured. That requires additional precise measurements in a wide range of in a kinematic area where the scaling is fulfilled ( 1 GeV/c and/or the beam energy GeV). The reactions with meson beams are of special interest because of a high value of the parameter and a possibility of “oscillation” of the analyzing power as a function of (compare Figs. 8- 10 and the preliminary results in [47]).
If we assume that eqs. (10)-(21) are valid also for the analyzing power , we can make predictions of the for different reactions.
In particular, we expect for the , , , , , production in and collisions; for the production in collisions; for the proton production in collisions, for , and for the antiproton and production in collisions. These predictions include about two tens different reactions and a preliminary analysis confirms these predictions. We may conclude that eq. (21) has a high predictive power which allows one to predict the parameter for about four tens different spin-dependent processes. It is highly unlikely that the value in so many different processes is described by the same eq. (21) for accidental reasons. Moreover, within the experimental errors we may fix two out of five parameters: , and .
Eq. (21) also predicts that in some cases a target particle plays a significant role in the dynamics of a hyperon production. This is the case when the baryon number and are different from zero.
The scaling behaviour of the and indicates that the corresponding processes take place at the quark or parton level. In case of the discussed above scaling for the analyzing power and for the hyperon polarization such constituents could be the constituent quarks or the current quarks (see related discussion in [55]). In order to resolve quark degrees of freedom inside a hadron, the transverse momentum in a process should be higher than . That could be the reason for the dependence of polarization (19).
10 Discussion
The results of the previous sections indicate that the use of two scaling variables is essential for the universal energy independent description of the existing hyperon polarization data in inclusive reactions. The scaling variables transform into each other under rotation transformation around the normal to the scattering plane and allow one to satisfy in a natural way the feature (5), which is also related with the rotation invariance. The variables treat on a more equal basis the data for the central and the fragmentation regions as well as the transverse and the longitudinal momentum components of the produced hyperon.
The form of eq. (10) is chosen from the dimensional analysis, the rotation invariance requirement and it is also motivated by the existing data for both the hyperon polarization and the analyzing power in inclusive reactions for hadron-hadron collisions. The derived formulas are applicable for both the and the data approximation and reflect the scaling properties of these two classes of processes at high enough energies and . The specific range of energies and at which the scaling properties are valid could depend on the process type. The existence of the above scaling implies that large spin effects will survive at high energies and do not depend directly on the beam energy. These properties of the and the are waiting for their explanation in the strong interaction theory in general and in the Quantum Chromodynamics (QCD) in particular.
10.1 Analogy between the scaling properties of hyperon polarization and the analyzing power
It is important to take into account in the future models a deep analogy between the hyperon polarization and the analyzing power, which follows from the results of this study and [47, 48, 49]. Below we list some common features of the and the , which indicate a common nature of both phenomena.
Features of the analyzing power in inclusive hadron production by polarized protons and antiprotons and features of the hyperon polarization in inclusive hadron-nucleon collisions:
-
a)
Scaling behaviour for the hyperon polarization and the analyzing power as a function of and in the beam fragmentation region, and in the central region.
-
b)
The and the are approximated by a product of functions of and : , where the could depend on and a reaction type.
-
c)
The function rises with at small and have a plateau or decrease above , where 0.4-2 GeV/c depends on a reaction type.
-
d)
The function is proportional to , where could depend on . The is a universal function of quantum numbers characterizing the reaction, common for the and .
-
e)
The and the are zero at = 0 due to the absence of a preferable direction, such as a normal to the scattering plane. This implies .
-
f)
The sign and the magnitude of the and the depend on the projectile, the target, and the produced hadron flavors.
We may conclude that a close similarity of the kinematic behaviour of and and a universal dependence of the parameter on quantum numbers indicate on a common origin of spin effects in these two classes of spin-dependent reactions.
10.2 Interference origin of the hyperon polarization
The polarization of hadrons is a pure Quantum mechanics effect related with the interference of spin-flip () and spin-nonflip () amplitudes. The transverse hadron polarization can be expressed via the and amplitudes as [56]
| (40) |
Taking into account eqs. (10)- (12) we can choose amplitudes and as
| (41) |
| (42) |
where and are the functions of kinematic variables (, , ) with zero relative phases, which have to satisfy the constrains followed from both the polarization and the cross section data. The generalized optical theorem predicts the following relation for a cross section:
| (43) |
where is the corresponding unpolarized inclusive cross section [46], which can be used together with eq. (40) to fix the and .
To have a non-zero value of the both amplitudes have to be non-zero and the phase difference between spin-flip and spin-nonflip amplitudes has to be non-zero too. For the cases of the following phase differences are expected from eqs. (41)-(42):
| (44) |
As we can see from eq. (44), the variables and play an important role in the hyperon polarization phenomena since they determinate the phase difference between the spin-flip and non-flip amplitudes. The higher is the value, the larger the change rate with the increase. Eq. (21) for can be considered as a sum of effective “charges”, which create a mean field and lead to the change of the phase difference .
In the lowest-order pertubative all amplitudes are relatively real. This tends to rule out polarization in the hard scattering of partons, which seems to be well described in the low-order . The observation of undiminished polarization near GeV/c implies that either pertubative does not apply or that another mechanism is responsible, such as interference of exited states or the fragmentation process [11].
10.3 Some theoretical ideas for hyperon polarization
Several phenomenological models have been proposed to explain the hyperon polarization data and the analyzing power data (see recent review in [46]). Some of the models have the features that allow one to understand, at least at a qualitative level, the analogy between the and the discussed above.
10.3.1 Orbital motion of valence quarks
One class of such models assumes that an orbital motion of valence quarks and surface effects are responsible for the correlation between the quark spin direction and transverse motion of produced hadron [49, 55]. By taking the ’s containing two, one or zero valence quark(s) of a beam proton into account, the model predicts the sign and the dependence of ’s polarization. The model predicts correctly the sign and the magnitude of , polarization in collisions, and polarization in collisions. It also predicts a smaller magnitude for ’s produced by beams. The authors of the model claim an analogy of mechanisms, which lead to non-zero hyperon polarization and analyzing power. The model does not explain the specific features of antihyperon polarization.
10.3.2 Parton rotation inside constituent quarks
A separate approach was developed by Troshin and Tyurin, which assumes the rotation of a quark-antiquark cloud inside constituent quarks [57, 58]. The main role belongs to the orbital angular momentum and polarization of the strange quark-antiquark pairs in the internal structure of constituent quarks. The hyperons are produced in two stages. At the first stage the overlapping and interaction of peripheral clouds occur which results in massive quark appearance and a mean field is generated. Constituent quarks located in the central part of hadron are supposed to scatter in a quasi-independent way by this mean field. At the second stage two mechanisms take place: Recombination of the constituent quarks with a virtual massive strange quark (soft interaction) into a hyperon or a scattering of a constituent quark in the mean field, excitation of this constituent quark, appearance of a strange quark as a result of decay of the constituent quark and a subsequent fragmentation of a strange quark into a hyperon (high ’s hard interaction). The resulting expression at GeV/c when hard interactions dominate is
| (45) |
where is the polarization of the constituent quark which arises due to multiple scattering in the mean field and is the mean value of an internal angular momentum inside the constituent quark.
Thus, in this model the polarization of a strange quark is the result of multiple scattering of a parent constituent quark, the correlation between the polarization of a strange quark and the polarization of the constituent quark and a local compensation of a spin and an orbital angular momentum of a strange quark.
The simplest possible dependence of is taken
| (46) |
where .
The model predicts the negative sign and dependence of the polarization. Eq. (45) resembles eq. (12), especially in the beam fragmentation region, with effective . Eqs. (45), (46) predicts a scaling behaviour of the hyperon polarization. The concept of the mean field, generated by quarks, which leads to a hyperon polarization and to its change with rise similar to eq. 12 is also in consent with the analysis, presented above.
There are no predictions for other hyperons, though the authors assume zero polarization in inclusive process due to a low probability of multiple scattering in the mean field in comparison with a single scattering. A single scattering does not polarize quarks and protons appear unpolarized in the final state since a single scattering is dominant in this process.
There are several semiclassical models, which provide simple arguments for a qualitative description of the hyperon polarization, but since they fully ignore the relevance of the phase difference, which is crucial, they are unable to make solid quantitative predictions.
10.3.3 The recombination model
In the recombination model [59, 60] a dynamical reason for the spin-momentum correlation is explained by the effect of Thomas precession [61, 62]. The effect arises when the direction of the force acting on a quark does not coincide with the direction of its motion. It leads to a rotation of the quark spin and could be the reason of the discussed above “oscillation” of polarization or analyzing power as a function of . The Thomas frequency is an inverse function of a quark mass
| (47) |
where is the strange quark velocity, - the force, - the strange quark mass, and . An additional term will appear in the effective Hamiltonian which describes the recombination process
| (48) |
where is a spin of the quark. Within the old-fashioned perturbation theory the final expression for the polarization is
| (49) |
where it is assumed that a recombination time , the average momentum of the quark is and GeV-1 is a distance scale of the order of the proton radius. The GeV/c2 is an effective mass and the is a fraction of a proton momentum () which carries the quark [59]. These assumptions lead to a quark mass cancellation in the polarization formula (49) and a scaling behaviour of the polarization. The model gives the right sign and a good approximation of the dependence for the polarization. There are also many predictions for hyperon polarization in other reactions. They are based on some rules which are formulated within the framework of the recombination model. In particular, there is a statement that the effect of recombination of the partons in the proton as they are transferred into the outgoing hadron may be different depending on whether they are accelerated (as are the slow sea partons) or decelerated (as are the fast valence partons). It is also a statement that two partons with similar wave functions in the proton may interact with themselves differently not as they interact with a parton whose wave function is different. This results in a simple rule: slow partons preferentially recombine with their spins down in the scattering plane while fast partons recombine with their spins up.
The model predicts correctly the polarization sign but not the magnitude for some of the reaction. So, the model predicts the same polarization magnitude for as it is for , but we know from the above analysis that the polarization magnitudes for are two times smaller. Similarly, for process the model predicts the same magnitude as for , while the measured value is two times larger. Since the polarization in the model is essentially kinematic at the quark level all the antibaryons should have zero polarization. As we have seen in the above analysis, the experimental situation is much more complicated.
There is another estimate of the hadronization time which follows from the analysis of -dependence of hadron production , where GeV [63]. The use of this estimate results in a different expression for the polarization
| (50) |
which is an inverse function of the quark mass . This example shows that the hyperon polarization is sensitive to the details of the hadronization process. These results seem to imply that the origin of hyperon polarization is closely related with the confinement mechanism.
Since the Thomas precession frequency is an inverse function of the quark mass , this may be the reason for a large variation of the parameter for different reactions. The ratio is estimated to be from 17 to 25 with a mean about 21 [64]. The same order of magnitude is given by the ratio of the parameters for the processes and , in which and quarks play an important role. It is interesting to estimate the total rotation angle of a quark spin using the above approximations
| (51) |
Taking typical , , GeV/c, and MeV/c2, we have , while for the quark with MeV/c2 the . So, the total rotation angle of a quark spin due to the Thomas precession could be rather large and varies in the same range as that of the .
In case of and production in collisions the effective field created by the spectator quarks is expected to be two times higher than for production and the corresponding rotation angle will be also two times larger, in agreement with the value for and production.
10.3.4 Lund model
Another explanation of spin-momentum correlation follows from a picture of a colour flux tube, which emerges after the collision between an outgoing quark and the rest of hadronic system [65, 66]. The wave function is assumed for hadrons, in particular, for the system is in a singlet state, so the polarization is that of the quark. An outgoing diquark with spin and isospin stretches the colour field and a pair is produced. It is assumed that the quark has which must be locally compensated by that of the quark. As a result, the pair has an orbital momentum which is assumed to be balanced by the spin of the pair. The model predicts a negative polarization in collisions but cannot predict its magnitude or dependence. The dependence of the polarization is linear. The model needs additional assumptions to explain the polarization in other reactions and fails to explain the antihyperon polarization.
10.3.5 Optical approximation
We propose a simple toy model which uses an analogy with the optics. Let us consider the production in a collision of two protons ( and ) in their c.m. reference frame. The proton’s longitudinal size is about , where fm is a proton radius and .
In an optical picture the phase can be related with the number of scattering centers [67]. We assume here that a hadron can be characterized by an effective refractive index () which leads to a phase difference between spin-flip and spin-nonflip quark scattering amplitudes, where is a total path length inside a proton and is a quark momentum. It is assumed here for the sake of simplicity that a quark from the proton passes on average half of the proton thickness and then changes its angle due to a scattering in the proton . The second part of its way inside the proton is approximately by a factor of larger than that before the scattering (we consider here not too large scattering angles). This results in a phase difference
| (52) |
where fm is the proton Compton wavelength. Eq. (52) can be rewritten as , where
| (53) |
and is the mean fraction of a quark momentum which is carried by the produced hyperon. A similar consideration of the proton quark scattering inside the proton results in a and the total contribution into the polarization is
| (54) |
which is very similar to eq. (10). The averaging over the transverse quark coordinates inside a proton is not taken into account for the sake of simplicity. A more careful consideration of a quark path length after the scattering removes the singularity in eq. (54) since the path length is limited at by the . The dependence of a hyperon polarization is also not taken into account in eq. (54) since we assume that is high enough to resolve quarks inside the hadron structure. The condition for that is GeV/c, where is a constituent quark radius. Comparison of eqs. (53) and (21) assumes that .
We may learn from this toy model that the hyperon polarization oscillation is probably related with a corresponding scattering amplitude phase change due to the hadron mean field generated during hadron interaction. The field strength is proportional to the number of scattering centers in agreement with the above analysis of experimental data. The scaling variables and arise in this model from the consideration of geometrical and relativistic properties of interacting hadrons and the assumption that the phase difference is proportional to the quark path length in the mean hadron field.
11 Conclusion
The analysis of experimental data on the hyperon and antihyperon polarization has been made. It is shown that the existing (anti)hyperon polarization data in inclusive reactions for , , , and hyperon-nucleon collisions can be described by a function of and two scaling variables : . The function is approximated in the scaling limit by a simple expression which results in an oscillation of polarization in case of large value. Functions , , and depend on and can be approximated by constants above 1-2 GeV/c.
It is found that the parameter is consistent with an universal dependence on quark composition (eq. (21)) for about two tens measured (anti)baryon production processes. In addition, the preliminary analysis indicates the validity of the same eq. (21) for about two dozen spin-dependent processes in which analyzing power of produced hadrons was measured. Universal character of the dependence on quantum numbers allows one to predict the values for a large number of processes in which analyzing power or hadron polarization is measured. It indicates also that we deal with a physical case and not just with data description.
In particular, we expect a near linear dependence of the analyzing power on for production in and collisions due to a small value of .
The polarization of in collisions is fitted well by eq. (10) and indicates an oscillation of it as a function of . Similar oscillations with large parameter are also seen for other processes, including and .
The data fits indicate a simple relation for the parameter in case of hyperons produced in collisions: , where is the number of quarks in the system.
The data fits indicate also that the hyperon polarization decreases on nuclear targets according to the law , with . This effect may be related with the rescattering of polarized quarks in the nuclear matter before formation of a hyperon is over. Since the formation length is proportional to the final hyperon momentum, we expect a rise of quark rescattering probability with increase. Due to the similarity between the hyperon polarization and the analyzing power features we expect that the -dependence of the analyzing power is also described by the law with .
The polarization sign and its magnitude depend on quark composition of hadrons participating in the reaction and can be predicted using the proposed formulas. In most cases the processes with large value have a small magnitude which makes it difficult to measure.
There is an analogy between the scaling properties of polarization for hyperons, produced in collisions of unpolarized hadrons, and the scaling properties of the analyzing power of hadrons, produced in the collisions of polarized protons (antiprotons) with hadrons. This analogy between the analyzing power and the hyperon polarization indicates on a common origin of both phenomena. The possible mechanism may be related with the confinment forces. These forces are created by the mean colour field generated after the initial hard scattering of quarks. The quark spin rotation in the mean field could lead to the phase difference between spin-flip and spin-nonflip amplitudes which results in the hyperon polarization.
The origin of the scaling variables can be understood from the dimensional analysis, the rotational invariance, and also in the framework of an optical picture of hadron-hadron interactions.
References
- [1] G. Bunce et al., Phys. Rev. Lett. 36 (1976) 1113.
- [2] F. Abe et al., Phys. Rev. D34 (1986) 1950.
- [3] F. Abe et al., Phys. Rev. Lett. 50 (1983) 1102.
- [4] B.E. Bonner et al., Phys. Rev. D38 (1988) 729.
- [5] E.C. Dukes et al., Phys.Lett. B193 (1987) 135.
- [6] K. Raychaudhuri et al., Phys. Lett. 90 B (1980) 319.
- [7] S.A. Gourlay et al., Phys. Rev. Lett. 56 (1986) 2244.
- [8] C. Wilkinson et al., Phys. Rev. Lett. 46 (1981) 803.
- [9] K. Heller et al., Phys. Rev. Lett. 51 (1983) 2025.
- [10] K. Heller et al., Phys. Rev. Lett. 41 (1978) 607.
- [11] B. Lundberg et al., Phys. Rev. D 40 (1989) 3557.
- [12] E.J. Ramberg et al., Phys. Lett. 338 B (1994) 403.
- [13] A.M. Smith et al., Phys. Lett. 185 (1987) 209.
- [14] A. Morelos et al., Phys. Rev. Lett. 71 (1993) 2172.
- [15] C. Wilkinson et al., Phys. Rev. Lett. 58 (1987) 855.
- [16] C. Ankenbrandt et al., Phys. Rev. Lett. 51 (1983) 863.
- [17] Y.W. Wah et al., Phys. Rev. Lett. 55 (1985) 2551.
- [18] L. Deck et al., Phys. Rev. D 28 (1983) 1.
- [19] B.E. Bonner et al., Phys. Rev. Lett. 62 (1989) 1591.
- [20] J. Duryea et al., Phys. Rev. Lett. 67 (1991) 1193.
- [21] P.M. Ho et al., Phys. Rev. Lett. 65 (1990) 1713.
- [22] L.H. Trost et al., Phys. Rev. D 40 (1989) 1703.
- [23] R. Rameika et al., Phys. Rev. D 33 (1986) 3172.
- [24] M.L.Faccini-Turleur et al., Z. Phys. C 1 (1979) 19.
- [25] A.Borg et al., Nuovo Cimento 22 A (1974) 559.
- [26] H. Abramowicz et al., Nucl. Phys. B 105 (1976) 222.
- [27] H. Grassler et al., Nucl. Phys. B 136 (1978) 386.
- [28] M. Baubillier et al., Nucl. Phys. B 148 (1979) 18.
- [29] J. Bensinger et al., Nucl. Phys. B 252 (1985) 561.
- [30] S.N. Ganguli et al., Nucl. Phys. B 128 (1977) 408.
- [31] P.V. Chliapnikov et al., Nucl. Phys. B 112 (1976) 1.
- [32] W. Barletta et al., Nucl. Phys. B 51 (1973) 499.
- [33] I.V. Ajinenko et al., Phys. Lett. 121 B (1983) 183.
- [34] B. Adeva et al., Z. Phys. C 26 (1984) 359.
- [35] R. Sugahara et al., Nucl. Phys. B 156 (1979) 237.
- [36] F. Barreiro et al., Phys. Rev. D 17 (1978) 669.
- [37] J. Bensinger et al., Phys. Rev. Lett. 50 (1983) 313.
- [38] P.H. Stuntebeck et al., Phys. Rev. D 9 (1974) 608.
- [39] K. Heller, In Proceeding of the 12th International Symposium on High-Energy Spin Physics, September 10 - 14, 1996. Amsterdam, The Netherlands. Ed. by C.W. de Jager et al. World Sci., Singapore. (p. 23) 1996.
- [40] K.B. Luk et al., Phys. Rev. Lett. 70 (1993) 900.
- [41] M.I. Adamovich et al., Z. Phys. A 350 (1995) 379.
- [42] R.O. Polvado et al., Phys. Rev. Lett. 42 (1979) 1325.
- [43] G.L. Kane, J. Pumplin and W. Repko, Phys. Rev. Lett. 41 (1978) 1689.
- [44] L.G. Pondrom, Phys. Rep. 122 (1985) 57.
- [45] J.Lach, Hyperon Polarization and Magnetic Moments. Preprint FERMILAB-Conf-93/381. 1993.
- [46] J.Soffer, Is the riddle of the hyperon polarization solved?, (Marseille, CPT). Preprint CPT-99-P-3898, Sep. 1999. Invited talk at Hyperon 99: Hyperon Physics Symposium, Batavia, Illinois, 27-29 Sep. 1999. p. 121; hep-ph/9911373 (1999).
- [47] V.V. Abramov, A New Scaling for Single-Spin Asymmetry in Meson and Baryon Hadroproduction. IHEP Preprint 98-84, Protvino, 1998; hep-ph/0110152.
- [48] V.V. Abramov, Eur. Phys. J. C 14 (2000) 427; DOI 10.1007/s100529900355.
- [49] Liang Zuo-tang and C.Boros, Phys. Rev. Lett. 79 (1997) 3608.
- [50] Yu. Bushnin et al., Phys. Lett. 29 (1969) 48.
- [51] J. Felix et al., Phys. Rev. Lett. 76 (1996) 22.
- [52] R. Blankenbeckler and S.J. Brodsky, Phys. Rev. D 10 (1974) 2973.
- [53] J. Qui and G. Sterman,Preprint ITP-SB-98-28; Phys. Rev. D 59 (1999) 014004; hep-ph/9806356. Single Transverse Spin Asymmetries in Hadronic Pion Production.
- [54] J. Franklin, Phys. Rev. 172 (1968) 1807.
- [55] C. Boros, Liang Zuo-tang, Phys. Rev. D 57 (1998) 4491.
- [56] M.G. Ryskin, Polarization phenomena and confinement forces, In Proc. of the Int. Conf. on Quark Confinement and the Hadron Spectrum, Como, Italy, 20-24 June 1994. Edited by N.Brambilla and G.M.Prosperi. River Edge, N.J., World Scientific, 1995, p. 261.
- [57] S.M. Troshin and N.E. Tyurin, Phys. Rev. D 55 (1997) 1265.
- [58] S.M. Troshin and N.E. Tyurin, Phys. Rev. D 52 (1995) 3862.
- [59] T.A. DeGrand, H. Miettinen, Phys. Rev. D 24 (1981) 2419.
- [60] T.A. DeGrand et al., Phys. Rev. D 32 (1985) 2445.
- [61] L.T. Thomas, Philos. Mag. 3 (1927) 1.
- [62] A.A. Logunov, On Tomas Precession. IHEP preprint 98-85, Protvino, 1998.
- [63] V.V. Abramov, Yad. Fiz. 44 (1986) 1318 [Sov. J. Nucl. Phys. 44 (1986) 856].
- [64] D.E.Groom et al., Eur. Phys. J. C 15 (2000) 1.
- [65] B. Anderson, G. Gustafson and G. Ingelman, Phys. Lett. B 85 (1979) 417; Phys. Rep. 97 (1983) 31.
- [66] M.G. Ryskin, Yad. Fiz. 48 (1988) 1114 [Sov. J. Nucl. Phys. 48 (1988) 708].
- [67] S.M. Troshin, N.E. Tyurin, Uspechi Fiz. Nauk 164 (1994) 1073.