SINP/TNP/01-22
Three Generation Neutrino Oscillation Parameters after SNO
Abhijit Bandyopadhyay111abhi@theory.saha.ernet.in, Sandhya Choubey 222sandhya@theory.saha.ernet.in, Srubabati Goswami 333sruba@theory.saha.ernet.in, Kamales Kar 444kamales@theory.saha.ernet.in
Saha Institute of Nuclear Physics,
1/AF, Bidhannagar, Kolkata 700 064, INDIA
Abstract
We examine the solar neutrino problem in the context of the
realistic three neutrino mixing scenario including the SNO charged
current (CC) rate. The two independent mass squared differences
and
are taken to be in the solar and atmospheric ranges respectively.
We incorporate the constraints on m as obtained
by the SuperKamiokande atmospheric neutrino data and determine the
allowed values of , and
from a combined analysis of solar and CHOOZ data.
Our aim is to probe the changes in the values of the mass and
mixing parameters with the inclusion of the SNO data as well as
the changes in the two-generation parameter region obtained from
the solar neutrino analysis with the inclusion of the third
generation. We find that the inclusion of the SNO CC rate in the
combined solar + CHOOZ analysis puts a more restrictive bound on
. Since the allowed values of are
constrained to very small values by the CHOOZ experiment there is
no qualitative change over the two generation allowed regions in
the plane. The best-fit
comes in the LMA region and no allowed area is obtained in the SMA
region at 3 level from combined solar and CHOOZ analysis.
PACS numbers(s): 14.60.Pq, 12.15.Ff, 26.65.+t.
1 Introduction
The recent results on charged current measurement from Sudbury
Neutrino Observatory (SNO) [1] have confirmed the solar
neutrino shortfall as observed in the earlier experiments
[2, 3, 4, 5]. A comparison of the SuperKamiokande
and SNO results establishes the presence of non-electron flavor
component in the solar neutrino flux received at earth (at more
than 3 level) in a model independent manner [1, 6, 7, 8]. Neutrino oscillation provides the most
popular explanation to this anomaly. Two generation analysis of
the solar neutrino data including the SNO results has been
performed by various groups [7, 9, 10, 11, 12, 13, 14, 15]. All these analyses agree that the best
description to the data on the total rates and the day/night
spectrum data of the SuperKamiokande (SK) collaboration is
provided by the Large Mixing Angle (LMA) MSW solution ( eV2), though the low
m solution (LOW-QVO) ( eV2) and the vacuum oscillation (VO)
solutions ( eV 2) are also
allowed. The Small Mixing Angle (SMA) MSW solution is largely
disfavoured with no allowed contour in the mass-mixing plane at
the level 555Only exception is the analysis of
[9] which get a small allowed region for the SMA solution
due to a slight difference in the treatment of the data.. On the
other hand, for the explanation of the atmospheric neutrino
anomaly the two generation oscillation analysis of the atmospheric
neutrino data requires m 10 -3 eV2
[16]. Since the allowed ranges of m and
m are completely non-overlapping, to explain the
solar and atmospheric neutrino data simultaneously by neutrino
oscillation, one requires at least two independent mass-squared
differences and consequently three active neutrino flavors which
fits very nicely with the fact that to date we have observed three
neutrino flavours in nature. Thus to get the complete picture of
neutrino masses and mixing a three generation analysis is called
for. Apart from the solar and atmospheric neutrinos positive
evidence for neutrino oscillation is also published by the LSND
experiment [17] and although there had been several
attempts to explain all the three evidences in a three generation
picture it is now widely believed that to accommodate the LSND
results one has to introduce an additional sterile neutrino
[18, 19]. For the purpose of this analysis we ignore the
LSND results. We incorporate the negative results from the CHOOZ
reactor experiment on the measurement of
oscillation by disappearance technique [20]. CHOOZ is sensitive to
m eV2 which is the range
probed in the atmospheric neutrino measurements and together they
can put important constraints on the three neutrino mixing
parameters.
We consider the three flavour picture with
, .
Three flavor oscillation analysis of solar, atmospheric and CHOOZ data assuming this mass spectrum was performed in pre SNO era by different groups [21, 22, 23]. We investigate the impact of the charged current measurement at SNO on neutrino mass and mixing in a three flavor scenario and present the most up to date status of the allowed values of three flavor oscillation parameters.
The plan of the paper is as follows. In section 1 we present the relevant probabilities. In section 3 we discuss the -analysis method and the results. We end in section 4 with some discussion and conclusions.
2 Calculation of Probabilities
The three-generation mixing matrix that we use is
| (1) | |||||
where we neglect the CP violation phases. This is justified as one can show that the survival probabilities of the electron neutrinos do not depend on these phases. The above choice has the advantage that the matrix elements Ue1, Ue2 and Ue3 relevant for the solar neutrino problem becomes independent of while the elements Ue3, Uμ3 and Uτ3 relevant for the atmospheric neutrino problem are independent of . The mixing angle common to both solar and atmospheric neutrino sectors is which, as we will see, is constrained severely by the CHOOZ data.
2.1 Solar Neutrinos
The general expression for the survival amplitude for an electron neutrino arriving on the earth from the sun, in presence of three neutrino flavours is given by [24]
| (2) |
where gives the probability amplitude of transition at the solar surface, gives the transition amplitude from the solar surface to the earth surface, denotes the transition amplitudes inside the earth. One can write the transition amplitudes in the sun as an amplitude part times a phase part
| (3) |
can be expressed as
| (4) |
where denotes the non-adiabatic jump probability between the jth and kth state and denotes the mixing matrix element between the flavour state and the mass state in sun. is given by
| (5) |
where is the energy of the state , is the distance between the center of the Sun and Earth and is the solar radius. For a two slab model of the earth — a mantle and core with constant densities of 4.5 and 11.5 gm cm-3 respectively, the expression for can be written as (assuming the flavor states to be continuous across the boundaries)[25],
| (6) |
where () denotes mass eigenstates and () denotes flavor eigenstates, and are the mixing matrices in the mantle and the core respectively and and are the corresponding phases picked up by the neutrinos as they travel in the mantle and the core of the Earth.
| (7) | |||||
This is the most general expression for the probability [26]. Since for our case is eV2 the phase terms and average out to zero. Therefore the probability simplifies to
| (8) | |||||
The mixing matrix elements in matter are different from those in vacuum and it is in general a difficult task to find the matter mixing angles and eigenvalues for a matrix. However in our case since mm the matter potential in sun , the state experiences almost no matter effect and MSW resonance can occur between and states. Under this approximation the three generation survival probability for the electron neutrino can be expressed as,
| (9) |
where is of the two generation form in the mixing angle .
| (10) |
where
| (11) |
with
| (12) |
where denotes the matter potential,
| (13) |
here is the electron density in the sun, the neutrino energy, and (= ) the mass squared difference in vacuum. The jump probability continues to be given by the two-generation expression and for this we use the analytic expression given in [27]. in the Heaviside function gives the minimum energy that can encounter a resonance inside the sun and is given by
| (14) |
gives the minimum energy that can encounter a resonance inside the sun, being the electron density at the point of production. In the limit = 0 one recovers the two generation limit.
2.2 The Probability for CHOOZ
The survival probability relevant for the CHOOZ experiment for the three generation case is
| (15) | |||||
Since the average energy of the neutrinos in the CHOOZ experiment is 1 MeV and the distance traveled by the neutrinos is of the order of 1 Km the term is important only for eV2. The last term in the above expression is an interference term between both mass scales [28] and is absent if one uses the approximation and is often ignored.
3 The analysis
The definition of used in our fits is
| (16) | |||||
where ( = th or exp) denote the total rate while denote the SK spectrum in the ith bin. Both the experimental and theoretical values of the fitted quantities are normalised relative to the BPB00 [29] predictions. The experimental values for the total rates are the ones shown in Table 1, while the SK day-night spectra are taken from [2]. The error matrix contains the experimental errors, the theoretical errors (which includes error in the capture cross-sections and the astrophysical uncertainties in BPB00 predictions) along with their correlations. It is evaluated using the procedure of [30]. The error matrix for the spectrum contains the correlated and uncorrelated errors as discussed in [31]. The details of the solar code used is described in [10, 32, 12, 14]. We vary the normalisation of the SK spectrum as a free parameter to avoid double counting with the SK data on total rate. Thus there are independent data points from the SK day-night spectrum along with the 4 total rates giving a total of 41 data points. For the analysis of only the solar data in the three-generation scheme, we have degrees of freedom (DOF). The best-fit values of parameters and the are
-
•
eV2, = 0.375, = 0.0, = 33.42
Hence the best-fit comes in the two-generation limit presented in [10, 12, 14].
We next incorporate the results from the CHOOZ reactor experiment [20]. The definition of is given by [33]
| (17) |
where are the experimental values, are the corresponding theoretical predictions, are the 1 errors in the experimental quantities and the sum is over 15 energy bins of data of the CHOOZ experiment [20]. The global for solar+CHOOZ analysis is defined as
| (18) |
The total number of data points for combined solar and CHOOZ analysis is therefore 41+15 = 56. The solar+CHOOZ analysis depends on , , and . For unconstrained , the and the best-fit values are
-
•
eV2, = 0.374, eV2,
,
However the atmospheric neutrino data imposes strong constraints on the allowed range of . The combined analysis of the 1289 day atmospheric data and the CHOOZ data restricts allowed in the range eV2 at 99% C.L. [21]. Thus the best-fit that we obtain from the solar+CHOOZ analysis falls outside the allowed range. If we restrict the range of from the combined analysis of the atmospheric+CHOOZ analysis [21] then the and the best-fit parameters obtained from the combined solar+CHOOZ analysis are
-
•
eV2, = 0.374, eV2,
,
Thus the best-fit for the solar+CHOOZ analysis comes almost at the two generation limit, with the best-fit at the lower limit of the allowed range. For 52 DOF this solution is allowed at 89.33%. The improvement in the goodness of fit (GOF) in comparison to the two flavour analysis presented in [10, 12, 14] is due to the inclusion of the CHOOZ data which gives a /DOF of about 6/15.
4 Allowed areas in the three generation parameter space
4.1 Constraints on the m plane
For the chosen mass spectrum and mixing matrix
the relevant survival probabilities for atmospheric neutrinos
depend on the parameters , and
mm [22] while the CHOOZ
survival probability P depends mainly on
and m and very
mildly on and m.
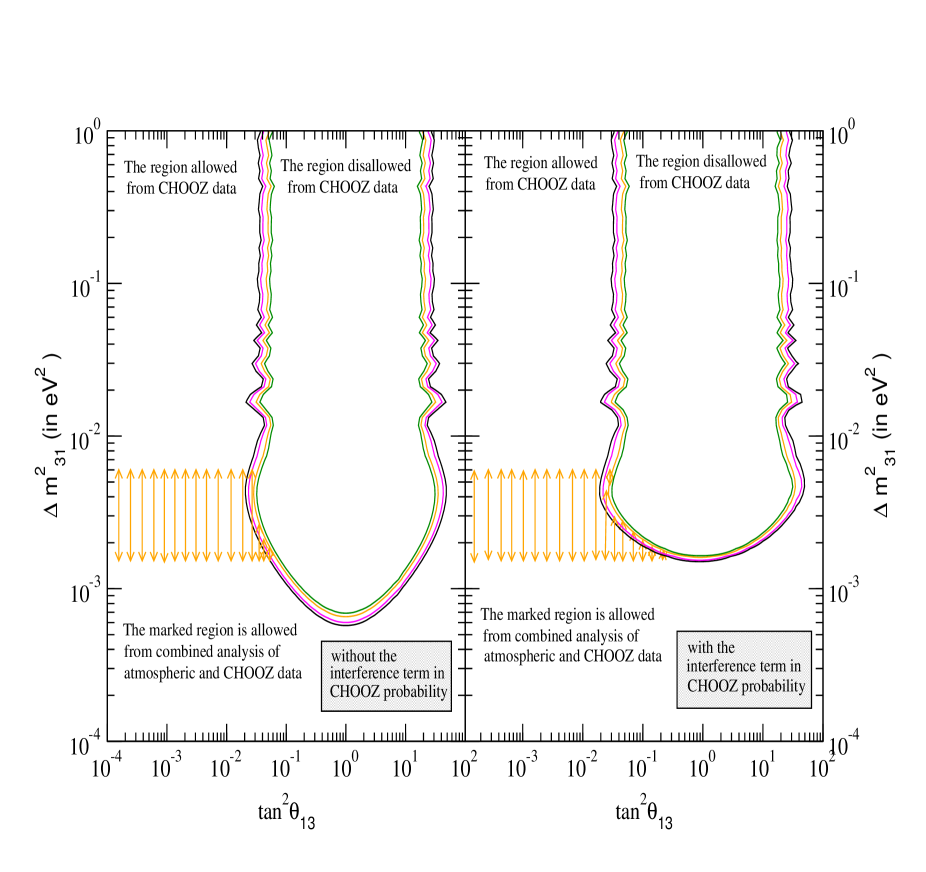
In fig. 1 we plot the allowed domains in the
parameter space the from
analysis of only the CHOOZ data keeping all other parameters free.
We give this plot both with and without taking into account the interference
term. The effect of the interference term is to lift the
allowed ranges of .
The shaded area marked by arrows in this figure
is the allowed range from a combined analysis of 1289 day
atmospheric data and CHOOZ data taken from [21]. At 99%
C.L. the atmospheric+CHOOZ analysis allows
and
1.510-3eV2
m10-3eV2. It also becomes
apparent from this figure that for
, all values of
m in the range 1.5,6.0
10-3eV2 are allowed at 99% C.L. where as for
,
certain values of get excluded. A closer
inspection of fig. 1 shows that around a window in is disallowed whereas for
higher values of certain regions of towards higher values of the interval
1.5,6.0 eV2
get disallowed. The
width of the disallowed range in m depend on
. Clearly the m is restricted
more from the atmospheric data while the more stringent bound on
tan comes from the CHOOZ results.
It is also evident that the region in
which is disallowed in the only CHOOZ
contour once the interference effects are taken into account is also being
disallowed by the combined atmospheric and CHOOZ analysis.
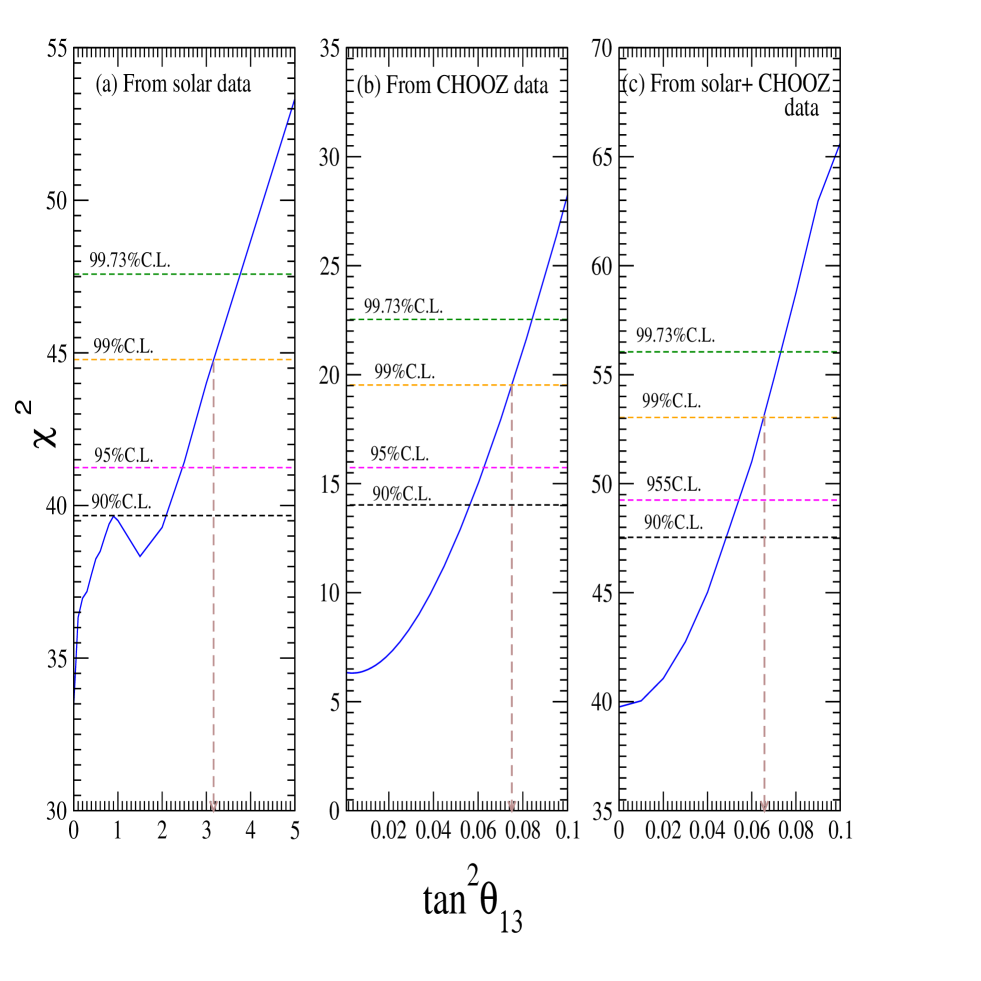
In figs. 2a, 2b and 2c we plot the ,
, and
respectively against , keeping ,
m and m (in the range
1.5,6.010-3
eV2) free. It is clear from the
three figures that the most stringent bound on ( 0.065 at 99% C.L.) comes from the combined solar and CHOOZ
analysis.
The pre-SNO bound on that we get
from the combined solar+CHOOZ
analysis is .
Thus SNO is seen to tighten the constraint
on the mixing angle such that the most stringent
upper limit on is obtained from the solar plus CHOOZ
analysis.
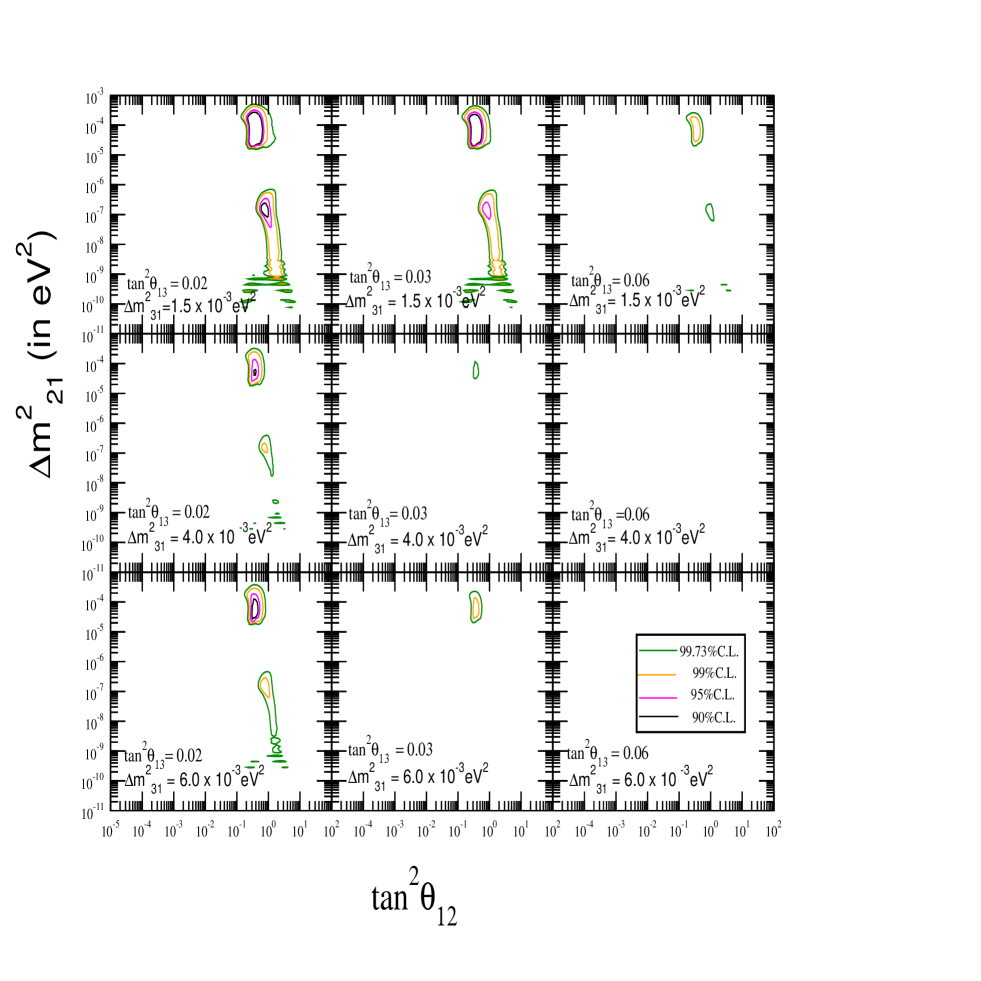
4.2 Probing the m parameter space.
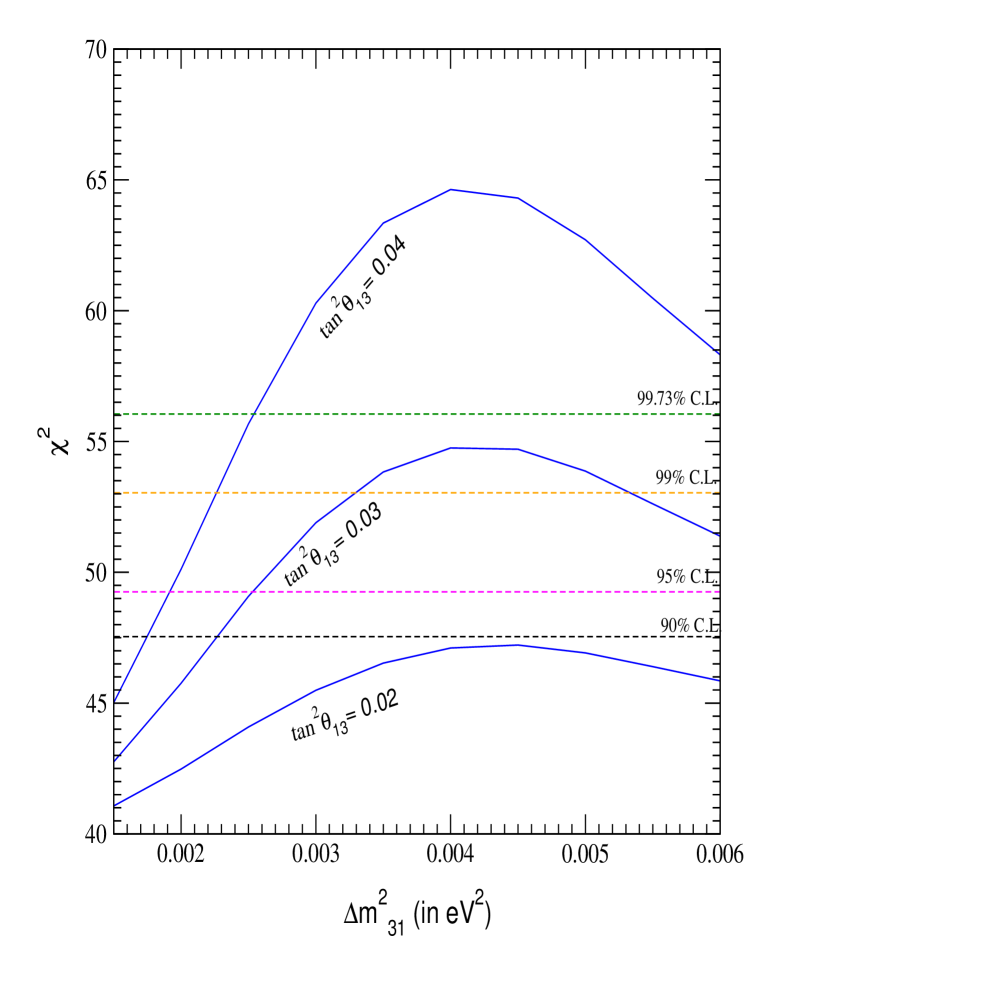
We now attempt to explore the 1-2 parameter space from a combined solar+CHOOZ analysis, in the light of new results from SNO. The parameters and m are mainly constrained from the solar data. We present in fig. 3 the allowed areas in the 1-2 plane at 90%, 95%, 99% and 99.73% confidence levels for different sets of combination of and , lying within their respective allowed range from atmospheric+CHOOZ and solar+CHOOZ analysis. The CHOOZ data limits the upper allowed range of in the LMA region to eV2. In the three flavor scenario also there is no room for SMA MSW solution at the 3 level (99.73% C.L)666We find that for values of , one gets allowed areas in the SMA region at 3 level even after including the SNO data. Beyond this value of the allowed area in the SMA region increases and finally for larger values of the SMA and LMA regions merge with each other. However these large values of lie outside the range allowed by CHOOZ.. We see from fig. 3 that the allowed regions reduce in size as we increase for a fixed . At the upper limit of the allowed range of m the LOW solution gets completely disallowed beyond tan 0.02 while the LMA solution gets disallowed beyond tan 0.03. At the lower limit of of m the LMA solution is found to disappear at 99% C.L. beyond tan, which is the upper bound of at 99% C.L., obtained from solar+CHOOZ analysis. On the other hand for any given the least allowed area in tanm parameter space occurs at m 4.010-3 eV2, whereas above and below this value larger regions of parameter space are allowed. To illustrate this in fig. 4 we plot the vs. for fixed allowing the other parameters to vary freely. The highest value of is seen to come for eV2 explaining the least allowed area at this value. The figure also illustrates the occurrence of a disallowed window in around 0.03, as discussed earlier. Since the solar probabilities are independent of it is clear that the CHOOZ data is responsible for this feature. We have plotted these figures taking the interference term in the CHOOZ probability into account. However we have explicitly checked that the interfernce term in the CHOOZ probability does not have any impact on the allowed area in the plane. There are two reasons for this. The interference term comes multiplied with which is confined to very small values. Also the contours that we have plotted are for values of eV2 as allowed by the combined atmospheric and CHOOZ analysis. As is seen from fig. 1 in this region the interference term does not have any significant effect.
5 Summary, Conclusions and Discussions
We have performed a three-generation analysis of the solar neutrino and CHOOZ data including the recent SNO CC results. The mass spectrum considered is one where and = . The other parameters are the three mixing angles , and . For the combined solar and CHOOZ analysis the probabilities are independent of . The solar neutrino probabilities depend on , and . The CHOOZ probability depends mainly on and whereas for eV2 it depends also on and . The most stringent constraint on the parameter comes from the atmospheric neutrino data. For this we use the updated values from [22, 21]. The combined atmospheric + CHOOZ analysis gives [21, 22]. We keep in the range allowed by the atmospheric neutrino data and determine the allowed values of from a combined analysis of solar and CHOOZ data. The inclusion of the SNO results puts a more restrictive bound on – . The best-fit comes in the LMA region of the plane with i.e. at the two generation limit. We present the allowed region in the parameter space for various values of and belonging to their respective allowed ranges and determine the changes in the two-generation allowed region due to the presence of the mixing with the third generation. Since very low values of are allowed from combined solar and CHOOZ analysis there is not much change in the two generation allowed regions. No allowed area is obtained in the SMA region at 3 if one restricts to be 0.065, as allowed by combined solar and CHOOZ analysis.
The combination of solar, atmospheric and CHOOZ data allows to fix
the elements of the neutrino mixing matrix. The element
is narrowed down to a small range from the
solar+CHOOZ analysis including SNO.
The mixing angle is from atmospheric data [22, 21]. This determines the
mixing matrix elements and . The
mixing angle is limited by the solar data and the
tilt is towards large . The mixing matrix at
the best-fit value of solar+CHOOZ analysis is
| (19) |
Thus the best-fit mixing matrix is one where the neutrino pair with larger mass splitting is maximally mixed whereas the pair with splitting in the solar neutrino range has large but not maximal mixing. It is a challenging task from the point of view of model building to construct such scenarios 777For a recent study see [34]..
From the perspective of model building an attractive possibility is one where both pairs are maximally mixed [35]. Our two generation analysis of the solar data showed that for the LMA MSW region maximal mixing is not allowed at 99.73% C.L. though it is allowed for the LOW [10, 12] solution 888See however [14].. However fig. 4 of this paper shows that three generation analysis allows = 1.0 with in the LMA region at 99.73% C.L. for in its lower allowed range eV2 and for 0.02. As increases in the LMA region no longer remains allowed even at 99.73% level though it remains allowed in the LOW-QVO region. Further narrowing down of the parameter space is expected to come from experiments like KamLand and Borexino which will be able to distinguish between the LMA and LOW regions.
S.G. wishes to acknowledge the kind hospitality extended to her by the theory group of Physical Research Laboratory.
Note added: After submission of our revised manuscript a preprint [36] appeared which finds constraints on from a similar three generation analysis of the CHOOZ data.
References
- [1] SNO Collaboration: Q.R. Ahmad et al.., nucl-ex/0106015.
- [2] Y. Fukuda et al.(The Super-Kamiokande collaboration), Phys. Rev. Lett. 81, 1158 (1998); erratum 81, 4279 (1998);
- [3] B.T. Cleveland et al.Astrophys. J 496, 505 (1998).
- [4] Y. Fukuda et al.., (The Kamiokande collaboration), Phys. Rev. Lett. 77, 1683 (1996).
- [5] J.N. Abdurashitov et al., (The SAGE collaboration), Phys. Rev. Lett. 77, 4708 (1996); Phys. Rev. C 60, 055801 (1999); W. Hampel et al., (The Gallex collaboration), Phys. Lett. B388, 384 (1996); Phys. Lett. B447, 127 (1999); Talk presented in Neutrino 2000 held at Sudbury, Canada (T.A. Kirsten for The Gallex collaboration), Nucl. Phys. B Proc. Suppl. 77, 26 (2000); M. Altmann et al., (The GNO collaboration),Phys. Lett. B492,16 (2000); Talk presented in Neutrino 2000 held at Sudbury, Canada ( E. Belloti for the GNO Collaboration) Nucl. Phys. B Proc. Suppl. 91 44 (2001).
- [6] V. Barger, D. Marfatia and K. Whisnant, hep-ph/0106207.
- [7] G.L. Fogli, E. Lisi, D. Montanino and A. Palazzo, hep-ph/0106247.
- [8] C. Giunti, hep-ph/0107310.
- [9] J.N. Bahcall, M.C. Gonzalez-Garcia and C. Pana-Garay, hep-ph/0106258.
- [10] A. Bandyopadhyay, S. Choubey, S. Goswami and K. Kar, Phys. Lett. B519, 83 (2001).
- [11] P. Creminelli, G. Signorelli, A. Strumia, hep-ph/0102234 , updated version.
- [12] S. Choubey, S. Goswami, K. Kar, H.M. Antia and S.M. Chitre, Phys. Rev. D64, (in press), hep-ph/0106168.
- [13] P.I. Krastev and A.Yu. Smirnov, hep-ph/0108177.
- [14] S. Choubey, S. Goswami and D.P. Roy, hep-ph/0109017.
- [15] M.V. Garzelli and C. Giunti, hep-ph/0108191.
- [16] Y. Fukuda et al., The Super-Kamiokande Collaboration, Phys. Lett. B433, 9 (1998); Phys. Lett. B436, 33 (1998); Phys. Rev. Lett. 81, 1562 (1998). S. Fukuda et al., The Super-Kamiokande Collaboration, hep-ex/0009001.
- [17] C. Athanassopoulos et al., Phys. Rev. Lett. 75, 2650 (1995); C. Athanassopoulos et al., Phys. Rev. Lett. 81, 1774 (1998); Talk presented by the LSND Collaboration in Neutrino 2000, Sudbury, Canada, 2000.
- [18] J.J. Gomez-Cadenas and M.C. Gonzalez-Garcia, Z. Phys. C71, 443 (1996); N. Okada and O. Yasuda, Int. J. Mod. Phys. A12, 3669 (1997); S. Goswami, Phys. Rev. D55, 2931 (1997); S. M. Bilenky, C. Giunti, and W. Grimus, Phys. Rev. D57, 1920 (1998) and D58, 033001 (1998); V. Barger, S. Pakvasa, T. J. Weiler, and K. Whisnant, Phys. Rev. D58, 093016 (1998).
- [19] M.C. Gonzalez-Garcia, M. Maltoni and C. Pena-Garay, hep-ph/0108073 and references therein K.S. Babu and R.N. Mohapatra, hep-ph/0110243; S. Goswami and A.Joshipura, hep-ph/0110272.
- [20] M. Appolonio et al., Phys. Lett. B466, 415 (1999); Phys. Lett. B420, 397 (1998).
- [21] G.L.Fogli, E.Lisi, A.Montamino and A.Palazzo, hep-ph/0104221.
- [22] M.C. Gonzalez-Garcia, M.Maltoni, C. Pena-Garay and J.W.F.Valle, Phys. Rev. D63, 033005, (2001).
- [23] R. Barbieri et al., JHEP, 9812, 017 (1998); V. Barger and K. Whisnant, Phys. Rev. D59, 093007, (1999).
- [24] We have generalised the approach given in G.L. Fogli, E.Lisi, D. Montanino and A. Palazzo, Phys. Rev. D62, 113004, (2000) for three flavours.
- [25] S.T. Petcov, Phys. Lett. B434, 321 (1998); M. Narayan, G. Rajasekharan and R. Sinha, Mod. Phys. Lett. A13, 1915 (1998).
- [26] S.T. Petcov, Phys. Lett. B214 (1988) 139; Phys. Lett. B406, 355 (1997), S.T. Petcov and J. Rich PL B214, 137 , (1989).
- [27] S.T. Petcov, Phys. Lett. B200, 373 (1988).
- [28] S.T. Petcov and M. Piai, hep-ph/0112074.
- [29] J.N. Bahcall, S. Basu, M.P. Pinsonneault, Astrophys. J. 555, 990 (2001).
- [30] G.L. Fogli, E. Lisi, Astropart. Phys. 3, 185 (1995).
- [31] M.C. Gonzalez-Garcia, P.C. de Holanda, C. Peña-Garay, and J.W.F. Valle, Nucl. Phys. B573, 3 (2000).
- [32] S. Goswami, D. Majumdar, A. Raychaudhuri, Phys. Rev. D63, 013003 (2001); hep-ph/9909453; A. Bandyopadhyay, S. Choubey and S. Goswami, Phys. Rev. D63, 113019 (2001); S. Choubey, S. Goswami, N. Gupta and D.P. Roy, Phys. Rev. D64, 053002 (2001).
- [33] R. Foot, R.R. Volkas and O. Yasuda, Phys. Rev. D58 013006, (1998); S. Choubey, S. Goswami and K. Kar, Astropart. Phys. (in press), hep-ph/0004100.
- [34] W. Grimus and L. Lavoura, hep-ph/0110041.
- [35] See for example V. Barger et al., Phys. Lett. B437, 107 (1998).
- [36] S. M. Bilenky, D. Nicclo and S. T. Petcov, hep-ph/0112216.
| experiment | composition | |
|---|---|---|
| Cl | 0.335 0.029 | (75%), (15%) |
| Ga | 0.584 0.039 | (55%), (25%), (10%) |
| SK | 0.459 0.017 | (100%) |
| SNO(CC) | 0.347 0.027 | (100%) |