Inverse Beta Decay in a Nonequilibrium Antineutrino Flux from a Nuclear Reactor
Abstract
The evolution of the reactor antineutrino spectrum toward equilibrium above the inverse beta-decay threshold during the reactor operating period and the decay of residual , radiation after reactor shutdown are considered. It is found that, under certain conditions, these processes can play a significant role in experiments seeking neutrino oscillations.
1 INTRODUCTION
The flux and the spectrum of reactor antineutrinos depend not only on the current reactor state, which is specified by the power level and the isotope composition of the nuclear fuel used, but also on the preceding evolution of the fuel. The spectrum of antineutrinos produced in the beta decay of fission products and other radioactive nuclei accumulated in the reactor core begin to evolve toward equilibrium after the start-up of a reactor. After reactor shutdown, the antineutrino radiation diminishes for a long time.
In [1, 2], equilibration of the spectrum and the reduction of the soft section of the spectrum, where the effects of preceding evolution are pronounced, were analyzed in connection with the problem of searches for the neutrino magnetic moment in experiments studying scattering.
In this study, we consider the inverse-beta-decay process
| (1) |
and antineutrino spectrum above the threshold for this reaction (1.804 MeV). Presently, reaction (1) is of interest mainly as a tool for seeking neutrino neutrino oscillations in reactor experiments.
In this case, the oscillations in question are manifested in the disappearance of some fraction of the flux and in a characteristic modulation of the spectrum, the latter being specified by the factor
| (2) |
where is the mixing parameter, is the mass parameter measured in electronvolts squared, is the distance (in meters) between the source and detector, and is the detected neutrino energy measured in megaelectronvolts.
In experiments seeking the above oscillations, the spectrum and flux measured with the aid of reaction (1) are compared with their values expected in the absence of the oscillations. In this case, use is made of the reactor spectrum obtained independently ( spectrum at the production instant). Uncertainties in determining this spectrum restrict the sensitivity of the method, and systematic error in the spectrum shape may generally mimic or mask the oscillation effect. Procedures that are applied to analyze data from experiments seeking oscillations were described in more detail elsewhere (see, for example, [3]). As a rule, equilibration of the spectrum and the reduction of the spectrum do not lead to considerable effects in the region . However, their role can be greatly enhanced in some cases that will be discussed in Section 4.
This article is organized as follows. In Section 2, we give a brief account of available data on the spectrum of reactor in the region and on the cross section for reaction (1). In Section 3, we consider the evolution of the spectrum in the reactor operating period and residual antineutrino radiation in the reactor shutdown period and determine the relevant cross sections. Section 4 is devoted to discussing the results.
2 SPECTRA AND CROSS SECTIONS (STANDARD APPROACH
Let us briefly review the basic properties of the reactor-antineutrino spectrum in the energy region above 1.8 MeV and the spectrum-averaged cross section for reaction (1) (see, for example, [1, 2, 4-8] and references therein).
The standard approach is based on the following assumptions:
| Fission | Multicolumn4Fissile nucleus | |||
|---|---|---|---|---|
| fragment | ||||
| 5.95 | 5.30 | 4.89 | 5.50 | |
| 4.30 | 5.40 | 4.14 | 5.16 | |
| 6.40 | 3.89 | 3.15 | 4.97 | |
| 0.40 | 4.31 | 6.18 | 2.55 | |
| 5.48 | 3.74 | 4.39 | 4.50 | |
| 5.82 | 2.10 | 1.57 | 3.12 |
(i) The spectrum is formed exclusively by the beta decays of the fragments produced in a reactor upon the fission of and isotopes.
(ii) For each isotope, the equilibrium spectrum is established within a small time interval that can be neglected. At the instant under consideration, the reactor-antineutrino spectrum measured in (MeV)-1 units per fission event can then be expressed in terms of the spectra for four fissile isotopes. Specifically, we have
| (3) |
where is the contribution of a given isotope to the number of fission events occurring in a reactor at this instant, the subscript values of , and 1 labeling the quantities associated with the fissile isotopes , , and
Because of depletion and the accumulation of fissile plutonium isotopes, the contributions entering into Eq. (3) change, which leads to a change in the total spectrum over the reactor operating period. As was mentioned above, the spectra are assumed to be time-independent. Information about current values is presented by the reactor personnel, the relative error in these values being set to 5%.
The spectra for , and were obtained in [5] by the conversion method, which enables one to reconstruct the relevant antineutrino spectrum on the basis of the total spectrum of beta- decay electrons from the set of the fragments of a given fissile isotope. For a few tens of hours, thin layers of the aforementioned isotopes were exposed to a thermal-neutron flux from the reactor installed at ILL (Grenoble), and the current spectra of electrons from the beta decay of fragments were simultaneously measured in the energy region above 2.0 MeV for and in the energy region above 1.8 MeV for and . After approximately 12 hours of irradiation, the beta spectra reached saturation and changed ii longer. Therefore, the antineutrino spectra reconstructed on the basis of these spectra are actually those that are established after about one day of fuel irradiation. For , use was made of the spectrum calculated in [6] because the beta spectrum was not measured for the fragments of E1 isotope.
The expected number of events of the interaction between antineutrinos and target protons was calculated in terms of the cross section for reaction (1),
| (4) |
where being the reaction cross section for monoenergetic antineutrinos [7].
In terms of cm2 units per fission event, the values calculated in this way are
| (5) |
These calculations were performed with the9 constants corresponding to the free-neutron lifetime of . The resulting error in the cross section (4) is 2.7% (68% C.L.).
To a higher precision, the cross section for reaction (1) is known from an experiment performed by the Kurchatov Institute - College de France - LAPP collaboration at a distance of 15 m from the Bugey PWR reactor [8]:
| (6) |
This result corresponds to the following contributions a; from fissile isotopes:
| (7) |
The proportion in (7) for the number of isotope-fission events is typical for PWR reactors, which were used in the majority of experiments seeking the oscillations in question. Within the errors, the cross section in (6) agrees with the reaction cross section found for the given composition of nuclear fuel:
| (8) |
The experimental value in (6) is treated as a metrological reference for the cross section in the absence of oscillations. A feature peculiar to this reference is that, in each specific case of its application, it must be rescaled to the relevant composition of nuclear fuel. As a result, the error in the cross section increases to about 1.6%.
For reactors of the type being considered, the duration of the operating period is approximately one year. After that, the reactor is shut down for 30-40 days, and one-third of the fuel is replaced by a new load of fuel. Therefore, the fuel is irradiated for three years.
The detector background is measured during reactor shutdown periods. It is assumed that antineutrino emission in the region MeV ceases completely within one day after reaction shutdown.
The above information forms a basis for analyzing and interpreting the results of experiments seeking neutrino oscillations in reactor experiments.
3 SPECTRA AND CROSS SECTIONS (INCLUSION OF NONEQUILIBRIUM EFFECTS)
1. Let us determine more precisely sources that contribute to the formation of the reactor-antineutrino spectrum ,
| (9) |
The first term in (9) describes radiation from the set of fragments produced in and fission, their interactions with neutrons being disregarded here; the second term takes into account additional radiation arising in radiative neutron capture by accumulated fragments.
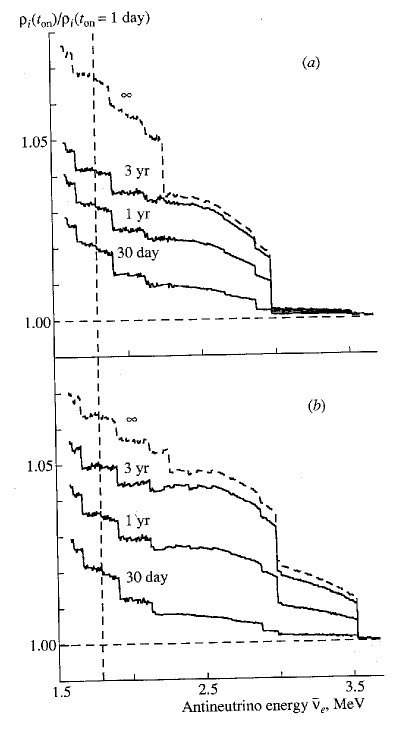
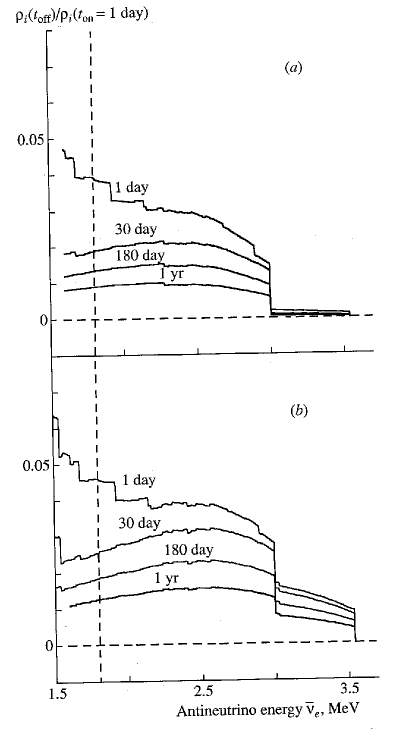
For an irradiation time of day, each of the spectra for the four isotopes and were calculated as functions of the duration of fuel irradiation. In this calculation, the fission rate was assumed to be constant for each isotope. The residual-radiation spectra were also calculated as functions of the time from the end of fission.
The calculations were performed by summing, at each instant, the contributions from individual fission fragments with allowance for their yields from the fission process, decay diagrams, and lifetimes. The database that we used contains information about 571 fission fragments whose cumulative yields are not less than each. As a matter of fact, the activity of the majority of the fragments that can contribute in the energy region MeV reaches saturation within one day after the onset of the fission process, and a further increase is due to only six fission products whose properties are well known. Three of them - ( MeV) ( MeV), and ( MeV) - attain equilibrium within ten days. A further slow increase is determined by the and half-lives (see (10)).
| (10) |
Finally, some contribution comes from h, MeV) as well, which is in equilibrium with its very long-lived predecessor ( yr). The yields of these fission fragments are quoted in the table.
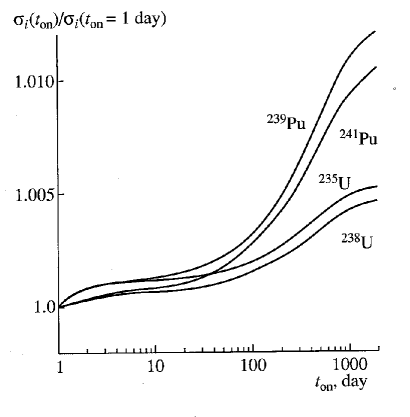
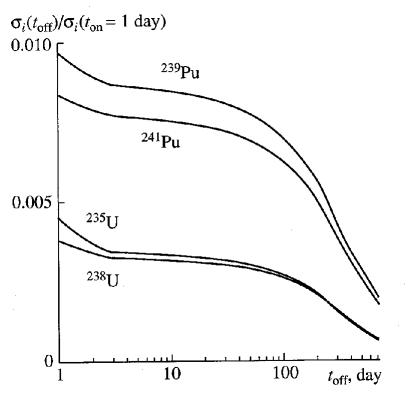
2. The antineutrino spectra calculated for and are displayed in Figs. la and lb (equilibration) and in Figs. 2a and 2b (decrease). For four fissile isotopes, Figs. 3 and 4 show, respectively, the cross sections for reaction (1) in the fission process and the decrease in in the residual-radiation spectra. In Figs. 1-4, the spectra and cross sections are presented in dimensionless units and are normalized to the corresponding values after a lapse of = 1 day from the onset of the fission process.
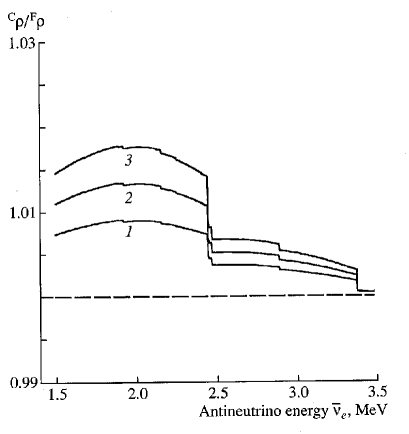
3. The correction was calculated with allowance for fragments accumulated in a reactor, the cross sections for radiative neutron capture, and the spatial and energy distributions of the neutron flux over the reactor core. The results presented in Fig. 5 refer to a standard operating period of a PWR reactor.
The relevant contribution to the cross section for reaction (1) is about 0.2% at the end of the operating period. After reactor shutdown, the spectrum decreases fast, not making a significant contribution to residual radiation. 4.
4 DISCUSSION OF RESULTS
(i) In the approximation specified in Section 2, the flux and the spectrum of reactor antineutrinos are un- ambiguously determined by the current reactor state. After sharp changes in this state, the characteristics of the flux take the corresponding equilibrium values within a time as short as one day. In particular, the antineutrino flux falls down to zero within one day after reactor shutdown.
As a matter of fact, the antineutrino flux in the region MeV has been found to have a nonequilibrium component, whose relaxation time exceeds the duration of the reactor operation period. In a view of this, a determaination of the spectrum and of the corresponding values of the cross section for reaction (1) requires tracing the preceding evolution of reactor operation over a long time and taking into account power levels, shutdown periods and the discharge of spent reactor fuel. In each specific case, this can be done, if needed to a sufficient precision.
The sample of the results in Section 3, which were obtained under assumption that the fission of uranium and plutonium isotopes proceeds at a constant rate, has enabled us to reveal qualitative features of effects induced by the nonequilibrium component.
(ii) First of all, we note that the resulting corrections to the spectrum and cross sections are relatively small, but they are not negligible. In the antineutrino energy range 1.8-3.5 MeV, the relative contribution of the additional radiation during the reactor operating period (Figs. 1, 5) is about 4%, which is somewhat greater than the error of the ILL spectra [5].
The corrections to the cross sections cr, in Fig. 3 and the correction associated with radiative neutron capture may change the cross sections by 0.4-0.6%. As a result, relation (8) will change accordingly. Corrections on the same order of magnitude may arise if the cross section (6) is used as a reference value for the cross section in the absence of the oscillations.
(iii) Here, we consider a situation where residual radiation from a stopped reactor can play a significant role and provide numerical examples illustrating the scale of the effects under discussion.
Let us consider an experiment where antineutrinos from reactors are recorded by one detector positioned in such a way that the reactors are at markedly different distances from the detector. Such an experimental setting was implemented, for example, in Rovno (distances of 18 and 98 m) and in the Bugey-3 experiment (15 and 95 m) [9]; three reactors in Krasnoyarsk were located at distances of 57, 57, and 234 m from the detector [10]. The idea of these experiments consists in using the shutdown and operating periods to determine the background level and the signals from each individual reactor. By comparing these signals, one can reveal the oscillation effect or set limits on the oscillation parameters.
By way of example, we consider two identical PWR reactors of thermal power 2.8 GW each and a detector positioned at distances of 15 and 100 m from the near and the far reactor, respectively, so
Fig.5. Ratio of the spectrum component ?(A) associated with neutron capture by fission products in a PWR reactor to the fission spectrum p(E). Curves /, 2, and 8 correspond to the beginning, middle, and end of the reactor operating period.
that the signal from the near reactor is approximately 45 times as great as that from the far one. In this case, the numbers of events of reaction (1) that are induced by the near and the far reactor per 1 t of a target per day are day-1 t-1 and day-1 t-1 ,respectively.
When both reactors are shut down, the detector records, however, the residual interaction in addition to the background. Within one to two days after the shutdown of the near reactor, the number of interaction events induced by the residual radiation from it in the detector per unit time decreases by a factor of about 200, falling down to a value of day-1 t-1, which is approximately 25% of the signal from the far reactor. After that, the signal from the residual radiation decreases smoothly (see Fig. 4) until the discharge of the spent fuel begins, which significantly affects detector readings.
Obviously, these cases require a new approach to processing and analyzing experimental data.
5 CONCLUSION
The effect of the equilibration of the reactor-antineutrino spectrum on the cross section for the inverse-beta-decay process (1) with the threshold of 1.8 MeV has been considered. The increase in the antineutrino flux due to an increase in the cross section (this effect was previously ignored) is about 0.6% over the reactor operating period. This value is commensurate with the accuracy (the standard error is 1.4%) in the measurement of the cross section itself. A correction at this level must also be introduced in the ratio of the measured cross section to the cross section calculated on the basis of the antineutrino spectrum that was determined independently and which corresponds to one day of reactor operation.
We have calculated the additional contribution to the antineutrino spectrum from neutron capture by fission products and determined the corresponding increase (0.2%) in the cross section for reaction (1). It has been found that corrections previously ignored in the standard experimental scheme aimed at searches for neutrino oscillations (one detector and near and far reactors) may be as large as 25%.
ACKNOWLEDGMENTS
We are grateful to Prof. K. Schreckenbach for placing valuable information at our disposal and to our colleagues participating in the CHOOZ collaboration for stimulating discussions. This work was supported by the Russian Foundation for Basic Research (project nos. 00-15-06708 and 00-02-16035).
References
- [1] V. I. Kopeikin, L. A. Mikaelyan, and V. V. Sinev, Yad. Fiz. 61, 2222 (1998) [Phys. At. Nucl. 61, 2109 (1998)].
- [2] V. I. Kopeikin, L. A. Mikaelyan, and V. V. Sinev, hep-ph/9904384; Yad. Fiz. 63, 1087 (2000) [Phys. At. Nucl. 63, 1012 (2000)].
- [3] CHOOZ Collab. (I. Appolonio et al.), hep-ao/9907037; Phys. Lett. A 466, 415 (1999).
- [4] V. I. Kopeikin, L. A. Mikaelyan, and V. V. Sinev, Yad. Fiz. 60, 230 (1997) [Phys. At. Nucl. 60, 172 (1997)].
- [5] K. Schreckenbach et al., Phys. Lett. A 160A, 325 (1985); A. Hahn et al., Phys. Lett. A 218, 365 (1989).
- [6] P. Vogel et al., Phys. Rev. N 24, 1543 (1981).
- [7] P. Vogel, Phys. Rev. D 29, 1918 (1984); S. A. Fayans, Yad. Fiz. 42, 929 (1985) [Sov. J. Nucl. Phys. 42, 590 (1985)].
- [8] V. Vyrodov et al., Pis’ma Zh. Eksp. Teor. Fiz. 61, 161 (1995) [JETP Lett. 61, 163 (1995)]; Y. Declais et al., Phys. Lett. A 338, 383 (1994).
- [9] A. Achkar et al., Nucl. Phys. A 434, 503 (1995).
- [10] V. Vyrodov et al., Pis’ma Zh. Eksp. Teor. Fiz. 59, 364 (1994) [JETP Lett. 59, 390 (1994)].