IPPP/01/37
DCPT/01/74
CERN-TH/2001-273
Cavendish-HEP-2001/14
October 2001
MRST2001: partons and from precise deep inelastic
scattering and Tevatron jet data
A.D. Martina, R.G. Robertsb, W.J. Stirlinga and R.S. Thornec,111Royal Society University Research Fellow
a Department of Physics and Institute for Particle Physics Phenomenology, University of Durham, Durham, DH1 3LE
b Theory Division, CERN, 1211 Geneva 23, Switzerland
c Cavendish Laboratory, University of Cambridge, Madingley Road, Cambridge, CB3 0HE
We use all the available new precise data for deep inelastic and related hard scattering processes to perform NLO global parton analyses. These new data allow an improved determination of partons and, in particular, the inclusion of the recent measurements of the structure functions at HERA and of the inclusive jets at the Tevatron help to determine the gluon distribution and better than ever before. We find a somewhat smaller gluon at low than previous determinations and that .
1 Introduction
Recently a great deal of new data have become available which help to determine the parton distributions of the proton. In particular we have new measurements of the structure functions by the H1 [1, 2, 3] and ZEUS [4] collaborations at HERA, and of the inclusive jet distribution by the D0 [5] and CDF [6] collaborations at the Tevatron. These new data are both more precise and extend the kinematic range, and thus constrain the parton distributions, and the strong coupling , more tightly than ever before. ZEUS have also released a new measurement of the charm contribution to the structure function [7] which, although it still has large errors, covers a wider kinematic range than previously. In addition, the CCFR collaboration [8] have re-analysed their neutrino data in a model independent way and the discrepancy with the NMC data for has been largely resolved. Also NuTeV data are becoming available [9], both for single and double muon production, and are improving the constraints from the neutrino sector. The E866 collaboration [10] also have increased statistics for and Drell-Yan production and improve the determination of the difference between the and distributions. Finally we note that as well as the usual data sets used in our previous fits, i.e. BCDMS [11] and SLAC [12] proton data, NMC proton and deuterium data [13], E665 proton data and deuterium data [14], CCFR data on [15], E605 Drell-Yan data [16] and CDF -asymmetry data [17] we have also included BCDMS [18] and SLAC deuterium data [12] in order to obtain as precise a determination of the separate contributions of the up and down valence quarks at high as possible.222For all deuterium structure functions we correct for shadowing effects [19]. We also include the most recent ZEUS SVX data [20] since it spans a slightly different range to that in [4]. We no longer include prompt photon data due to theoretical problems and possible inconsistencies between data sets, and instead allow the high gluon to be determined by the vastly improved Tevatron jet data.
We note that both H1 [3] and ZEUS [4] have recently performed NLO DGLAP fits to their respective data, supplemented in the former case by BCDMS data with , and in the latter case by BCDMS, NMC, E665 and CCFR data. In particular, the H1 analysis determines and the gluon simultaneously. A value
| (1) |
is obtained, with an additional uncertainty of about , mainly due to the uncertainty in the renormalization scale. A preliminary ZEUS analysis, reported at DIS2001, quoted [21]. There is also an analysis including some of both the recent H1 and ZEUS data along with NMC, SLAC and BCDMS data, and which allows higher twist contributions, which obtains [22]. We will find that the inclusion of additional data sets tend to increase these values somewhat. As an example of this we emphasize that the Tevatron jet data are an important ingredient in pinning down the value of from deep inelastic scattering (DIS) and related data, since they provide the dominant constraint on the gluon at large . In fact, the inclusion of new jet data [5, 6] into the global analysis considerably improves the determination of the gluon. For example, we find an uncertainty of about 15% on the gluon distribution at and , but this is correlated with the value of .
2 The new optimum parton set
We perform a global NLO DGLAP analysis incorporating all the high-precision data mentioned in the Introduction. The evolution begins at where there are three active quark flavours. We work in the renormalization scheme and use the Thorne-Roberts [23] variable flavour number procedure to evolve through the charm and bottom thresholds. We note that we let all data sets in the fit carry equal weight. This is because we now feel that the full set of data is spread relatively evenly over the kinematic range of and , and also over the different partons, e.g. the Tevatron jet data is now extensive enough to determine the high gluon accurately, and we no longer have to give existing data a high weight to tie down this particular region of parton space. In fact those data sets with very few points, e.g. the E866 Drell-Yan asymmetry measurements, probe partons (in this case ) to which the rest of the data are rather insensitive, and the few points with unit weight are sufficient. We note that our best fit gives a per point of about 1 for all data sets (except for the E605 Drell-Yan data, for the reason given in section 6) justifying the equal weighting.
As well as deciding on data sets and weights, we have to decide on a set of cuts in the usual variables , and . In order to investigate this we made a study of the sensitivity of the analysis to variation of these data cuts. We discovered that there was only marginal evidence for an improvement in quality if the cut was raised from to and no marked improvement above this. There was a marked improvement in quality if is raised from our previous cut of until we reach , which may easily be interpreted as due to the influence of higher twist and/or large terms in the perturbative expansion. Hence, for the global fit presented below DIS data with and are included, in order to exclude regions where higher twist and/or higher orders in are expected to play an important role. We also found that if a lower cut in was introduced there was continual improvement in the quality of the fit until reached a value of about 0.005, suggesting that terms in the perturbative series may be important. The results and consequences of these cuts, particularly that in , will be dealt with in a future paper [24], but for the present analysis we take the conventional approach of not using any cut and investigate/suffer the consequences.
The optimum global NLO fit is obtained with the starting parameterizations of the partons at given by
| (2) | |||||
| (3) | |||||
| (4) | |||||
| (5) |
The flavour structure of the light quark sea is taken to be
| (6) |
with , as implied by the NuTeV data [9], and where
| (7) |
The masses of the quarks are taken to be and , the former giving the best fit to the charm structure function data. The optimum fit corresponds to , i.e. , in very good agreement with the world average.333We use the matching between the - and -flavour couplings calculated in [25], and corrected in [26], up to NLO in . At this order the coupling is continuous across threshold but the derivative is discontinuous. More details may be found in section 3 of the first of [23]. We estimate the error in due to the errors on the data fitted in the global analysis to be about , as will be explained in detail later. The resulting partons are shown in Fig. 1.
The improved HERA data greatly increase the constraints on the gluon at small . The extra term in (5) is required to achieve an acceptable fit, and allows the starting gluon to become negative at small . A fixed behaviour is incorporated in this extra term so that only the small form of the gluon is affected. Not including this additional term, which allows the input gluon to be negative at small , would lead to the input gluon being strongly valence-like and to a global increase in of about 100. Note that only half this increase comes from the data points at very low (say ), the rest coming from the HERA and NMC points in the region , as will be discussed in the next section. The gluon in the present analysis becomes positive for all and , and for for . We note that while a negative gluon distribution may be slightly disturbing, there is no real reason for worry since the gluon distribution is not a real physical quantity, particularly in a somewhat unphysical factorization scheme such as . The implications for physical quantities will be discussed in the next section.
Recall that in the MRST99 analysis [27] the uncertainties in the gluon were illustrated by presenting the optimal fit together with two fits and , with larger and smaller gluons at large , which represented the extremes of acceptable descriptions of the data. The present analysis, with greatly improved data, significantly reduces the uncertainty in the gluon distribution and yields an optimal solution with a large gluon nearer to than to . For this reason in Fig. 2 we compare the present partons with those of the set of MRST99 [27]. We see that the major difference is in the gluon, or is a consequence of this changed gluon. First, we note the extended parameterization for the gluon, required by the new HERA data, leads to a far smaller gluon at the lowest and . Since the quarks are determined by evolution driven by the gluon in this range, they are also smaller than their MRST99 counterparts. The gluon is also smaller in the range than that for MRST99 — the jet data requiring less gluon in this range than the prompt photon data with no intrinsic included. Both these reductions in the gluon allow for slightly more gluon in the range , giving an increased for a little below this. The shape of the charm (and, to a lesser extent, the strange) distribution simply follows the gluon since it is generated mainly by evolution from the gluon. Finally we note that the down quark is slightly smaller at high than in MRST99 due to the effect of the extra deuterium data included in the present fit, and as a consequence it is slightly larger for values of in the region of .
3 The description of the DIS data
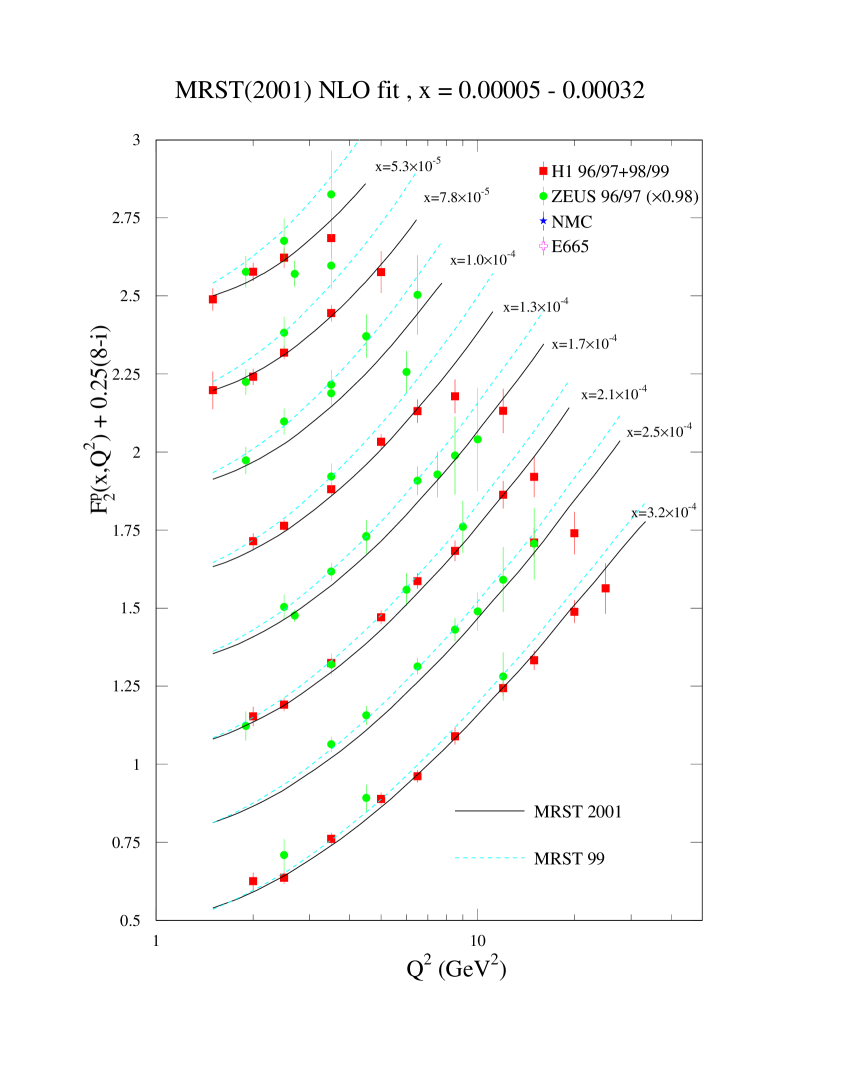
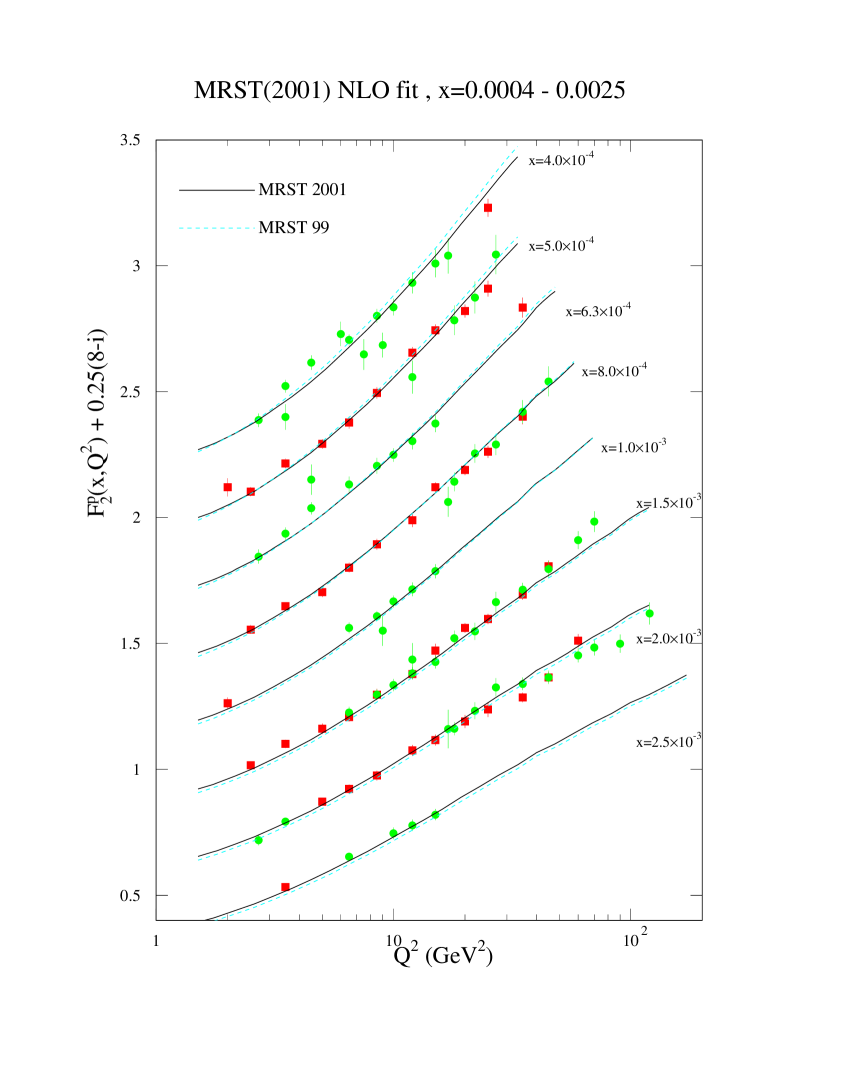
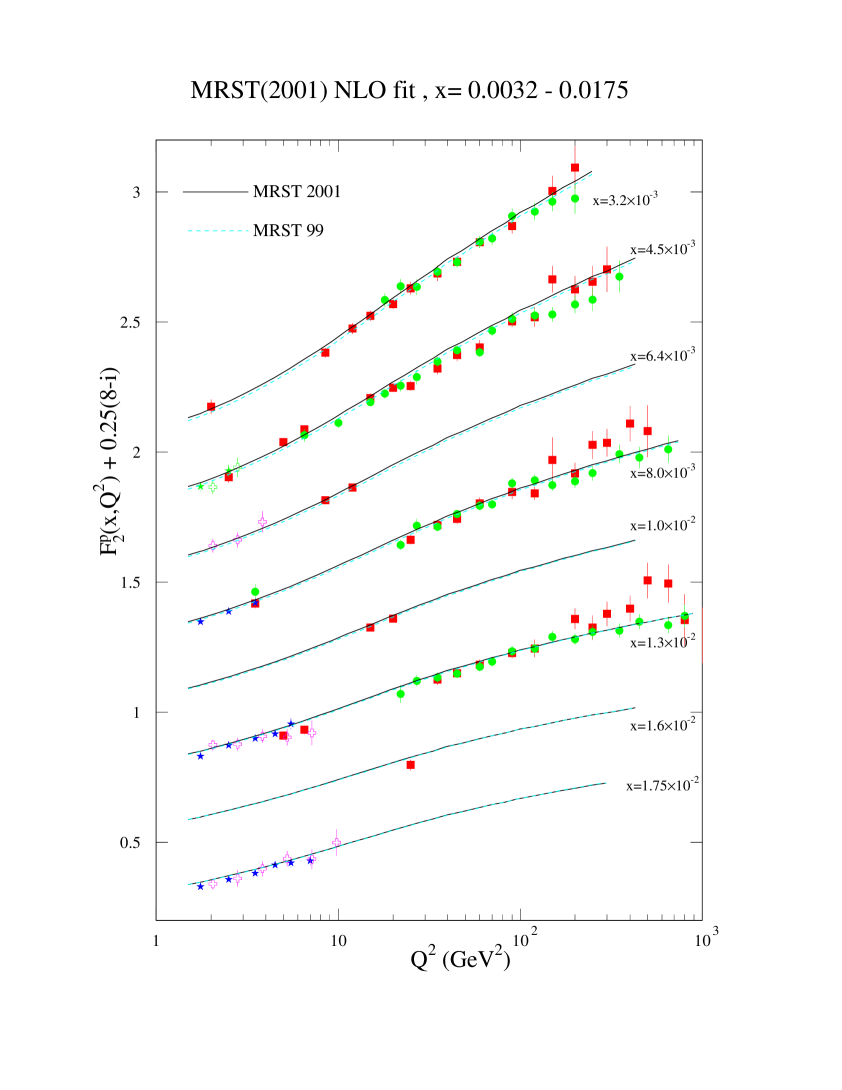
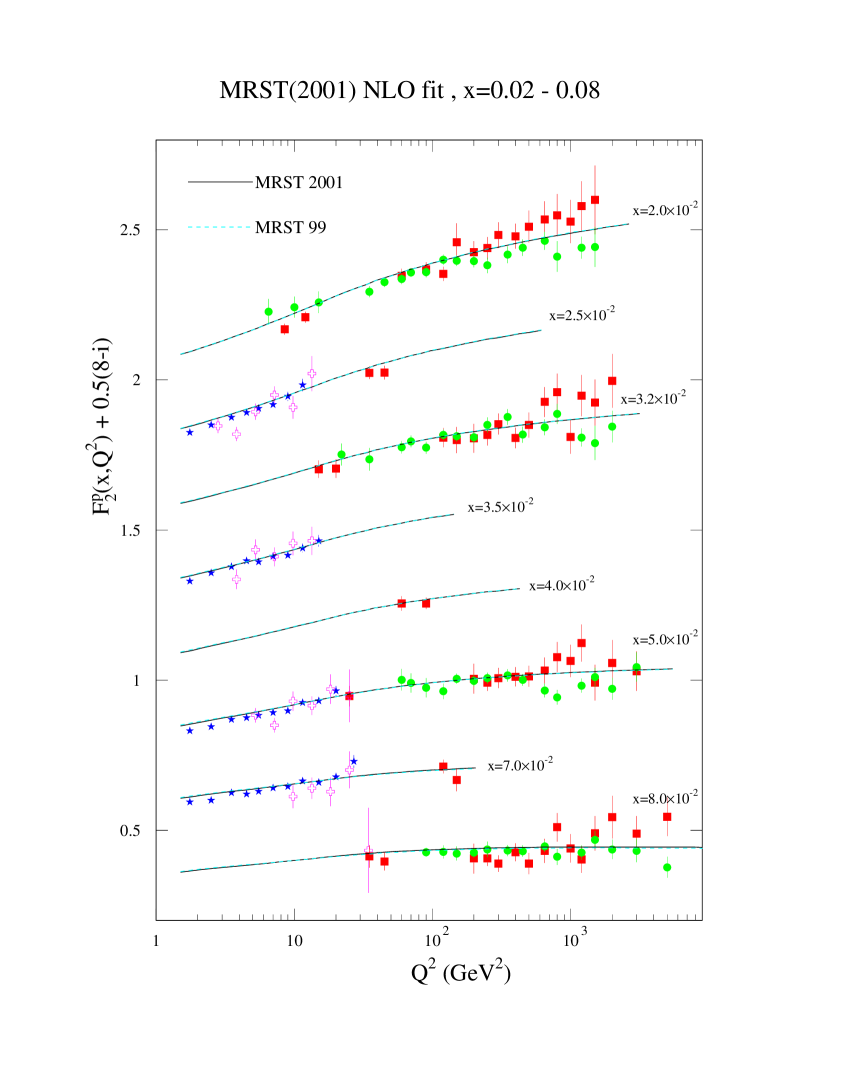
A good description of the HERA data is obtained, as can be seen from Figs. 3-6.444Note that as in previous fits we have effectively fit the published cross section rather than at the larger values of , i.e. we have corrected for our own values of rather than use those obtained by the fits by the experiments. Compared to MRST99, the curves for are flatter in for , but slightly steeper at higher . In fact for the data, particularly the high H1 and the NMC data, would prefer a higher , as can be seen in Figs. 5 and 6, where the low NMC data is consistently below the theory and the high H1 data is mostly above the theory. It appears as though the ZEUS data at high tend to lie below the H1 data, and are more consistent with the fit. However, we note that the preliminary ZEUS 98-99 data for [28] seem to be more in line with the H1 data and prefer a steeper slope (i.e. they lie consistently above MRST99 and hence would also be above MRST2001). The systematic failure in this region of is a cause for concern regarding the validity of an NLO fit. In fact we note that the aforementioned improvement to the fit in this region, which comes from allowing the negative input gluon at small , is because this form allows there to be more gluon in the moderate region (from the momentum sum rule), and hence a larger value of , as preferred by the data. We also note that although at the lowest and our gluon distribution is considerably negative, is quite clearly positive. This highlights the fact that the frequently quoted relationship is not even approximately true at small and when one works beyond leading order in perturbative QCD. Qualitative arguments about evidence for saturation etc. which rely on this relationship should be treated with caution.
The fits to HERA data have been performed using the simplistic procedure of adding the systematic and statistical errors in quadrature. However, we have actually performed an analysis of the effects of the correlated errors. To be specific we have first performed fits to the data with only uncorrelated errors, then let the contributions of the correlated errors come into effect, and finally iterated. We find that the absolute value of the using this procedure increases for the ZEUS data, and stays more or less constant for the H1 data, but that somewhat surprisingly the position of the minima and incremental changes in when comparing different theoretical results stays much the same as when using the more simplistic addition in quadrature of all errors. Hence, we decide to present the simpler procedure in determining the partons, and discuss details of the effects of correlated errors in an Appendix since the results with full errors turn out to be an unnecessary complication. We do however let the ZEUS normalization go to its lower limit of in our fits in order to obtain the optimum description.
The comparison with the charm data [7, 29] can be seen555Updated charm data from the H1 collaboration have recently become available [30], but the results depend on which Monte Carlo is used to extrapolate over the full range of phase space. Since these data are similar to their previous charm data [29], we show only the latter in Fig. 7. in Fig. 7. As one can see it is of a perfectly acceptable quality, and the errors on this data are still large. There is, however, a slight tendency to undershoot the data at the lowest values of and , and this may be a sign of the need to improve the theoretical treatment in this region. In this region of low and the prediction for the charm structure function is a little smaller than that for the MRST99 partons, which is entirely due to the smaller gluon we now find in this region. Finally we note that the fit to the higher EMC charm data [31] is very similar to that for the default set in Fig. 27 of [32] (the high gluon is now a little larger, but is rather than ), and hence is perfectly acceptable.
The prediction for is shown in Fig. 8, which also shows the prediction of the MRST99 partons. We see that the increased precision of the HERA data and the increased flexibility of the gluon parameterization have led to a significant decrease in the prediction for at low and , replaced by a slight increase for . Indeed, it now seems as though is taking a distinctly unphysical form for low and , and for part of this range is negative, and therefore certainly disallowed.666In principle, it is internally inconsistent to fit to data in a region where the predicted values of are negative, namely and . Since only 6 points are affected, carrying practically no weight in the fit, we do not remove these points. This is a direct consequence of the negative nature of the gluon distribution at small and , and may be taken as another clear sign that the standard NLO fit is not working completely properly at small .777We do not compare to the H1 extraction of [33] since the different assumptions used in our fit lead to significantly different forms for the gluon and for , and hence different extrapolations into the high region. As far as we are aware is the most direct probe of the gluon distribution at small and , and is the most appropriate quantity to examine in order to see the real pathological effects of the negative gluon distribution. is less sensitive since at low the kinematic constraint on charm production () means one is probing the gluon at higher than for , and as seen in Fig. 7, is perfectly well behaved down to .
At higher the main change in our fit is due to the reanalysis of the CCFR data [8]. Their reanalysis no longer extracts by modeling both and , but now extracts either or (there is a high degree of correlation between these) and separately in a Physics Model Independent manner. This has gone a long way towards resolving the apparent discrepancy between CCFR and NMC data on , where it had previously been impossible to simultaneously fit both for . The quality of the fit to the new CCFR data is shown in Fig. 9. Overall the fit is very good. One might argue that there is still a systematic problem at the lowest , but this is far less pronounced than with previous analyses. There is also potentially a small error associated with the shadowing corrections (details of which are found in [32]) which we do not account for. The reanalysis has also established the validity of the previous neutrino data. These data are essentially unaffected by the reanalysis, but we are now confident in using the data over the whole range, rather than just for . The fit is good over the whole range of . Note that we normalize the complete set of CCFR data up by in order to obtain the best fit.
Other than this, the other new DIS data (at least new for our fit) at high are simply the SLAC and BCDMS deuterium data, which we have introduced for the first time. The fit to these data is shown in Fig. 10. It is of a perfectly acceptable quality, and one can see that, as with the proton data, the SLAC deuterium measurements prefer a rather steeper fall with than the BCDMS data, and consequently a larger . The SLAC data are normalized up by and the BCDMS down by .
4 Tevatron Jet Data and the Gluon
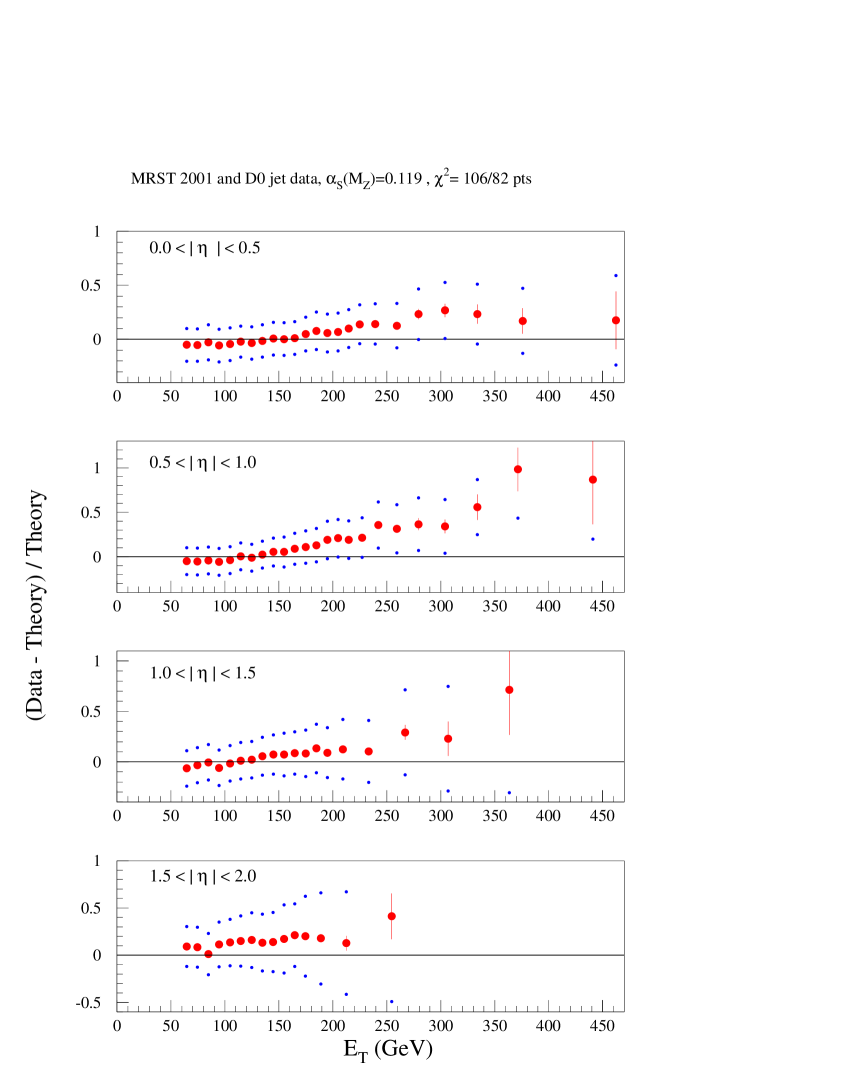
One of the major differences between the MRST2001 partons and our previous parton sets is the manner in which the high Tevatron jets have been included. In the past [32] we have simply checked that there is reasonable agreement with our predictions and the jet data. The difficulties in using the prompt photon data in order to determine the high gluon combined with the considerable improvement in Tevatron jet data [5, 6] has led to a change in emphasis. Besides the increase in precision, the D0 jet data are available in a range of rapidity intervals and so constrain the partons, and the gluon in particular, over a much wider range. We, therefore, now include the D0 and CDF jet data in the global fit on an equal footing with all other data sets.888The D0 collaboration have recently produced data using the algorithm rather than the more usual cone algorithm [34]. The agreement between the two methods is moderate, the major difference being at low . We use the original data since we feel these have been more extensively studied, and because they also cover a much wider range in pseudo-rapidity. However, because in this case the correlated systematic errors are the dominant source of error, being much larger than the uncorrelated errors, it is imperative to deal with these in a correct manner. In fact we adopt the same method of fitting to the data as do the respective experimental collaborations when describing their own data. Note, however, that rather than using some NLO prescription such as JETRAD [35] or EKS [36] to generate an NLO correction for each point, we derive a smooth NLO K-factor by fitting to a set of such points. Since the NLO corrections generated from the above programs have some error and scatter, this means that our value of will not be identical to that obtained by the experiments themselves for the same parton set (though it will be very close). In particular our values of for the CDF1B jet data are a little higher, while for the D0 jet data they are slightly lower.
We find that for our best global fit we obtain a reasonable description of the combined jet data with a of 170 for 113 points. The quality of the fits is shown in Figs. 11 and 12 — the error bars account for uncorrelated errors alone. In both cases it is clear that while at the low end the normalization is about correct, at higher (and rapidity) the theory lies below the data. An acceptable fit is then obtained by accounting for the correlated systematic errors.
First, for the CDF1B fit the (datatheory) obtained is allowed to move by letting data move relative to theory by application of each of the sources of correlated error, i.e. the is obtained from
| (8) |
with
| (9) |
where is the theory prediction for data point , is the measurement with uncorrelated error , and is the one-sigma correlated systematic error for point from error source . Hence, the data and theory move relative to each other at the cost of an increase in of , where is the fraction of one-sigma which has been utilized for each error source.999Since these correlated errors are expected to cut off rather more sharply than Gaussian errors we limit each to 1. This does not affect any results at all significantly. Hence in Fig. 12 we see that the effect of introducing the error correlations has been to bring down the data at higher significantly in order to match the shape of the theory prediction. This large shift requires many of the to be of the order of 1, and for them all to conspire to move the data in the same direction relative to the theory.
For the D0 jet data the fit is performed using the full error matrix, i.e.
| (10) |
where are the covariance matrix elements defined by
| (11) |
where runs over all sources of error, is the error of point and is the correlation between points and . This is actually a very similar way to obtain a to the previous method (see Appendix A of [6]). However, it accounts for the correlated systematic errors in a rather less transparent manner, though the good fit to the D0 jet data must clearly be obtained in much the same way. We illustrate the correlated errors in Fig. 11 simply by introducing a band with width given by adding each source of correlated error in quadrature. Although this is not as explicit as in Fig. 12, it indicates roughly how the data may move relative to the theory without a large cost in .
At the central value of of 0.119, this global fit (including jet data) allows a variation in of about for and , which corresponds to accuracy for and . This is a factor of 3 or so less than the MRST99 variation of the gluon ranging from the to the gluon, and hence we do not provide parton sets with gluon extremes. Since the body of jet cross section data is (very roughly) , then for of order is roughly inversely proportional to . However, at high the gluon distribution decreases more rapidly with increasing , the larger the value of the coupling. This increase in speed of evolution with increasing more than compensates for the decrease in the high-scale gluon required by the jets with , and for low () the high gluon increases as increases.
We note, however, that these optimum global fits are not the best possible fits to the high jet data. The fit is only achieved by compensating for the smallness of the theory at high jet and (both of which probe the highest ) using the correlated systematic errors. Hence, the fit can be improved by an increase in the size of the high gluon. In principle it is possible to obtain a fit with a of about 120 for the 113 points (see below) rather than , the scatter of data points making this value about the lowest that is achievable. At the central value of 0.119 it is possible to raise the high gluon sufficiently to improve the quality of the jet fit to , but only at the cost of for the rest of the data. This is mainly at the expense of the description of the moderate DIS data, i.e. H1, ZEUS and NMC data, since the increase of gluon at high is countered by a decrease at intermediate , and hence a decrease in . At lower the price is even higher since the lower already impacts upon the behaviour of .
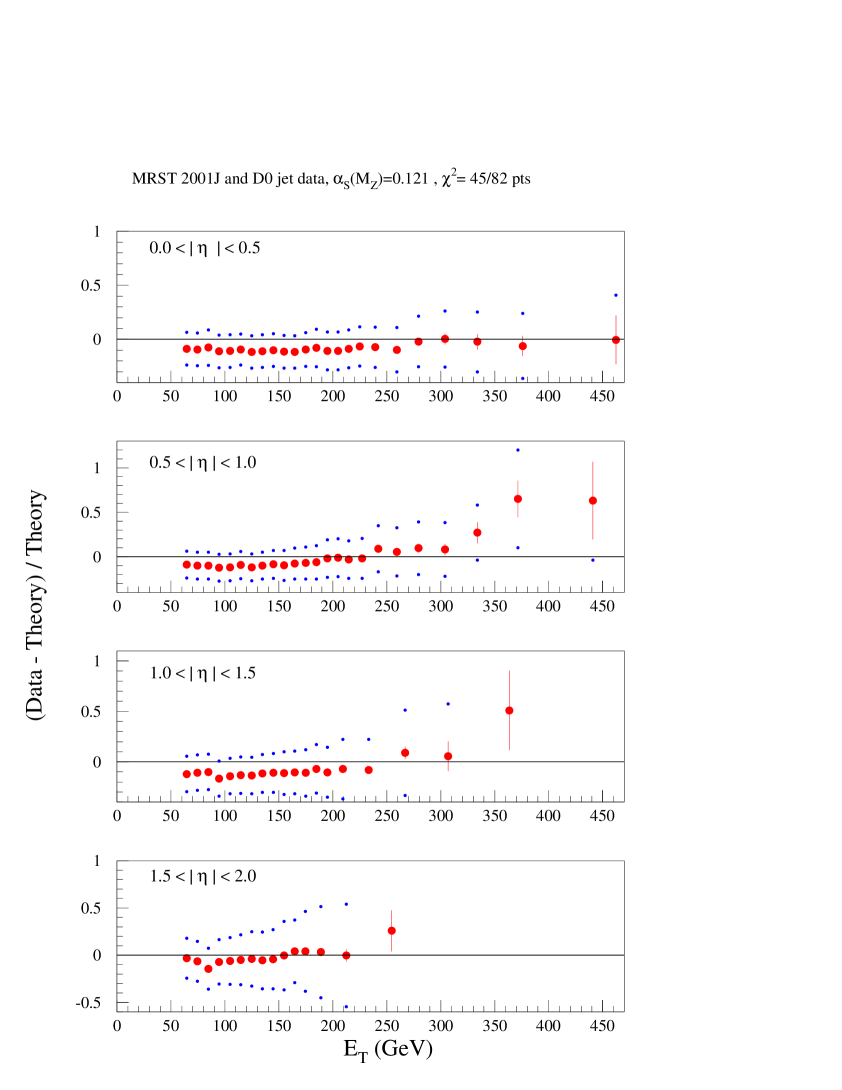
However, as one goes to higher the situation changes. At one can obtain a fit to the jet data with , and where this improvement is only marginally overcompensated by the deterioration in the rest of the fit compared to the best global fit. For this set of partons, denoted by MRST2001J or simply J, the fit to the jet data is shown in Figs. 13 and 14. For the fit to the D0 data the shape is obviously greatly improved, both as a function of and of , demonstrating that the apparent excess in the description of the Tevatron jet data is either a problem of parton distributions or of systematic errors, but is unlikely to be a sign of new physics. The normalization of the theory is a little high, but this is easily accounted for by the systematic error in normalization. The fit to the CDF1B data actually gives a slightly worse than before. But now the fit does not rely on a large shift of data due to systematic errors, and is perhaps more satisfactory in this sense. The problem with this J set of partons is the behaviour of the gluon. The input form at is
| (12) |
which is shown in Fig. 15, together with the behaviour at . We see that the input shape has a rather worrying “kink” which results in the distinct “shoulder” at .101010This seems to be made possible by the interplay between a very large coefficient for the first term in (12), the large power of , i.e. in this term, and the extra effect of the second term controlling the very small behaviour. This second term then effectively frees one parameter in the first term, which for previous parton sets represented the full parameterization of the input gluon, allowing more flexibility in the high form of the gluon. We do not deem this to be an acceptable gluon (admittedly a subjective decision), and rule this fit out, although we do make the MRST2001J set of partons available. At we obtain a similar result, i.e. the best overall fit gives about for the jet data, but has a gluon with the same type of peculiarities (though less severe). Again we rule this fit out. Hence, in our fits we impose the condition that does not change sign in the region of high which rules out the possibility of both kinks and shoulders in the high gluon distribution. Imposing this condition results in a fit to the jet data within the global fit which is roughly independent of .111111We note that a very good fit to the jet data could be achieved for with a gluon without peculiarities, but that this results in a fit to the rest of the data which is very poor. This problem is improved, though not completely rectified, when an -cut is applied (see [24]).
5 Description of other data
The fit to much of the rest of the data is very much along the lines discussed in detail in [32]. The NuTev data [9] on single and double muon production do not qualitatively change the conclusions regarding the strange contribution to the sea already indicated by the CCFR dimuon data [37], i.e. that the strange distribution is acceptably obtained from half the average of the and distributions at . Similarly the E866 collaboration [10] have provided new data on the Drell-Yan asymmetry which is more accurate and extends the kinematic range slightly, but does not really change the relative behaviour of the partons. In particular, our simple parameterization of still suggests that for , but there is no evidence whether this is really true or not. The lepton rapidity asymmetry data from CDF [17] (related to the rapidity asymmetry) also continue to give us important information on the ratio.
Finally the E605 Drell-Yan data [16] still play an important role in pinning down the form of the sea quarks at high . However, they also play an important and unexpected role in influencing the fit to the jet data and determining . As we will see below, the quality of the description of these data deteriorates as increases. This is actually an indirect effect. As increases, the high gluon at lower increases so as to give the correct gluon normalization when evolved up to the scales appropriate for the description of the jet data. This larger high gluon (and larger ) drives a positive evolution of the high sea quarks. As this effect becomes more significant it distorts the shape of the sea quark distribution in the range relevant for fitting Drell-Yan data, worsening the fit. Therefore the E605 data prefer lower value of and a lower high gluon. Indeed, for the MRST2001J type partons the fit to the Drell-Yan data deteriorates quite seriously compared to the best global fit. Hence, these data have assumed a more important role in the context of the whole global fit than previously.
6 Quality of Fit and Determination of .
The quality of the central fit for the major data sets is shown in Table 1 below. For each of the smaller data sets, e.g. CDF -asymmetry [17] and E866 Drell-Yan asymmetry [10], the per degree of freedom is about 1 per point. For all the DIS data sets the numbers are quoted for statistical and systematic errors added in quadrature. The quality of the fits to the individual data sets is satisfactory. For the E605 data the systematic errors are quoted in a slightly ambiguous manner, and are generally subdominant, and so we fit to statistical errors alone. Hence, the quite large in this case. The treatment of the correlated systematic errors for the Tevatron jet data has been discussed in Section 4.
| Data set | No. of | MRST | MRST | MRST | MRST |
|---|---|---|---|---|---|
| data pts | 0.117 | 0.121 | J | ||
| H1 | 400 | 382 | 386 | 378 | 377 |
| ZEUS | 272 | 254 | 255 | 258 | 253 |
| BCDMS | 167 | 193 | 182 | 208 | 183 |
| BCDMS | 155 | 218 | 211 | 226 | 219 |
| NMC | 126 | 134 | 143 | 127 | 135 |
| NMC | 126 | 100 | 108 | 95 | 100 |
| SLAC | 53 | 66 | 71 | 63 | 67 |
| SLAC | 54 | 56 | 67 | 47 | 58 |
| E665 | 53 | 51 | 50 | 52 | 51 |
| E665 | 53 | 61 | 61 | 61 | 61 |
| CCFR | 74 | 85 | 88 | 82 | 89 |
| CCFR | 105 | 107 | 103 | 112 | 110 |
| NMC n/p | 156 | 155 | 155 | 153 | 161 |
| E605 DY | 136 | 232 | 229 | 247 | 273 |
| Tevatron Jets | 113 | 170 | 168 | 167 | 118 |
| Total | 2097 | 2328 | 2346 | 2345 | 2337 |
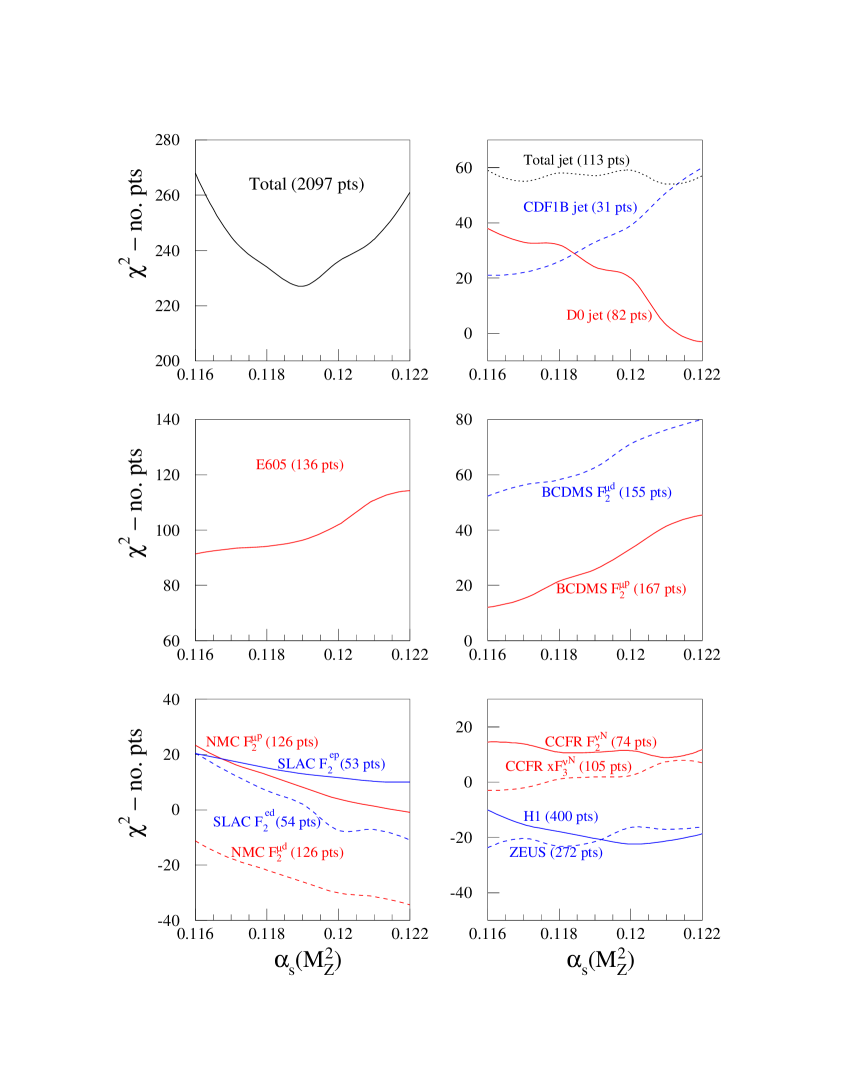
The way in which the quality of the fit to both the total and to each data set varies with is shown in detail in Fig. 16. It must be remembered that the quality of the fit for a single data set within the context of a global fit is not the same thing as the quality of the fit for that set alone, and many sets influence each other strongly. Nevertheless, one can pick out some interesting facts from Fig. 16.
For the DIS data sets it is clear that only the two BCDMS sets strongly prefer lower values of . These are more than compensated by the SLAC and NMC data sets, which for both proton and deuterium structure functions strongly prefer higher values of . Both CCFR data sets are relatively insensitive to the value of the coupling, at least for . This also appears to be true for the H1 and ZEUS data sets. However, this latter apparent insensitivity is due to the fact that the combined HERA data sets carry a lot of weight in the fit, and the gluon distribution at small is largely determined by ensuring that these data are fit well. This is therefore just a manifestation of the long-established fact that the small gluon and the value of are completely correlated in fits to the HERA data, and without any additional handle on the gluon121212The charm structure function is strongly correlated to the evolution of the total structure function, and therefore does not provide an independent constraint. there is no way to remove this. It is clear from Fig. 16 that if one takes only BCDMS data as well as HERA data, as in the H1 analysis [3], one will determine a low value of , but taking SLAC or NMC as the additional set a very different conclusion will be reached.
The combined Tevatron jet data behaves similarly to the HERA data, i.e. the gluon conspires with to give roughly the same for all . Interestingly the jet data and HERA data manage to conspire with each other so that the sum of their remains roughly constant. As increases the gluon at moderate and high increases to maintain the fit to the jet data. From the momentum sum rule this leaves less gluon at small , but the larger manages to keep the value of acceptable. The fact that this trade-off between HERA data and Tevatron jet data results in almost complete insensitivity to strikes us as remarkable. Note, however, that the constant total for the jets is made up of a contribution from the CDF1B data which increases sharply with increasing , and a rapidly falling contribution from the D0 jet data. In detail one finds that the general normalization and shape of the theory compared to data improves with increasing . This leads to the improvement in the fit to D0 data. However, the precise shape of the CDF1B data seems easiest to achieve by obtaining a poor comparison between theory and data which is then compensated for by quite large movements coming from the correlated errors. When the shape and size is nearly correct to begin with this seems to leave less room for maneuver for the correlated errors to produce exactly the correct shape (note that the is better in Fig. 12 than in Fig. 14). Hence, if one is uncomfortable about letting the correlated errors conspire to move the data by a large amount the high fits are better.
Finally, as discussed in the last section, the E605 Drell-Yan data prefer a low value of . However, this is mainly due to the correlation between the value of and the high gluon brought about by the jet and HERA data.
Putting all the contributions together we obtain a total which has quite a sharp minimum at . We then adjudge the error in this best value of , within the context of an NLO-in- fit, by letting the increase by about 20 units. Clearly it is inappropriate to base the error on the increase of a single unit, for a variety of reasons. First, the treatment of the errors in this analysis is far from statistically rigorous, and even if it were, the errors themselves are far from having a true Gaussian distribution. Also, we have made many decisions in performing this analysis, such as data cuts, the choice of parameterizations of partons, etc. Changing any of these and refitting would lead to changes in of about for the remaining data, and so our increase in should be at least this value . Making our choice of an increase of 20 we obtain . We see from Fig. 16 that beyond these limits the global increases very quickly.131313We have also investigated the fits without the Tevatron jet data included. Even though removing this constraint allows gluons to migrate to lower and in principle fit the HERA data with lower , the overall impact on the global fit is not large. The minimum moves down by . For rather low values of , e.g. 0.116 or lower, the removal of the high gluon constraint does allow an improvement in the fit to HERA and NMC data, but at this value of the global fit has become much worse anyway, and all one would obtain with jet data removed would be a shape for the total like that in Fig. 16, but with the slope on the left-hand side a little more shallow.
Thus, we present our determination of as
| (13) |
We do not adopt the traditional, but ad hoc, manner of obtaining the theoretical error by varying renormalization and factorization scales up and down by factors of 2 (or of 4). This takes no account of the errors attributable to higher order logarithmic enhancements. For example, in DIS there are additional logarithms in and in the coefficient functions and splitting functions at higher orders in which variations in scale tell us nothing about. Similar logarithmic enhancements also exist for the other quantities fitted, such as data near threshold. Hence, we obtain our theory error by comparing with alternative theoretical treatments which do tell us something more concrete about the missing corrections, i.e. approximate NNLO fits e.g. [38], or fits which attempt a resummation of and terms [39]. These suggest that is an appropriate theoretical error.141414These investigations suggest that might move down slightly from 0.119.
As regards the errors on the partons themselves, in a separate study we will present the uncertainties in the predictions of key observables, and show how they reflect the uncertainties on the parton distributions. An example of this is seen in [40]. However, as in the case of , we believe the theoretical errors to be generally more important than the experimental errors, particularly in some regions of parameter space.
7 Conclusions
In this paper we have performed global analyses of all the most up-to-date data on deep inelastic scattering and related processes in order to best determine the parton distributions and the value of within the context of a conventional NLO fit. This is an improvement on our previous analyses mainly because of some very important new sets of data. In particular the new HERA data [1, 2, 3, 4] are far more precise than previously and cover an extended range in and . Also the new D0 and CDF Tevatron jet data are again more precise, with systematic errors which are better understood, and which extend their previous kinematic ranges. These new HERA and Tevatron data sets together impose far more stringent limits on the parton distributions than ever before. We also obtain a tight constraint on the value of . Our best overall fit corresponds to , and investigating variations about this minimum we obtain . The quality of the fits for the two experimental limits of and can be seen in Fig. 16, and are also detailed in Table 1.
The new data sets have a particularly strong impact on the gluon distribution. In order to fit the new HERA data well we have been forced into an extension of our previous input gluon parameterization, allowing it to become negative at small . Indeed at it behaves like for , and this is necessary not only to obtain a good fit at low and , but also to allow enough gluon at higher to obtain large enough for , and enough gluon at large for the Tevatron jets. As increases the very small gluon becomes more negative. This is due to a combination of factors, i.e. the change of gluon needed by the jets at high and by at medium , but the most obvious explanation is that as increases the positive effect of the quark-gluon splitting function at very small increases (particularly the NLO contribution), and the gluon in this region correspondingly decreases. The result of a negative gluon at low and has been confirmed by backwards evolution in [21] (and to a lesser extent in [3]). It will be interesting to see whether a similar conclusion is obtained by other analyses [41, 42]. We anticipate that the evolution from positive definite parton distributions at very low scales [42] will be very difficult to sustain.
The Tevatron jet data constrain the high gluon (though from the momentum sum rule and convolutions performed in evolution equations it also affects lower ). These provide a far better constraint than any previous data, and from the best global fit we now estimate the uncertainty in the gluon distribution for and to be , with the error decreasing with increasing . This removes the need to produce the sets of parton distributions with extreme gluons that were presented in the MRST98 [32] and MRST99 [27] analyses. There is, however, the caveat that if we were to allow the input gluon to have a rather unusual shape and also let be we can produce a fit which is much better for the jet data, without too great an expense in for the rest of the data. The best possible jet fit is obtained for , and the parton set is denoted by MRST2001J. The gluon is shown in Fig. 15, and the quality of the fit using this set of partons is shown in Table 1. We see that the total is not much higher than the central fit, and is better than the nominal fit for . In particular the large high gluon helps to counter the deterioration in the fit to BCDMS data for increasing coupling, but has a poor effect on the Drell-Yan E605 data (as discussed in Section 5). However, we reject this as an acceptable set because of the structure in the form of the high gluon at low scales, but make it available as an alternative set. It is in some senses similar to the CTEQHJ parton set [43] obtained by forcing the best fits to previous high jet data, but does not seem to have quite the same features and moreover, we find that our very good fit to jet data can only be achieved without a huge cost in to the fit to other data for .
Other than the gluon, and the heavy quark distributions which are generated entirely by evolution and mainly from the gluon, there are no really dramatic changes in our parton distributions, as can be seen in Fig. 2. The inclusion of more deuterium data has caused a slight decrease in the high down quark distribution, and a corresponding increase for , but there is nothing else too significant. Indeed, our central value of has not changed much either. Though the changes are small, it is important to quantify their influence on the precision predictions of the and production cross sections at the LHC and the Tevatron. Table 2 shows the changes in the predictions for these cross sections when going from the default MRST99 parton set [27] to the present set where, for ease of comparison, we have kept the electroweak parameters unchanged. We see that the predicted cross sections have increased by about 1%. This is partly caused by the increase in the down quark distribution in the relevant range, see the second plot in Fig. 2. The uncertainty of such predictions and the influence on the parton uncertainty will be the subject of a future paper.
| MRST99 | MRST2001 | ||
|---|---|---|---|
| Tevatron | 2.45 | 2.48 | |
| 0.226 | 0.228 | ||
| LHC | 20.3 | 20.5 | |
| 1.87 | 1.89 |
As a final point we note that the overall quality of the NLO-in- fit remains fairly good. The raised cut in , from to has removed some deficiencies in the high slope which may be due to higher twist or higher orders in . Also, it is noticed that investigating cuts in implies little evidence for higher twist at general . However, some of the previous areas of concern have been increased rather than reduced. It is a worrying point that the minimum values for many individual data sets within the global fit (Fig. 16) lie outside the range . Also, as in previous fits, there is also still a struggle to get a steep enough evolution of in the region as is seen in Figs. 5 and 6. Moreover, it is also difficult to obtain enough high gluon to get a very good fit to the jet data. These two points, coupled with the rather slow evolution of at the lowest , combine to produce a gluon which has gone from being valence-like to very negative at the input scale . While this is not necessarily a problem in itself, it has resulted in a prediction for that is worryingly small at very small (Fig. 8). Hence there are implications of problems at small . We have not really considered the effect of a lower cut in this paper, but will demonstrate in a future paper [24] that investigating fits with low data cut out does have a serious effect on the partons and has strong implications on the real success of the standard NLO-in- fit at low . Remember that in the same way that the high form of the gluon imposed by jet data influences small via the sum rule and convolutions, cutting out small data can influence the fit and partons at higher . However, the effect of varying the cut on the value of is minimal, since the major constraint comes from the evolution of the high partons. It is, therefore, not surprising that the value remains well within our quoted experimental error, . On a related point we have already noticed that extending the theory to (an approximate) NNLO-in- does lead to a general improvement in the quality of the fit, and to some significant changes in partons and predictions, particularly at small . We have not considered NNLO at all here, but will produce detailed results in a forthcoming paper [38].
In summary, in this paper we have used all deep inelastic and hadron collider data available in order to obtain the most accurate and precise determination of the NLO parton distributions currently in existence, and have also determined the value of the strong coupling constant with tight constraints. This enables us to probe the success of the conventional NLO perturbative QCD framework in describing hadronic collider physics, and we find that overall it is still working well. This then provides us with the necessary starting point for predicting and explaining new physics coming from present and future particle colliders.
The FORTRAN code for the four NLO parton sets mentioned in Table 1 can be found at http://durpdg.dur.ac.uk/hepdata/mrs
Acknowledgments
We would like to thank Levan Babukhadia, Iain Bertram, Anwar Bhati, Arie Bodek, John Collins, Mandy Cooper-Sarkar, Brenna Flaugher, Brian Foster, Nigel Glover, Eram Rizvi, Olaf Ruske, Neils Tuning, Andreas Vogt, Rainer Wallny, Un-ki Yang and Rik Yoshida for useful discussions and information concerning the data. RST would like to thank the Royal Society for the award of a University Research Fellowship. This work was supported in part by the EU Fourth Framework Programme “Training and Mobility of Researchers”, Network “Quantum Chromodynamics and the Deep Structure of Elementary Particles”, contract FMRX-CT98-0194(DG 12 - MIHT).
Appendix
We have investigated the effects of fitting the HERA data [1, 2, 3, 4] taking into account the systematic errors in a consistent fashion. In order to do this we have adopted the same procedure as for the CDF jet data, i.e. in order to obtain the we use (8), which is also the procedure usually adopted by the H1 collaboration. As before we limit the size of each of the to be , though again this has little effect.
Let us discuss the fit to the ZEUS data first, since this is particularly simple. If we take our default fit and compare to the ZEUS data with uncorrelated errors only, we obtain a of 378 for the 242 points in [4]. If we keep the theory fixed and let the for the sources of correlated errors vary then lowers to 331. The way in which it does this is very simple – the majority of the data normalizes down to its minimum of , while that below takes its normalization down the further available . This seems to be essentially in order to bring the data into line with the H1 normalization (which matches well with that of the NMC data). All further changes are a very minor perturbation to this. Those error sources which could alter the shape, such as the positron energy scale and hadronic energy flow labeled type B, play no part, presumably because they would cause dramatic alterations in a few bins which would only lead to a deterioration of the fit.
The effect for H1 data is a little more complicated. The default fit using uncorrelated errors alone gives a of 485 for the 400 points. If we let the for the sources of correlated errors vary, then lowers to 381. This comes from 3 sources. Some of the low and points move up , coming closer to the ZEUS data. Some of the highest points use their large correlated errors to move up since they clearly fell below theory (and the extrapolation of BCDMS data). Finally, the biggest improvement comes from the region , where the low points move up by up to , and the high points minimize their normalization to move down by . These effects combine to flatten the slope with at fixed and partially reconcile the data with the failure of the theory to have a large enough in this range of .
Thus the data shift from their central values to partially account for either the incompatibility between H1 and ZEUS data, or between data and theory. If the data are then moved from their central values to those imposed by the correlated systematic errors and the fit redone there is to all intents and purposes no change in either or the partons, i.e the iteration essentially converges at the first step. To be precise, the value of for the best fit moves by less than , the quark distributions change by less than at all and , and the gluon distribution changes by a maximum of at , lowering to at and at .151515The percentage change in the gluon distribution is large at low in the precise region of where the gluon distribution becomes negative, but this is just due to the change in sign of the gluon here, and the absolute change is extremely small. Hence, the correlated systematic errors simply allow the data to readjust themselves to best match the possible theory and other data sets, but rather surprisingly the parameters in the theory do not alter at all significantly to rematch the altered data. We summarize the major effects. First, the normalization change of the ZEUS measurements, and of low , low H1 measurements brings the data sets closer together, but does not change the best fit, which is a still a compromise between them. Second,the raising of the high H1 data improves its description, but these data carry virtually no weight compared to NMC, BCDMS and SLAC data. Finally, the flattening of the intermediate data in again improves the fit quality, but is still too flat for these data even after the alteration, and also for NMC data, so the pull on the fit is only partly diminished.
In fact we also notice that the increments in between different fits are very similar when the correlated systematic errors are used in full to when the simple addition in quadrature of statistical and systematic errors is used. This can be seen by examining the fits for to using the iterative procedure described above. We find that although the base points of the curves for HERA data in the bottom right plot in Fig. 16 move (significantly for ZEUS), the shape and scale of the curves is extremely similar to those shown – there is a very slight tendency for the low to be lower and the high to be higher, but only by a couple of units. The refit in the second stage of the iteration results in the for other data sets changing, but only by a couple of points each, and in such a way that the total change for non-HERA data is only a couple of points in total. Hence, the curve for the total in the top left of Fig. 16 is changed by at most 3–4 units at each , except for the common shift, and all conclusions on parton distributions for the best fit and uncertainty of are unaltered. We have also examined more significant changes in theory curves by comparing to a theoretical model designed to work better at small . In this case the fit to H1 data gives a better description of , with a of 420, if uncorrelated errors alone are used. When correlated errors are allowed to contribute, no large correction is needed for intermediate so the improvement is of compared to above. In both cases the final values are within a 3–4 units of that obtained from the simplistic procedure. For ZEUS data the model gives a value 18 worse for quadrature, and 23 worse for the full treatment of errors, and in this case the increment when statistical errors alone are used is much the same.
Hence, the freedom of the data to move in the direction of preferred theory or other data when correlated systematic errors are properly accounted for lessens the pull on a fit compared to the use of uncorrelated errors alone, but for the present HERA data this seems to have a rather similar effect to the lessening of the pull obtained by adding statistical and systematic errors in quadrature. The relative success of this approximation is presumably due to the fact that for the vast majority of the data points the uncorrelated error is easily dominant, and correlated shifts in the data are rather smaller than the uncorrelated errors of most points. This is in contrast to the Tevatron jet data where, as we see in Fig. 12, the correlated shift can be an order of magnitude greater than the uncorrelated error of some points. Therefore, in our determination of the best fits, and the variations about these, we use the simple prescription for errors for the HERA data, since it does not lead to unnecessary complications, and does not change any results to any significant degree, as quantified above.
References
- [1] H1 Collaboration: C. Adloff et al., Eur. Phys. J. C13 (2000) 609.
- [2] H1 Collaboration: C. Adloff et al., Eur. Phys. J. C19 (2001) 269.
- [3] H1 Collaboration: C. Adloff et al., Eur. Phys. J. C21 (2001) 33.
- [4] ZEUS Collaboration: S. Chekanov et al., Eur. Phys. J. C21 (2001) 443.
- [5] D0 Collaboration: B. Abbott et al., Phys. Rev. Lett. 86 (2001) 1707.
- [6] CDF Collaboration: T. Affolder et al., Phys. Rev. D64 (2001) 032001.
- [7] ZEUS Collaboration: J. Breitweg et al., Eur. Phys. J. C12 (2000) 35.
- [8] CCFR Collaboration: U.K. Yang et al., Phys. Rev. Lett. 86 (2001) 2742.
- [9] NuTeV Collaboration: M. Goncharov et al., hep-ex/0102049.
- [10] E866 Collaboration: R.S. Towell et al., Phys. Rev. D64 (2001) 052002.
- [11] BCDMS Collaboration: A.C. Benvenuti et al., Phys. Lett. B223 (1989) 485.
- [12] L.W. Whitlow et al., Phys. Lett. B282 (1992) 475, L.W. Whitlow, preprint SLAC-357 (1990).
- [13] NMC Collaboration: M. Arneodo et al., Nucl. Phys. B483 (1997) 3; Nucl. Phys. B487 (1997) 3.
- [14] M.R. Adams et al., Phys. Rev. D54 (1996) 3006.
- [15] CCFR Collaboration: W.G. Seligman et al., Phys. Rev. Lett. 79 (1997) 1213.
- [16] E605 Collaboration: G. Moreno et al., Phys. Rev. D43 (1991) 2815.
- [17] CDF Collaboration: F. Abe et al., Phys. Rev. Lett. 81 (1998) 5744.
- [18] BCDMS Collaboration: A.C. Benvenuti et al., Phys. Lett. B236 (1989) 592.
- [19] B. Badelek and J. Kwiecinski, Phys. Rev. D50 (1994) R4.
- [20] ZEUS collaboration: J. Breitweg et al., Eur. Phys. J. C7 (1999) 609.
- [21] A.M. Cooper-Sarkar, hep-ph/0110386, proceedings of International Europhysics Conference on HEP 2001, Budapest.
- [22] S.I. Alekhin, hep-ph/0107197.
- [23] R.S. Thorne and R.G. Roberts, Phys. Rev. D57 (1998) 6871; Phys. Lett. B421 (1998) 303, Eur. Phys. J. C19 (2001) 339.
- [24] A.D. Martin, R.G. Roberts, W.J. Stirling and R.S. Thorne, in preparation.
-
[25]
W. Bernreuther and W. Wetzel, Nucl. Phys. B197 (1982)
228;
W. Bernreuther, Ann. Phys. 151 (1983) 127. - [26] S.A. Larin, T. van Ritenberg and J.A.M. Vermaseren, Nucl. Phys. B438 (1995) 278.
- [27] A.D. Martin, R.G. Roberts, W.J. Stirling and R.S. Thorne, Eur. Phys. J. C14 (2000) 133.
- [28] ZEUS collaboration: International Conference on High Energy Physics 2001, Budapest, Hungary, Abstract 632.
- [29] C. Adloff et al., Zeit. Phys. C72 (1996) 503.
- [30] H1 Collaboration: C. Adloff et al., hep-ex/0108039.
- [31] J.J. Aubert et al., Nucl. Phys. B213 (1983) 31.
- [32] A.D. Martin, R.G. Roberts, W.J. Stirling and R.S. Thorne, Eur. Phys. J. C4 (1998) 463.
- [33] D. Eckstein, presented at DIS2001, Bologna, April (2001), H1prelim-01-041.
- [34] D0 collaboration: V.M. Abazov et al., hep-ex/0109041.
- [35] W.T. Giele, E.W.N. Glover and D.A. Kosower, Phys. Rev. Lett. 73 (1994) 2019.
-
[36]
S.D. Ellis, Z. Kunszt and D.E. Soper, Phys. Rev. Lett.
64 (1990) 2121;
Z. Kunszt and D.E. Soper, Phys. Rev. D46 (1992) 192. - [37] CCFR collaboration: A.O. Bazarko et al., Z. Phys. C65 (1995) 189.
-
[38]
A.D. Martin, R.G. Roberts, W.J. Stirling and R.S.
Thorne, Eur. Phys. J. C16 (2000) 117;
A.D. Martin, R.G. Roberts, W.J. Stirling and R.S. Thorne, in preparation. -
[39]
R.S. Thorne, Phys. Rev. D60 (1999) 054031;
R.S. Thorne, in preparation. - [40] A.D. Martin, R.G. Roberts, W.J. Stirling and R.S. Thorne, hep-ph/0106075.
- [41] CTEQ Collaboration: H.L. Lai et al., Eur. Phys. J. C12 (2000) 375.
- [42] M. Glück, E. Reya and A. Vogt, Eur. Phys. J. C5 (1998) 461.
-
[43]
J. Huston et al., Phys. Rev. Lett. 77 (1996)
444;
H.L. Lai et al., Phys. Rev. D55 (1997) 1280.