How well can we predict CP asymmetry in , decays?
Abstract
Using the perturbative QCD amplitudes for and , we have performed an extensive study of the parameter space where the theoretical predictions for the branching ratios are consistent with recent experimental data. From this allowed range of parameter space, we predict the mixing induced CP asymmetry for with about uncertainty and the other CP asymmetries for , with uncertainty. These errors are expected to be reduced as we restrict the parameter space by studying other decay modes and by further improvements in the experimental data.
PACS index : 13.25.Hw, 11.10.Hi, 12.38.Bx
I Introduction
The mixing induced CP asymmetry for has been shown to depend on only the weak phase and there is no uncertainty from hadronic matrix elements[1]. factory is expected to yield information, not only on asymmetry but also on various other meson decays. It has been predicted that , decay modes may have large CP asymmetries[2, 3]. While branching ratios for these modes are very sensitive to the input parameters, CP asymmetries are expected to be less sensitive. We report here the sensitivity of predicted CP asymmetries in the parameter region restricted by experimental values for the branching ratios.
The time dependent CP asymmetry for transition, where is CP eigenstate, is given by[4]:
| (1) |
where , and is defined by the ratio of the decay amplitudes, . For the sake of convenience, we denote the direct CP asymmetry proportional to by and the mixing induced CP asymmetry proportional to by ,
| (2) |
In general, a decay amplitude has two kinds of contributions: so-called tree amplitude; and penguin amplitude. The decay amplitude for can be written as
| (3) |
where are Kobayashi-Maskawa(KM) matrix elements, and are decay amplitudes with strong final state interaction phases for tree and penguin contributions, respectively. For example, , for , and , for . Defining CP transformation by and , the decay amplitude for the charge conjugated mode, , can be written as
| (4) |
Thus the general expression for is given as
| (5) |
where , , and . In the above expression, and have to be invariant under any rotation of quark phases, . CP asymmetry is classified into the following four types depending on the relationship between tree and penguin contributions.
-
case 1.
If has the same weak phase as , , the hadronic matrix elements are canceled in . Then the direct CP asymmetry vanishes and the mixing induced CP asymmetry is strictly given by the weak phase ,
(6) In the decay mode, this is the case [1]. The experimental data makes it possible to determine the weak phase [5, 6].
-
case 2.
If the tree contribution is much larger than that of the penguin, , is expressed only by KM matrix elements just like in the case 1., . This leads to the same CP asymmetries as shown in eq.(6). When there is no interference between tree and penguin contribution, the direct CP asymmetry does vanish, and the mixing induced CP asymmetry is directly related to the weak phase .
-
case 3.
If the penguin contribution is much larger than that of the tree, , is expressed only by the angle between and ,
(7) In this case, the direct CP asymmetry vanishes, and the mixing induced CP asymmetry is directly related to some weak phase likewise,
(8) where . In the , decay modes, this is the case.
(1) decay mode:
There is no tree contribution in this decay mode, . The weak phase for this decay mode is defined by in the triangle[7],(9) The CP asymmetry is strictly given by the weak phase ,
(10) This makes it possible to extract the weak phase from the measurement of the mixing induced CP asymmetry . Here is related to as follows,
(11) (2) decay mode:
While we realize that it is difficult to measure the time dependence of at current factories, we will show that decay mode satisfies . Here , , where factor comes from the - mixing. Then, the mixing induced CP asymmetry for decay mode is given by the weak phase ,(12) Eq.(12) has been obtained by Ref.[9]. But they have assumed that and decay modes are dominated by the tree and penguin contributions, respectively. These assumptions are inconsistent with experiment. Belle Collaboration has found the ratio of the branching ratios[10],
(13) Neglecting the tree contribution, isospin analysis leads to a conclusion that the above ratio is equal to . The eq.(13) implies that the tree contribution can not be neglected in the decay mode.
-
case 4.
If the penguin contribution is comparable with that of the tree, the direct CP asymmetry does not necessarily vanish, and the mixing induced CP asymmetry has impurities from the penguin or tree contribution. and fall into this case.
In decay mode, both KM factors, and , have the same order of magnitude, and the tree contribution can interfere with the penguin amplitude. The CP asymmetry is parameterized as
(14) (15) where , , and is the relative strong phase. The weak phase is defined as the angle between and ,
(16) Unless we know both the magnitude and phase of , it is impossible to extract the weak phase from the data . In principle, isospin analysis makes it possible to overcome such a pollution without understanding the penguin contribution[11]. In order to perform the isospin analysis, all modes for have to be measured. However, it is difficult to measure the branching ratio of , which has background problem as well as a tiny branching ratio of [3]. Therefore, in practice, it is hard to perform the isospin analysis.
In the decay mode, is smaller than by , and the tree contribution does interfere with penguin. For this mode, and the direct CP asymmetry is given by,
(17) (18) where . The weak phase in the triangle is defined as [7]. Note that the is related to the weak phase as follows:
(19) where , .
We stress that, unless we know the ratio between tree and penguin contribution with the relative strong phase, we can predict neither the nor .
Perturbative QCD(PQCD) approach has been developed to theoretically understand semi-leptonic and two-body hadronic meson decays[12, 2, 3, 13, 14]. This approach enables us to calculate both the phase and magnitude of tree and penguin amplitudes. In this paper, applying PQCD approach to and decay modes‡‡‡In Ref. [2, 3], we used the wave functions for light meson which were obtained phenomenologically. In this paper, we consider all twist- contributions, and use the wave functions which were decided from light-cone QCD sum rule. The updated results hardly change the previous ones[15]., we predict the ratios between the tree and penguin amplitudes, and give CP asymmetries without relying on the isospin analysis.
II Numerical results
Applying PQCD approach, we take all twist- contributions into account, and use the wave functions for light mesons, which were decided from light-cone QCD sum rule,
| (20) | |||
| (21) |
where is color’s degree of freedom, , are normalized to dimensionless unit vectors, and , , . is momentum fraction of light quark’s momentum in the meson to parent meson’s one. are defined by the quark condensate,
| (22) |
where they are given as[16],
| (23) |
without flavour violation. Lorentz scalar wave functions for light mesons, , are expanded by Gegenbauer polynomials,
| (24) | |||
| (25) | |||
| (26) | |||
| (27) |
where . The coefficients are given as function of , and some input parameters, , in Ref.[16], where , , , , and are calculated from QCD sum rule within % accuracy. meson’s wave function is parameterized by two Lorentz scalar wave functions,
| (28) |
where , , and is the relative separation between -quark and light quark in the meson. According to Ref.[13], the contribution from is found to be negligible, and we adopt as the wave function at rest,
| (29) |
where the normalization constant is fixed by the decay constant , parameterizes the extent of meson, and is order of the mass difference between meson and -quark, , . Note that the decay rate is very sensitive to . Now, the branching ratios[10, 17, 18] will be used to restrict the parameter space. The combined branching ratios are
| (30) | |||||
| (31) | |||||
| (32) | |||||
| (33) | |||||
| (34) |
which are shown in Figure 1. The errors of the measured branching ratios are still large, and it is too early to put them together. Therefore, we obtain the range of allowed parameters so that the calculated branching ratios are consistent with the data, eq.(34), within , where we scan the parameters in the wave function within GeV, GeV, , and , , , , given in Ref.[16] within ranges.
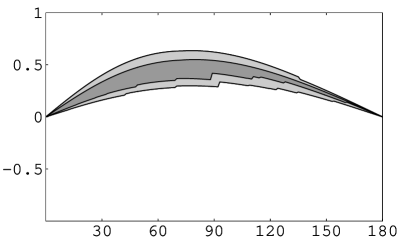
The calculated for each final state are shown at Figs.2, and summarized in Table I, where we do not take higher order corrections into account. They show the error for , denoted as , is . In principle, a calculation to should be performed. Higher twist contributions should be studied. These will be done in the future. For now, we assume that these corrections will not exceed % in the amplitude. The error is with such higher order corrections. Because the factorizable tree amplitude has color suppression in , decay modes, and the tree amplitude comes from only annihilation diagram in decay mode, their decay modes have . Considering KM factor, for and for , Table I shows that the penguin contribution is dominant in , decay modes and comparable with that of tree in , , and decay modes. In PQCD, the decay amplitudes are given by integrating the convolution of wave functions, hard amplitude, and Wilson’s coefficient, over loop momenta. Therefore, the dependence on the wave functions does not cancel completely in the ratio . This leads to blobs shown in Figs.2. Uncertainty in KM factors, decay constants, and parameters in the wave functions exerts an influence on the branching ratios. We elect the central values for the KM factors[19, 20] and meson’s decay constant MeV[21] in Figs.2. Figs.2 show the value of for each set of parameters which predict the branching ratios to within of eq.(34).
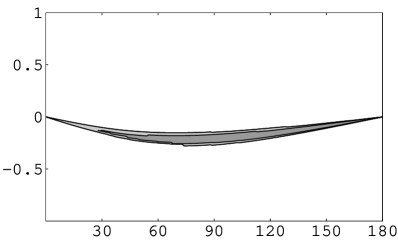
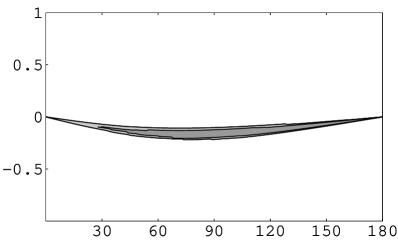
We prefer not to mix the error from the parameter space and the error from the higher order corrections. So, for now, we leave aside the error from the higher order corrections. From the allowed range of , we compute the CP asymmetry using eqs.(2),(5). The results are shown in Figs.3, 4. They are summarized in Table II. Now the higher order corrections are added to the result shown in Table II in quadrature. It results in % uncertainty for . The measured CP asymmetries have been presented in Ref.[22, 23], where Belle Collaboration gives at % confidence level, and BABAR Collaboration gives . They are not inconsistent with our predictions.
Although the relative error of is without higher order corrections, the mixing induced CP asymmetry for , , has small uncertainty, . This is because the magnitude of is small, . Since has zeroth order term in expansion of , the error is proportional to :
| (35) |
The factor leads to small uncertainty for . The error from the higher order corrections is also suppressed by the factor , and the total error for is estimated at %. In contradistinction to , the direct CP asymmetry has large uncertainty. Since is not suppressed by ,
| (36) |
the direct CP asymmetry is more sensitive to compared to the mixing induced CP asymmetry. Similar errors are assigned to and .
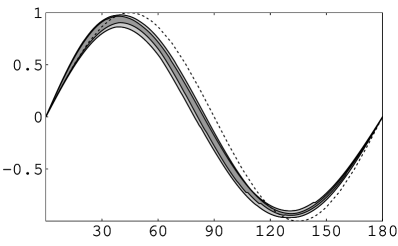
The mixing induced CP asymmetry for , , has little uncertainty. Here the factorizable tree amplitude is subjected to color suppression, and the penguin amplitude without KM factor is comparable to that of the tree, . However, KM factor, , is very large and it makes the penguin contribution dominant. Since , the first term in the numerator and denominator can be neglected in eq.(5), and is canceled out as shown in section 1. This is the reason why has little uncertainty. is classified into the case 3 in section 1, and is given by,
| (37) |
where its uncertainty from is .
III Conclusion
In order to extract the weak phase from the experimental data on CP asymmetries, we have to know the magnitude and strong phase of the penguin contribution. We have applied PQCD approach to and decay modes, which allows us to compute both the strong phase and magnitude of these amplitudes. We have calculated the ratios between the penguin and tree amplitude which are crucial in predicting CP asymmetries. For each decay mode, uncertainty of is . The direct CP asymmetry which is proportional to suffers from uncertainty in directly, and the error is estimated at . However, the mixing induced CP asymmetry for , which is not proportional to , has small uncertainty, and the asymmetry has been predicted with uncertainty. While it is difficult to measure the time dependence of at current factories, we predicted for decay mode. This leads to the mixing induced CP asymmetry which is related to the weak phase .
There are other attempts to study CP violation in , decays[24]. In the analysis of Ref.[24], symmetry is parameterized and is obtained from the analysis of Ref.[25]. Our value for which corresponds to the penguin parameter in the notation of Ref.[24] seems to yield a better agreement with experiments.
Improvement in experimental data is expected in the near future. The uncertainty in will be also expected to improve. The predicted CP asymmetries will make it possible to extract the weak phase from their experimental data.
Acknowledgments
We would like to thank PQCD group members: H.-W. Huang, Y.Y. Keum, E. Kou, T. Kurimoto, H.-n. Li, C.-D. Lü, S. Mishima, N. Sinha, R. Sinha, M.-Z. Yang and T. Yoshikawa for fruitful discussions. We are grateful to Y. Okada and M. Hazumi for discussions. Research of K.U. is supported by the Japan Society for Promotion of Science under the Predoctoral Research Program. This work is supported by Grand-in Aid for Special Project Research (Physics of CP violation), by the Grant-in-Aid for Science Research, Ministry of Education, Science and Culture, Japan(No.12004276).
REFERENCES
- [1] A.B. Carter and A.I. Sanda, Phys. Rev. D23 (1981) 1567; I.I. Bigi and A.I. Sanda, Nucl. Phys. B193 (1981) 85.
- [2] Y.Y. Keum, H.-n. Li and A.I. Sanda, Phys. Lett. B504 (2001) 6; Y.Y. Keum, H.-n. Li and A.I. Sanda, Phys. Rev. D63 (2001) 054008.
- [3] C.-D. Lü, K. Ukai and M.-Z. Yang, Phys. Rev. D63 (2001) 074009.
- [4] H. Quinn and A.I. Sanda, Eur. Phys. J. C15 (2000) 626.
- [5] BABAR Collaboration, B. Aubert et al., hep-ex/0107013.
- [6] Belle Collaboration, K. Abe et al., hep-ex/0107061.
- [7] R. Aleksan, B. Kayser and D. London, Phys. Rev. Lett. 73 (1994) 18.
- [8] D. London and R.D. Peccei, Phys. Lett. B223 (1989) 257.
- [9] D. London and A. Soni, Phys. Lett. B407 (1997) 61.
- [10] Belle Collaboration, K. Abe et al., hep-ex/0104030.
- [11] M. Gronau and D. London, Phys. Rev. Lett. 65 (1990) 3381.
- [12] C.Y. Wu, T.W. Yeh and H.-n. Li, Phys. Rev. D53 (1996) 4982; T.W. Yeh and H.-n. Li, Phys. Rev. D56 (1997) 1615.
- [13] T. Kurimoto, H.-n. Li and A.I. Sanda, hep-ph/0105003(to appear in PRD).
- [14] C.-D. Lü and M.-Z. Yang, hep-ph/0011238; E. Kou and A.I. Sanda, hep-ph/0106159; C.H. Chen, Y.Y. Keum and H.-n. Li, hep-ph/0107165; S. Mishima, hep-ph/0107206.
- [15] PQCD group, in preparation.
- [16] P. Ball, JHEP 09 (1998) 005; JHEP 01 (1999) 010.
- [17] CLEO Collaboration, D. Cronin-Hennessy et al., hep-ex/0001010.
- [18] BABAR Collaboration, B. Aubert et al., hep-ex/0105061.
- [19] Particle Data Group, D. E. Groom et al., Eur. Phys. J. C15 (2000) 1.
- [20] M. Ciuchini et al., hep-ph/0012308.
- [21] S. Aoki, talk presented at the 4th International Workshop on Physics and CP Violation, Ise, Japan, Feb.19-23, 2001.
- [22] Belle Collaboration, K. Abe et al., hep-ex/0106095.
- [23] BABAR Collaboration, B. Aubert et al., hep-ex/0107074.
- [24] R. Fleischer, Eur. Phys. J. C16 (2000) 87.
- [25] M. Beneke, G. Buchalla, M. Neubert and C. T. Sachrajda, Phys. Rev. Lett. 83 (1999) 1914.


| final state | ||
|---|---|---|
| final state | |||
|---|---|---|---|
| any | |||
| any | |||