June 2001
Impact of the first SNO results on Neutrino Mass and Mixing Abhijit Bandyopadhyay111 abhi@theory.saha.ernet.in, Sandhya Choubey222sandhya@theory.saha.ernet.in, Srubabati Goswami333sruba@theory.saha.ernet.in, currently at Physical Research Laboratory, Ahmedabad, India , Kamales Kar444 kamales@tnp.saha.ernet.in
Saha Institute of Nuclear Physics,
1/AF, Bidhannagar, Calcutta 700 064, INDIA.
ABSTRACT
We investigate the implications of the SNO charged-current (CC) and electron scattering (ES) measurements of solar neutrino fluxes for neutrino mass and mixing parameters by performing a global and unified analysis of the solar neutrino data in the framework of two neutrino mixing. We consider both and solutions and perform (i) analysis of the total rates data of Cl, Ga, SK and SNO experiments and (ii) global analysis including the total rates data, the recoil electron spectrum data of SK and the CC spectrum observed at SNO. For the case the inclusion of the SNO results in the analysis of the total rates reduces(enhances) the goodness-of-fit (GOF) of the SMA(LMA) solution. The flat spectrum observed at SK further favours the LMA solution over the SMA solution and no allowed area is obtained in the SMA region at 3 level from the global analysis. For the case, with the inclusion of the SNO results, all the solutions are disfavoured with a probability of more than 99% from the total rates analysis while for the global analysis the GOF of these become much worse.
The Sudbury Neutrino Observatory (SNO) has declared its first results [1] on the measurement of solar neutrinos through the CC detection process
| (1) |
in the heavy water() of SNO. This reaction is sensitive to only and the observed flux is
whereas the expectation from the standard solar model (SSM) of [2] is . SNO also gives the flux measured by the electron scattering (ES) reaction
| (2) |
as
The reaction (2) is sensitive to both and or and the measured flux is in agreement with that observed by the SuperKamiokande (SK) detector [3, 4] via the same reaction
These new generation high statistics experiments thus confirm the solar neutrino deficit observed in the pioneering Cl experiment [5] and subsequently in Kamiokande [6] and the low threshold Ga experiments SAGE, GALLEX and GNO [7]. A comparison of the flux measured by the CC reaction (1) with the flux of neutrinos measured at SK signifies the presence of a and/or component in the solar neutrino flux at 3.3 level. The total neutrino flux derived from a comparison of and the SK observed flux is found to be which is in excellent agreement with the SSM predictions [2].
In Table 1 we show the latest results for the total rates measured in Cl [5], Ga [7], SK (1258 days) [4] and SNO (CC and ES) experiments with respect to (w.r.t) the SSM fluxes of BPB00 [2]. The numbers in the parentheses for SK and SNO (ES) are when the or contributions are subtracted. We also show the composition of the major fluxes in each of these experiments. For the Ga rates we give the weighted average of SAGE, GALLEX and GNO. Apart from the total rates SNO also gives the CC spectrum of the neutrinos and they do not report any significant distortion with energy. SK has published the data on the recoil electron energy spectrum in separate day and night bins and also the zenith angle distribution of events [8, 9]. They do not find any significant variation of the data with energy and although there is a slight excess of the number of events observed in the night-time when the neutrinos are passing through the earth’s matter, the effect is only at 1.3.
Various particle physics solutions assuming non standard neutrino properties have been considered to account for the deficit [10, 11]. The simplest possibility is two flavor neutrino oscillation which requires to mix with some other flavor of neutrino. But even in this scenario there are several disconnected allowed regions in the mass-squared difference - mixing angle parameter space consistent with the global solar neutrino data. The flat recoil electron energy spectrum observed at SK has been responsible in creating a vast change in the allowed oscillation regions and their goodness of fit (GOF) as compared to those obtained from analysis of total rates only [12] -[19]. The best-fit to the data on total rates in Cl, Ga and Kamiokande and/or SuperKamiokande experiments was coming in the MSW [20] Small-Mixing-Angle (SMA) region. But with the flat electron energy spectrum observed in SK the best-fit in the global analysis of rates and spectrum data shifted to the Large-Mixing-Angle (LMA) region. The fit in the LOW region (low eV eV2 ), where earth matter effect regenerates the low energy neutrinos also became good. From the total rates data vacuum oscillation (VO) of neutrinos were allowed with best-fit eV2. But in the global analysis with the SK electron spectrum data this became largely disfavoured as the energy dependence of the survival probability in this region picked up conflict with the flat electron recoil energy spectrum. Recent analysis by SK [21] and other groups [17, 19] do find good fits in vacuum oscillation region for eV2 where the energy averaging over the bins smears out the energy dependence of the probability and the flat spectrum observed in SK can be accounted for. However the allowed regions are very tiny around the values in the vacuum oscillation region as well as somewhat fragile depending on the method of data fitting followed [17] unlike the MSW allowed regions which are quite robust against these changes. Apart from these pure MSW and pure vacuum regions, a grey zone (eV2 - eV2) called the Quasi-Vacuum-Oscillation (QVO) regime is allowed. For this area of the parameter space both matter effects inside the sun and the effects due to coherent oscillation phases are important. Thus there is a continuity in the allowed parameter regions and the older practice of separate analysis of the data in vacuum and MSW regions were replaced by what is called unified analysis which uses a general expression for probability valid in the whole mass range eV2. The cutoff in the from above is due to the constraint from the CHOOZ reactor experiment [22]. Another new aspect was the appearance of the dark zones ( [23]. In the background of this picture emerging out from detailed analysis of the available solar neutrino data several studies had been made on the expectations and implications of the SNO results [17],[24] -[27]. Now work has started to find the allowed values of mass squared differences and mixing parameters by actually incorporating the SNO results in the oscillation analysis [28, 29, 30].
In this paper we investigate the significance of the SNO results for neutrino mass and mixing parameters by including these in the -analysis of the global solar neutrino data on total rates in Cl, Ga and SK experiments and the SK day-night recoil electron spectrum. The definition of used by us is,
| (3) |
where i,j runs over the experimental data points. Here where is (for the theoretical prediction) or (for the experimental value) and is the total rate in the th experiment. We first do an analysis with the total rates given in Table 1. The error matrix contains the experimental errors, the theoretical errors and their correlations. For evaluating the error matrix for the total rates case we use the procedure described in [31]. The details of the code used by us can be found in [11, 15, 16]. For the rate of CC events recorded in the SNO detector we use
| (4) |
| (5) |
where is the normalized neutrino spectrum, is the time averaged survival probability, d/dET is the differential cross section of the interaction, is the true and the apparent(measured) total energy of the recoil electrons, is the detector threshold energy which we take as (6.75+) MeV, where is the rest mass of the electron and R(,) is the energy resolution function for which we use the expression in [1]. One of the major uncertainties in the SNO CC measurement stems from the uncertainty in the cross-section. We use the cross-sections from [32] which are in agreement with [33]. Both calculations give an uncertainty of 3% which is also the value quoted in [1]555It was recently pointed out in [34] that the calculation of both [32] and [33] underestimate the total cross-section by 6%. We have not included this effect in our calculation..
The expression for survival probability according to an unified formalism over the mass range eV2 and for the mixing angle in the range [0,] is well documented [35, 36, 23] and can be expressed as
| (6) | |||||
where denotes the probability of conversion of to one of the mass eigenstates in the sun and gives the conversion probability of the mass eigenstate back to the state in the earth. All the phases involved in the Sun, vacuum and inside Earth are included in . This most general expression reduces to the well known MSW (the phase is large and averages out) and vacuum oscillation limit (matter effects are absent and the phase is important) for appropriate values of . The procedure which we use for calculating and in MSW, vacuum as well as the in-between quasi-vacuum (QVO) regions where both and matter effects are relevant is discussed in [19].
The results for the analysis of total rates for oscillations are presented in Table 2 for both pre-SNO and post-SNO cases. As far as the pre-SNO total rates are concerned both SMA and vacuum oscillation give good fits with the best-fit coming in the SMA region. For post-SNO the best-fit comes in the VO region. However the noticeable thing is that with the inclusion of the SNO data the GOF of both SMA and VO becomes worse and that in the LMA region becomes better. Prior to SNO, at the best-fit point obtained in the SMA region, the observed Cl and Ga rates were described very well but the predicted SK rate was higher. With the introduction of SNO CC rate, the best-fit shifts towards higher and higher , which corresponds to a lower survival probability for the neutrinos thus lowering the SK and SNO rate. But this also lowers the Cl rate and the over all becomes high.
In the LMA region the survival probabilities of the high energy neutrinos are given as [37]
| (7) |
where and , being the probability of conversion inside the Earth. Since the observations of three of the experiments (Cl, SK and SNO) which are mainly sensitive to neutrinos are now close, they can be well described through a single eq. (7) and the GOF of the LMA solution becomes better. For low energies relevant for Ga the matter effects are weak and
| (8) |
which gives a greater probability as compared to eq.(7) for the same and the Ga rate of Table 1 is accounted for. There is no significant improvement for the LOW solution for which the probability is given by eq. (8) for all energies. In Table 2 we also give the GOF of the Just So2 solution [38]. In this region one gets a very small survival probability for the neutrinos while for the neutrinos the survival probability is close to 1.0 [39]. Since this scenario does not give any suppression of the flux it gets disfavoured with a probability of more than 99% by our total rates analysis with the flux normalization fixed at the BPB00 SSM value. We have also displayed in Table 2 the results of the analysis including the SNO ES rate in addition to the SNO CC rate. The inclusion of the SNO ES rate in the analysis improves the overall quality of the fits for all the solutions but it still has large statistical error and does not make any significant difference between the relative fit of various solutions.
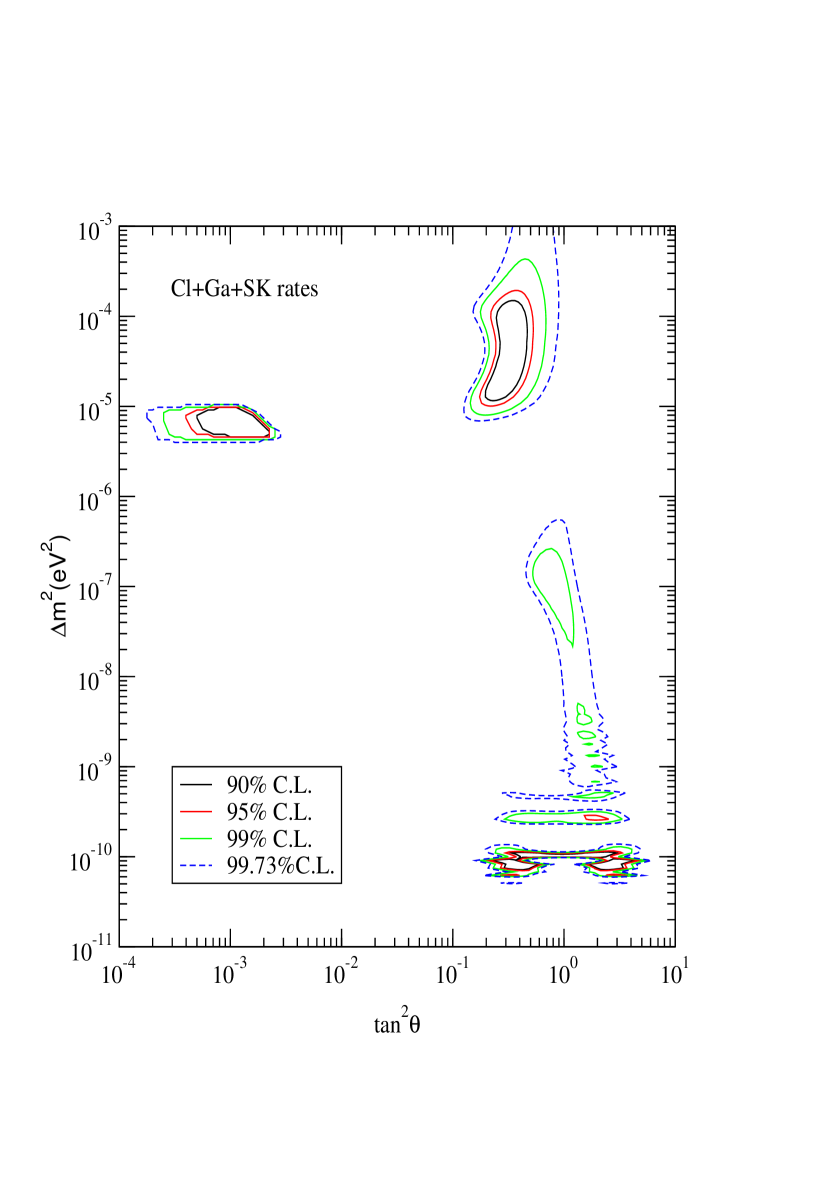
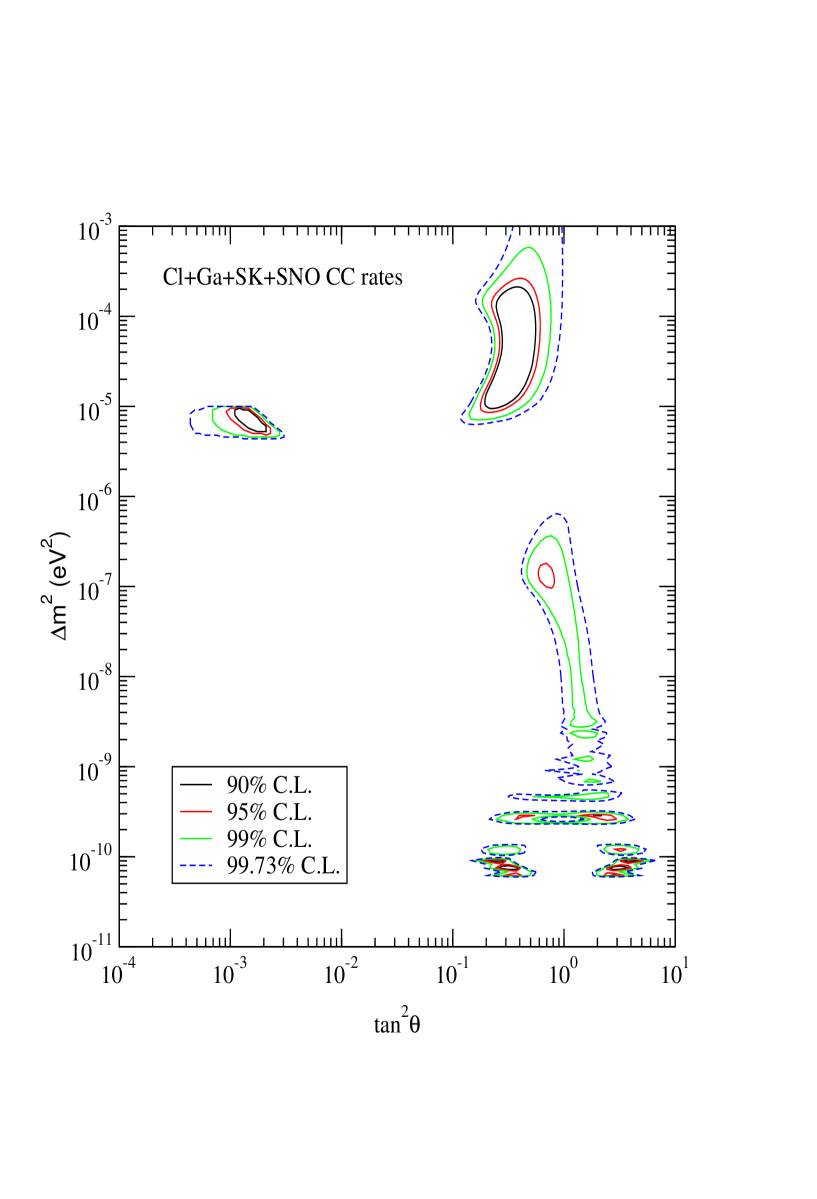
In Figs. 1 and 2 we plot the allowed regions for pre-SNO and post-SNO (excluding ES scattering) respectively at 90% (), 95% (), 99% () and 99.73% C.L.( from an analysis of total rates. Since the GOF of the SMA solution becomes worse with the inclusion of the SNO CC rate the SMA region reduces in size in Fig. 2. Also it shifts towards higher values of . On the other hand the allowed area in the LMA region becomes slightly bigger in the post-SNO case as the GOF in the LMA region improves. In the LOW region we get allowed areas at 95% C.L. for the post-SNO case.
In Table 3 we present the best-fit values of parameters, and the GOF of the solutions for the solution from an analysis of total rates. The GOF in the SMA region goes down from 16.04% (pre-SNO) to 0.03% after including the SNO CC rate. Since the observed SNO CC rate is significantly lower than the observed ES rate at SK, pure transitions are highly disfavoured and this is responsible for the bad fit obtained in Table 3 after including the SNO results.
For the global analysis the total is defined as
| (9) |
where and are the for the SK recoil electron spectrum and SNO CC spectrum respectively and corresponds to the from the total rates data. For the calculation of the rates part i,j runs from 1 to 4 if we do not include the ES rate measured in SNO and 1 to 5 if we include the ES rate from SNO; for the SK spectrum part i,j runs from 1 to 38 corresponding to 19 day and 19 night bins; for the SNO CC spectrum i,j runs from 1 to 11. To account for the fact the ES rate measured in SK is not independent of the spectrum we vary the normalization of the spectrum as a free parameter. Similarly for SNO CC spectrum we introduce a free normalization to avoid overcounting with the total CC rate. For the calculation of the error matrix for the SK spectrum we include the statistical error, correlated and uncorrelated systematic errors and the error due to the calculation of the spectrum [8, 21]. For the SNO CC spectrum we include the statistical error and the correlated systematic errors from [1]. For all our analyses presented in this paper we keep the flux normalization fixed at SSM value.
The no-oscillation is 100.31/52 which is disfavored at 99.99% C.L. from the global data. In Table 4 we show the results of global analysis of the rates and the spectrum data for oscillation to an active flavour. To highlight the impact of the SNO data we present the results for cases with and without SNO666 The pre-SNO best-fit values for the global analysis are from [19]. The corresponding C.L. contours also appear in [19].. For both pre-SNO and post-SNO we give the best-fit points and the local in five regions – SMA, LMA, LOW-QVO, VO and Just So2.
The pre-SNO analysis indicates that with the inclusion of the SK day-night spectrum data the GOF of the SMA solution becomes worse and fit in the LMA and LOW regions become much better, with LMA giving the best-fit. This worsening of fit in the SMA region is owing to the fact that the peculiar energy dependence of the observed rates in Cl, Ga and SK experiments favour larger values of while the flat recoil electron energy spectrum observed by SK prefers smaller values of . LMA and LOW solutions on the other hand can describe the flat recoil electron spectrum at SK very well and the GOF in these regions are much better. For the VO case, with the inclusion of the SK spectrum data the best-fit shifts to for which energy averaging gives an approximately constant probability for the high energy neutrinos. The Just So2 solution, although disfavoured from the rates analysis at more 99% C.L., can explain the flat SK spectrum well and thus gets allowed from the global analysis at 17.14%.
With the inclusion of the SNO CC rate into the global analysis, the data on total rates demand still higher values of for the SMA solution, thus enhancing the conflict between the rates and SK spectrum data and the GOF becomes worse in the SMA region777The contribution from to the total increases from 6.39 at the SMA best-fit for the pre-sno case to 14.99 with the inclusion of the SNO CC rate reducing the overall GOF.. If we look at the post-SNO in Table 4 for the case excluding the SNO CC spectrum and the ES data then we find that the SMA solution becomes more disfavoured with SNO, while LMA, LOW and VO are seen to improve, with the best-fit still in the LMA region. The Just So2 solution gets worse with the introduction of the SNO CC rate, however it is still allowed with a probability of 8.1%.
We have repeated the post-SNO global analysis by including the SNO ES rate and the SNO CC spectrum in addition to the SNO CC rate and have presented the results in Table 4. We find that due to large errors, both statistical and systematic, the effect of addition of the SNO CC spectrum in the analysis is to increase the and hence reduce the GOF for all the solutions in general.
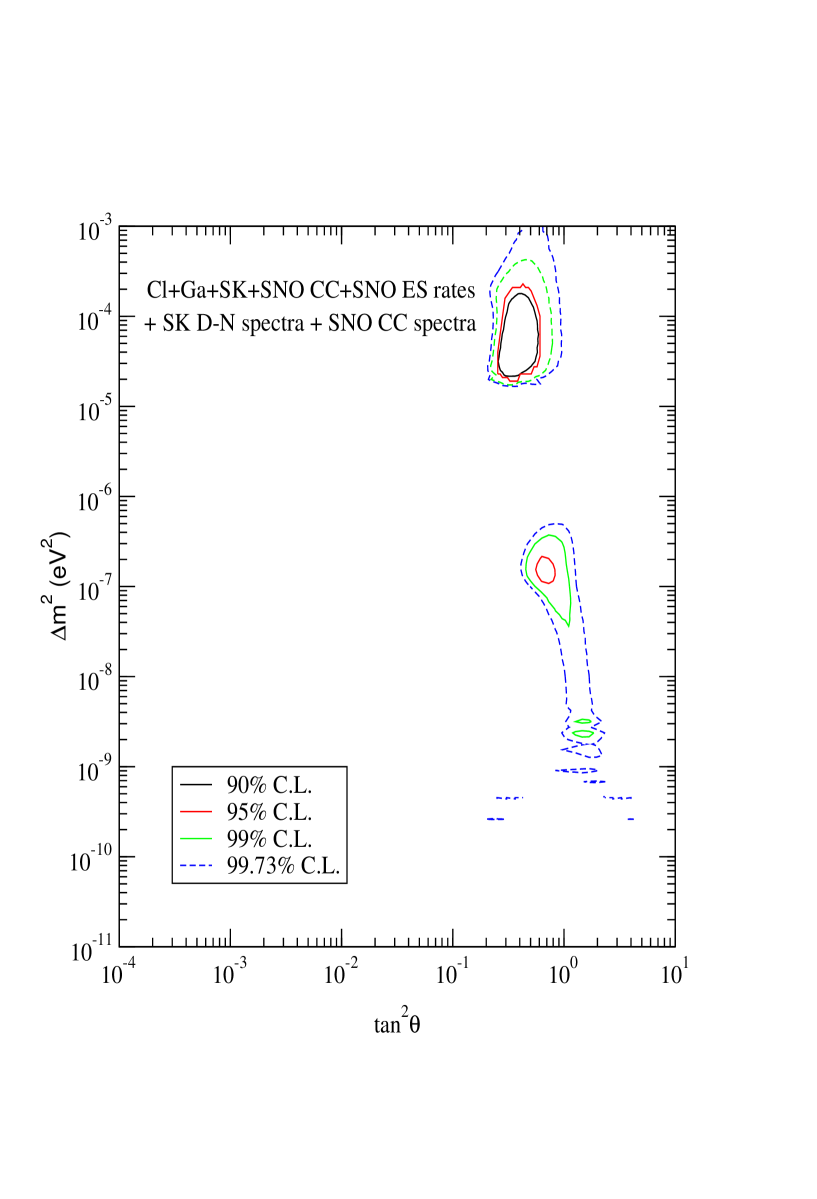
In Fig. 3 we show the allowed regions at 90%, 95%, 99% and 99.73% C.L. obtained from the global analysis for transitions including all published SNO data. The significant change in the allowed regions after including the SNO results is the disappearance of the SMA region even at 99.73% C.L. () as a result of increased conflict between the total rates and SK spectrum data. For the Just So2 solution also there is no allowed region at 99.73% C.L. after including the SNO data in the global analysis of rates and SK spectrum888From Table 4 we see that for the pre-SNO case we have allowed area at 99.73% C.L. in the Just So2 region..
In Table 5 we present the results of global analysis for solution and as expected the fits become worse with the inclusion of SNO results. The SMA and the VO solutions which were allowed at 22.9% and 32.57% respectively without the SNO results are now allowed at only 5.12% and 6.10%. The GOF in the LMA and LOW regions also become worse. Prior to the SNO results the SMA and VO was giving much better fit to the global data as compared to the LMA and LOW solutions since the former could account for the total rates data much better. But with the inclusion of the SNO CC rate the GOF of the SMA and VO solutions for the total rates analysis is reduced by a large amount and as a result all the solutions become more disfavoured for the sterile neutrino case.
The GOF of the SMA solution is very sensitive to the uncertainty of the cross-sections used. To illustrate this point in Table 6 we give the GOF of the various solutions for the case using the cross-sections from [40] and a conservative estimate of uncertainty of 9%. Comparing the GOF in the LMA and SMA region from the global analysis we find that with the use of a 9% uncertainty in the cross-sections the SMA region gets allowed at the level.
To summarise, we include the recent SNO results in global analysis of the solar neutrino data assuming to mix with either another active neutrino or a sterile neutrino. We first perform a fit to the total rates including (i) the SNO CC rate and (ii) both SNO CC and SNO ES rates, along with the total rates from Cl, Ga and SK experiments. For the case, SMA, LMA, LOW and VO solutions which were allowed from pre-SNO total rates analysis are still allowed but the inclusion of the SNO CC data in the analysis of total rates worsens the GOF of the SMA and VO solution and betters the GOF of the LMA solution. The inclusion of the SNO CC rate disfavours all the solutions for pure case with a probability of more than 99%.
We next perform a global analysis of rates and spectrum data including (i)the SNO CC rate and (ii) the SNO CC and ES rates and the SNO CC spectrum along with the total rates of Cl, Ga and SK experiments and the SK day-night spectrum. For case, the global analysis gives five allowed solutions – LMA, VO, LOW, SMA, Just So2 – in order of decreasing GOF. However no allowed area is obtained at 99.73% C.L. for SMA and Just So2 solutions. With the inclusion of the SNO CC rate the mismatch between the best-fit parameters for the rates and SK spectrum increases in the SMA region while the LMA gives a very good fit to the global data. This results in a marked improvement of the LMA solutions over the SMA solution and we get no allowed area in the SMA region even at the level.
The sterile neutrino alternative gets highly disfavoured by the rates analysis and the global analysis gives a GOF of only about 5% in the SMA region. However for an arbitrary flux normalization, a small admixture with the sterile neutrino state cannot be ruled out completely as is shown by the model-independent analysis performed in [41].
Note added: Our paper (hep-ph/0106264) appeared on the net at about the same time as [28] and [29]. We have updated our calculation with the latest cross-sections from [32]. Our method of analysis is same as in [28] but we have included transitions to sterile neutrinos not included in [28]. For the active case our results agree with [28]. The analysis in [29] uses a somewhat different definition of and they include an extra parameter to determine the active-sterile admixture in their analysis. We have also presented results including the SNO ES rate and the SNO CC spectrum data in our analysis, not included in the analyses of [28] and [29].
The authors would like to thank D.P. Roy for his valuable comments and suggestions. S.G. would like to thank the theory group of Physical Research Laboratory for their hospitality.
References
- [1] Q.R. Ahmad et al., http://www.sno.phy.quennsu.ca/sno/firstresults/, nucl-ex/0106015.
- [2] J.N. Bahcall, S. Basu, M. Pinsonneault, Ap. J. 555, 990 (2001).
- [3] Y. Fukuda et al. (The Super-Kamiokande collaboration), Phys. Rev. Lett. 81, 1158 (1998); erratum 81, 4279 (1998).
- [4] Y. Fukuda et al., Phys. Rev. Lett. 86, 5651 (2001).
- [5] B.T. Cleveland et al. Astrophys. J 496, 505 (1998).
- [6] Y. Fukuda et al., (The Kamiokande collaboration), Phys. Rev. Lett. 77, 1683 (1996).
- [7] J.N. Abdurashitov et al., (The SAGE collaboration), Phys. Rev. Lett. 77, 4708 (1996); Phys. Rev. C 60, 055801 (1999); W. Hampel et al., (The Gallex collaboration), Phys. Lett. B388, 384 (1996); Phys. Lett. bf B447, 127 (1999); Talk presented in Neutrino 2000 held at Sudbury, Canada (T.A. Kirsten for The Gallex collaboration), Nucl. Phys. B Proc. Suppl. 77, 26 (2000); M. Altmann et al., (The GNO collaboration),Phys. Lett. bf B492,16 (2000); Talk presented in Neutrino 2000 held at Sudbury, Canada ( E. Bellotti for the GNO Collaboration) Nucl. Phys. B Proc. Suppl. 91 44 (2001).
- [8] Y. Fukuda et al. (The Super-Kamiokande collaboration), Phys. Rev. Lett. 82, 2430 (1999).
- [9] Y. Fukuda et al. (The Super-Kamiokande collaboration), Phys. Rev. Lett. 82, 1810 (1999).
- [10] S. Choubey, S. Goswami, D. Majumdar, Phys. Lett. B484, 73 (2000). O.G. Miranda, C. Peña-Garay, T.I. Rashba, V.B. Semikoz, J.W.F. Valle, Nucl. Phy. B595, 360 (2001); D. Majumdar, A. Raychaudhuri and A. Sil, Phys. Rev. D63, 073014 (2001); A.M. Gago, H. Nunokawa and R. Zukanovich Funchal, Nucl. Phys. Proc. Suppl. 100, 68 (2001); M.M. Guzzo, H. Nunokawa, P.C. de Holanda, O.L.G. Peres, hep-ph/0012089; J. Pulido, hep-ph/0106201.
- [11] A. Bandyopadhyay, S. Choubey, S. Goswami, Phys. Rev. D63, 113019 (2001).
- [12] J.N. Bahcall, P.I. Krastev and A.Yu. Smirnov, Phys. Rev. D58, 096016 (1998).
- [13] M.C.Gonzalez-Garcia and C. Peña-Garay, Nucl. Phys. Proc. Suppl. 91, 80 (2000); M.C. Gonzalez-Garcia, P.C. de Holanda, C. Peña-Garay, and J.W.F. Valle, Nucl. Phys. B573, 3 (2000).
- [14] V. Barger and K. Whisnant, Phys. Lett. B456, 54 (1999).
- [15] S. Goswami, D. Majumdar and A. Raychaudhuri, hep-ph/9909453.
- [16] S. Goswami, D. Majumdar and A. Raychaudhuri, Phys. Rev. D63, 013003 (2001).
- [17] J.N. Bahcall, P.I. Krastev, and A.Yu. Smirnov, JHEP 0105, 015 (2001).
- [18] S. Choubey, S. Goswami, N. Gupta and D.P. Roy, hep-ph/0103318, to appear in Phys. Rev. D.
- [19] S. Choubey, S. Goswami, K. Kar, A.R. Antia, S.M. Chitre, hep-ph/0106168.
- [20] L. Wolfenstein, Phys. Rev. D34, 969 (1986); S.P. Mikheyev and A.Yu. Smirnov, Sov. J. Nucl. Phys. 42(6), 913 (1985); Nuovo Cimento 9c, 17 (1986) .
- [21] Y.Fukuda et al. Phys. Rev. Lett. 86, 5656 (2001).
- [22] M. Apollonio et al., Phys. Lett. B446, 415 (1999).
- [23] A.de. Gouvea, A. Friedland, H. Murayama, Phys.Lett.B490, 125, (2000).
- [24] J. N. Bahcall, P.I. Krastev , A. Yu. Smirnov JHEP 0105, 015 (2001).
- [25] J.N. Bahcall , P. I. Krastev, A. Yu. Smirnov Phys. Rev. D63, 053012 (2001).
- [26] J. N. Bahcall, P.I. Krastev , A. Yu. Smirnov, Phys. Rev. D62, 093004, (2000).
- [27] V. Barger, D. Marfatia, K. Whisnant and B.P. Wood, hep-ph/0104095.
- [28] G.L. Fogli, E. Lisi, D. Montanino and A. Palazzo, hep-ph/0106247.
- [29] J.N. Bahcall, M.C. Gonzalez-Garcia and C. Penya-Garay, hep-ph/0106258.
- [30] P. Creminelli, G. Signorelli, A. Strumia, hep-ph/0102234 (updated version, july 2000).
- [31] G.L. Fogli and E. Lisi, Astropart. Phys. 3, 185 (1995).
- [32] S. Nakamura, T. Sato, V. Gudkov and K. Kubodera, Phys. Rev. C63, 034617 (2001).
- [33] M. Butler, J. Chen and X. Kong, Phys. Rev. C63, 034617, (2001).
- [34] J.F. Beacom and S.J. Parke, hep-ph/0106128.
- [35] S.T. Petcov, Phys. Lett. B214, 139, (1988); ,200,373, (1988); S.T. Petcov and J. Rich, Phys. Lett. B426, (1989).
- [36] G.L. Fogli, E. Lisi, D. Montanino, A. Palazzo , Phys. Rev. D62, 113004, (2000).
- [37] M.C. Gonzalez-Garcia, C. Peña-Garay, Y. Nir and A. Yu. Smirnov, Phys. Rev. D63, 013007 (2001).
- [38] R.S. Raghavan, Science 267, 45 (1995); P.I. Krastev and S.T. Petcov, Phys. Rev. D53, 1665 (1996).
- [39] See Fig. 5 of [17].
- [40] http://www.sns.ias.edu/jnb/, J.N. bahcall and E. Lisi Phys. Rev. D54, 5417 (1996).
- [41] V. Barger, D. Marfatia and K. Whisnant, hep-ph/0106207.
|
| Nature of | Goodness | ||||
|---|---|---|---|---|---|
| Solution | in eV2 | of fit | |||
| SMA | 0.30 | 58.39% | |||
| pre-SNO | LMA | 0.31 | 2.91 | 8.80% | |
| (Cl+Ga+SK) | LOW-QVO | 0.64 | 7.49 | 0.62% | |
| VO | 0.43 | 0.32 | 57.16% | ||
| Just So2 | 1.00 | 12.86 | % | ||
| SMA | 5.44 | 6.59% | |||
| post-SNO | LMA | 0.34 | 3.40 | 18.27% | |
| (Cl+Ga+SK | LOW-QVO | 0.67 | 8.34 | 1.55% | |
| + SNO CC ) | VO | 0.27 | 2.49 | 28.79% | |
| Just So2 | 1.29 | 19.26 | % | ||
| post-SNO | SMA | 5.44 | 14.23% | ||
| (Cl+Ga+SK | LMA | 0.33 | 3.47 | 32.47% | |
| +SNOCC | LOW-QVO | 0.81 | 9.24 | 2.63% | |
| +SNOES) | VO | 0.27 | 2.92 | 40.41% | |
| Just So2 | 1.27 | 19.42 | % |
| Nature of | Goodness | ||||
|---|---|---|---|---|---|
| Solution | in eV2 | of fit | |||
| SMA | 1.97 | 16.04% | |||
| pre-SNO | LMA | 0.58 | 17.45 | 2.94 % | |
| (Cl+Ga+SK) | LOW-QVO | 0.85 | 18.01 | 2.19 % | |
| VO | 0.36 | 2.70 | 10.03% | ||
| Just So2 | 1.00 | 12.89 | % | ||
| SMA | 17.24 | % | |||
| post-SNO | LMA | 0.54 | 23.96 | 6.27% | |
| (Cl+Ga+SK | LOW-QVO | 0.94 | 24.26 | 5.40% | |
| +SNOCC) | VO | 0.27 | 15.71 | % | |
| Just So2 | 1.28 | 19.40 | % | ||
| post-SNO | SMA | 17.34 | % | ||
| (Cl+Ga+SK | LMA | 0.55 | 24.42 | 2.04 % | |
| + SNO CC | LOW-QVO | 0.87 | 22.16 | 6.04% | |
| + SNO ES) | VO | 0.23 | 23.76 | 2.80% | |
| Just So2 | 1.27 | 19.56 | 2.09% |
| Nature of | Goodness | ||||
|---|---|---|---|---|---|
| Solution | in eV2 | of fit | |||
| SMA | 43.59 | 24.57% | |||
| pre-SNO | LMA | 0.35 | 34.73 | 62.14% | |
| (Cl+Ga+SK | LOW-QVO | 0.66 | 38.50 | 44.66% | |
| + SK spec) | VO | 0.44 | 37.80 | 47.86% | |
| Just So2 | 1.00 | 46.13 | 17.14% | ||
| post-SNO | SMA | 51.14 | 9.22% | ||
| (Cl+Ga+SK | LMA | 0.38 | 33.42 | 72.18% | |
| +SNOCC | LOW-QVO | 0.67 | 39.00 | 46.99% | |
| +SK spec) | VO | 0.57 | 38.28 | 50.25% | |
| Just So2 | 0.77 | 51.90 | 8.10% | ||
| SMA | 5.29 | 65.20 | 7.30% | ||
| post-SNO | LMA | 0.38 | 47.84 | 56.05% | |
| (all data) | LOW-QVO | 0.66 | 53.30 | 34.85% | |
| VO | 0.36 | 56.82 | 23.60% | ||
| Just So2 | 0.78 | 66.29 | 6.12% |
| Nature of | Goodness | ||||
|---|---|---|---|---|---|
| Solution | in eV2 | of fit | |||
| SMA | 4.03 | 44.11 | 22.90% | ||
| LMA | 0.56 | 47.15 | 14.67% | ||
| pre-SNO | LOW-QVO | 0.85 | 47.16 | 14.65% | |
| VO | 0.39 | 41.37 | 32.57% | ||
| Just So2 | 1.00 | 45.61 | 18.51% | ||
| SMA | 3.87 | 67.37 | 5.12% | ||
| post-SNO | LMA | 0.48 | 67.37 | 5.12% | |
| (all data) | LOW-QVO | 1.00 | 68.19 | 4.45% | |
| VO | 0.30 | 66.31 | 6.10% | ||
| Just So2 | 0.78 | 66.48 | 5.93% |
| Nature of | Goodness | ||||
|---|---|---|---|---|---|
| Solution | in eV2 | of fit | |||
| SMA | 2.97 | 22.65% | |||
| post-SNO | LMA | 0.32 | 3.26 | 19.59% | |
| (Cl+Ga+SK | LOW-QVO | 0.70 | 7.88 | 1.93% | |
| +SNOCC) | VO | 0.27 | 2.20 | 33.29% | |
| Just So2 | 0.92 | 14.25 | % | ||
| post-SNO | SMA | 45.21 | 22.85% | ||
| (Cl+Ga+SK | LMA | 0.36 | 34.98 | 65.38% | |
| +SNOCC | LOW-QVO | 0.69 | 38.38 | 49.80% | |
| +SK spec) | VO | 2.35 | 37.83 | 52.31% | |
| Just So2 | 0.88 | 46.93 | 17.94% |