ANL-HEP-CP-01-10
HERA Small- and/or Diffraction
Rik Yoshida
on behalf of the ZEUS and H1 Collaborations
Argonne National Laboratory
9700 S. Cass Ave, Argonne, Illinois 60439, USA
Recent HERA data on small-x structure functions as well as DIS diffraction and diffractive vector meson production are presented. The relationship between these processes and possible indications of dynamics beyond the DGLAP formalism are discussed.
PRESENTED AT
5th International Symposium on Radiative Corrections
(RADCOR–2000)
Carmel CA, USA, 11–15 September, 2000
1 Proton Structure Function at Small-
1.1 Deep Inelastic Scattering and

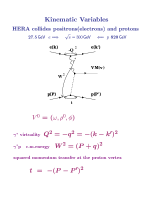
Deep Inelastic Scattering (DIS) of electrons (or positrons) with a proton is shown in Figure 1. The reaction proceeds through the exchange of a virtual boson; in the kinematic range covered in this talk, only photon exchange is important. The reaction can be described completely by two kinematic variables chosen to be the four-momentum transfer squared, (see Figure 1), and the Bjorken variable, . In the Quark Parton Model, is the fraction of the initial proton momentum carried by the struck parton.
The DIS cross-section factorizes into a short-distance part which is the partonic cross-section, , which can be calculated perturbatively in QCD, and a long-distance non-perturbative part, the parton densities, .
At sufficiently high , the parton densities, , obey the DGLAP equation [1], which is written schematically as,
| (1) |
where are the splitting functions that describe the branching of quarks and gluons, and symbolizes a convolution.
The DIS differential cross-section can be written in terms of the proton structure function as
| (2) |
where is the inelasticity parameter, and is the CMS energy squared of the collision. The longitudinal structure function and the effects of exchange have been neglected in Equation (2).
At leading order,
| (3) |
where , are the quark and antiquark distributions, respectively.
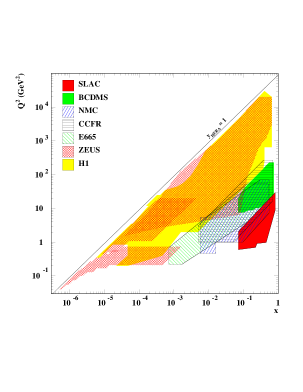
Figure 2 shows the and range of the currently available measurements of . At the HERA collider, with of about 300 GeV, and can be varied over six orders of magnitude. Of particular relevance to this talk is the region of smallest , which is probed only at HERA.
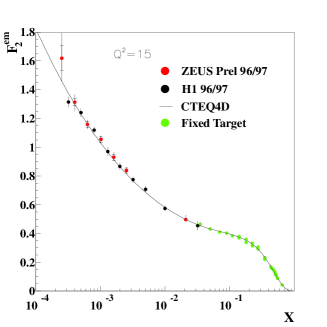
The measurements of at HERA show that the structure function rises steeply at small (see Figure 3) [3, 4].
If at 0.1 is parameterized as , then falls as a function of from about 0.4 to 0.1 as falls from 200 GeV2 to 1 GeV2. At of 10 GeV2, is about 0.2 (Figure 4) [5, 6].

The naive physical interpretation of the small- rise of is that it is caused by more and more gluons (and thus sea-quarks) being present at smaller and smaller fractional momenta values, i.e. .
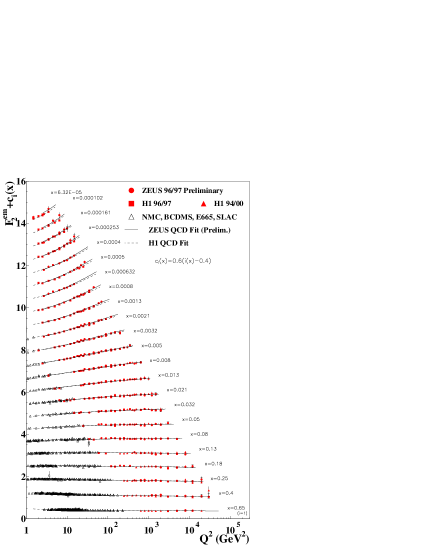
The scaling violations of (i.e. the dependence of at fixed , as seen in Figure 5) at low are related, in Leading Order (LO) DGLAP, simply to the gluon density of the proton [7],
| (4) |
In Next-to-LO (NLO) DGLAP, the simple relationship of Equation (4) no longer holds. However, the gluon density may be extracted from the NLO DGLAP fits to .
As an example of such fits, the one made by the H1 collaboration is briefly described [3].
The fit is made to the H1 data and the BCDMS data at GeV2. The flavor decomposition of into the gluon , the valence component , and the sea component is done in such a way as to allow the use of proton data only and avoid the deuteron data which introduces nuclear-correction uncertainties.
The , , and distributions are parameterized in the form . The momentum sum rule is imposed leading to 16 parameters to be fitted including . The fits are made by employing Equations (1) and (3) (in their NLO versions).
Figure 6 shows the gluon density extracted from the fit. In keeping with the naive expectation of a gluon-driven , the gluons also rise steeply at low . As falls, the steepness of the gluon also becomes less, as in the case of itself.
1.2 DIS and
Figure 2 shows that due to the kinematic limit at HERA, the measurements of at the smallest values of – correspond to rather small values of , well below 1 GeV2. In this kinematic range, it is appropriate to describe DIS in the hadronic language of a collision between a virtual photon and a proton. The appropriate variable, in this case, becomes the virtual-photon proton CMS energy, .
The total virtual-photon proton cross-section, at small-, can be written in terms of as
| (5) |
For fixed , implies . The structure function must vanish as , for fixed , as approaches 0, by conservation of EM current. At (photoproduction), the cross-section, , is described by Regge phenomenology, and is known to agree with the universal hadron-hadron cross-section behavior at high energies, [8]. The Pomeron intercept has the value 1.08 [9]. Thus at , , in contrast to at 10 GeV2.
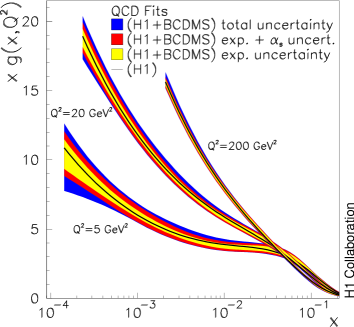
Figure 7 shows the measured at fixed down to the value of 0.04 GeV2. begins to fall as below 1 GeV2. The dashed line is a Regge inspired fit in the form . The value of 1.1 gives a good fit. This is consistent with the value of Pomeron intercept discussed above [6].
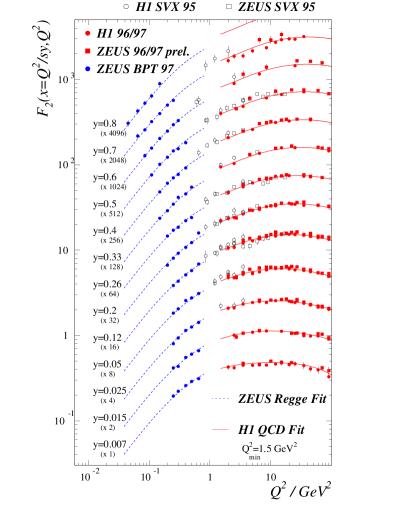
Also shown in Figure 7 is a NLO DGLAP fit which gives a good description of the data from high down to about 1 GeV2.
1.3 Beyond DGLAP?
The interest in small- physics is that the partons under study are the result of a large number of QCD branching processes. The evolution of the number of partons over a wide kinematic range in and should be sensitive to the applicability of different perturbative approximations of QCD.
Figure 8 shows the qualitative expectation of applicability of various pQCD approaches. DGLAP is a resummation of terms proportional to () and is expected to hold in the region of large . BFKL [10] is a resummation of terms proportional to () and, while the stability of the perturbative expansion still under study [11, 12], it is expected to hold in the region of small . The CCFM [13] equation incorporates both () and () terms.
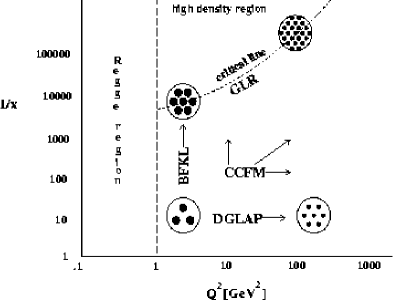
At small enough , the density of partons should become sufficiently large so that the interactions between them become important. This boundary is marked in Figure 8 by the line labeled “critical line”. The GLR equations [14, 15] attempt to take these saturation, or shadowing, effects into account.
It has been shown above that the DGLAP formalism is able to describe the currently available data down to 1 GeV2 and of in apparent contradiction to Figure 8, at least with the scale numbers as drawn.
On the other hand, there have also been successful fits to a wide range of data using formalisms that incorporate the () terms as well as the () terms [16, 17].
In search of clarification, we turn next to the phenomenon of DIS diffraction, and vector meson production, before returning to consider if there are any indications in the data for dynamics beyond DGLAP.
2 Diffraction in DIS
One of the striking results from HERA is the presence of diffractive events in DIS [18, 19]. About 10% of all DIS events have a gap in particle emission between the final-state proton, or a low mass state, which travels down the beampipe, and the system , which is measured in the detector (Figure 9). Such a reaction is usually described as an exchange of a colorless object, generically called the Pomeron ().

In order to describe diffractive DIS, two kinematic variables in addition to and are needed. These are , which is the momentum transfer at the proton vertex and , which is the fractional momentum of the proton carried by the Pomeron. Another useful variable is , which has an interpretation as the fractional momentum of the Pomeron carried by the struck parton (i.e. the Pomeron analogue of for the proton).

Any perturbative description of diffractive DIS must go beyond the simplest DGLAP picture; the lack of color connections between the system and the proton must mean that at least two gluons are exchanged. It is then interesting to investigate the connection between the high gluon densities implied by the measurements and the phenomenon of DIS diffraction.
2.1 Diffractive Factorization and Pomeron Structure
The diffractive cross-section, in analogy with the total cross-section, is written in terms of the diffractive structure function as
| (6) |
The cross-section has been integrated over . It has been proven that factorizes into a long and a short distance contributions, as does the inclusive , i.e. where are the usual pQCD hard cross-sections and are the diffractive parton densities, which obey the usual DGLAP equations, and are universal [21]. By knowing , we can calculate any diffractive DIS final state such as charm or jet production.
The diffractive parton densities are functions of four variables: , , and . However, the DGLAP evolution only concerns the variables (or ) and . If, for all relevant ’s, the and dependences decouple from the and dependence, and if the and dependences are the same for all relevant partons, then we arrive at what is known as Regge factorization [22],
| (7) |
In this case can be interpreted as the flux factor of the Pomeron, and as the structure function of the Pomeron. In this case DGLAP analysis of becomes meaningful. It is a remarkable experimental fact that Regge factorization, which is not required by the diffractive factorization theorem, apparently holds over a large part of the measured phase-space, and that the flux factor, , has approximately the form expected by Regge theory of [18, 19] (see also Figure 17a).
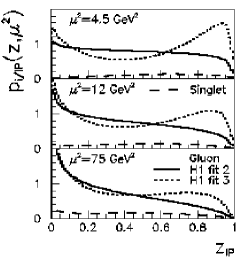
Figure 10 shows the measurements of by the H1 collaboration for of 0.005 [19, 20]. The lines are the results of the DGLAP analysis. The resulting parton distributions in the Pomeron is shown in Figure 11.
The analysis finds two stable solutions, one of which (dotted line) favors a rather large amount of gluons at , and the second which does not (solid line). The fractional momentum carried by the parton in the Pomeron is denoted by , and the renormalization and factorization scale by .
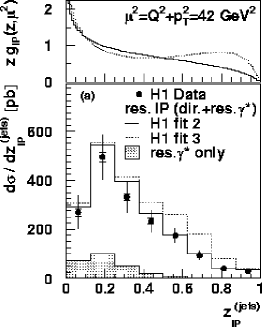
The recent measurement by H1 of dijet production in diffraction [23] shows that the Pomeron parton distributions extracted from the DGLAP analysis can indeed be used to describe the dijet cross-section in diffractive events (Figure 12). The jet measurement favors the parton distributions labelled “fit 2” in Figure 11.
2.2 Diffraction and at Small-
While the analyses based on diffractive factorization have been very successful and powerful, the question of the origin of the phenomenon of DIS diffraction remains unanswered. Furthermore, the relationship between the Pomeron structure and the proton structure is not clear.
Figure 13 shows the ratio, for fixed , of the DIS diffractive cross section to the total DIS cross-section as measured by the ZEUS collaboration. Although a cut has been made in the mass of the diffractive system, , the conclusion is independent of : the ratio is flat as a function of or, equivalently for fixed , of [18]. The flatness of the ratio implies that the energy dependence of DIS diffraction is the same as that of inclusive DIS, i.e. at GeV2.
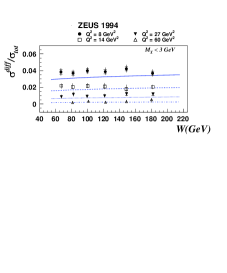
This result is surprising from several points of view. A naive expectation from the optical theorem would lead to diffractive cross sections that rise twice as fast as the inclusive one. In other words, if the rise of the inclusive cross-section is driven by a gluon density that rises as (or ), then for diffractive process that needs to couple to at least two gluons, the cross-section should rise as . At the same time, the energy dependence of the diffractive cross-section also contradicts Regge phenomenology, which expects an energy dependence of .
2.3 Impact Parameter Space (or Dipole) Models
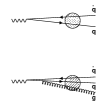
The infinite momentum frame of DIS, which is appropriate for the DGLAP formalism, is obviously not the only possible frame of reference. In the impact parameter, or dipole, formalism, the appropriate frame of reference is that in which the virtual photon dissociates into a quark-anti quark pair (or a more complicated state), which forms a color dipole which collides with the proton (Figure 14).
The description of the interaction of this color dipole with the proton distinguishes the various models of this type that have been proposed [26]. In this presentation, a particularly simple model due to Golec-Biernat and Wüsthoff (GB&W) will be described.
In the GB&W model, the cross-section of the dipole, , with the proton is modeled simply as a function that smoothly interpolates between two limits (Figure 15); at small dipole radius, , increases as in keeping with the behavior of perturbative QCD. At large , becomes constant to preserve unitarity. The saturation of the dipole cross-section can be qualitatively shown to correspond to the saturation of partons in the proton [27].
In the model, the point at which the dependence of the cross-section changes to the constant behavior depends on the density of the partons in the proton. Specifically, a parameter, , which can be interpreted as the separation of partons in the proton, is introduced. When , is in the “pQCD” region, while when , it is in the saturation region (Figure 16a and 16b, respectively).

The dipole radius, , enters through the wave function of the virtual photon, , and the diffractive cross-section is written, up to a dependence, as,
where is the fractional momentum of one of the quarks in the dipole.
The diffractive cross-section is explicitly related to the total cross-section, which is,
| (9) |
The fact that is constant as a function of (or ), as shown in Figure 13, can be shown to occur only if the dipole cross-section is being probed in these processes beyond the small region into the saturation region. The implication of this for the total cross-section will be discussed below.

In Figure 17a, the measurements of , this time from the ZEUS collaboration, are shown along with the prediction of the GB&W model. There is qualitative agreement. Figure 17b shows the recent measurement of at very low [28]. The GB&W model again describes the data qualitatively.


3 Diffractive Vector Meson Production
The exclusive production of vector mesons (VM) in DIS is a process which is closely related to DIS inclusive diffraction. As seen in Figure 18, the final state X in Figure 9 is replaced by a vector meson. Let us review the energy dependences of the processes we have discussed so far:
-
•
The total real photoproduction cross-section, , increases in accordance with the Regge expectation, i.e. .
-
•
The total virtual-photon proton cross-section, , at GeV2 increases approximately as , corresponding to rising as .
-
•
The diffractive DIS cross-section, , has approximately the same energy dependence as , i.e. increases as at GeV2.
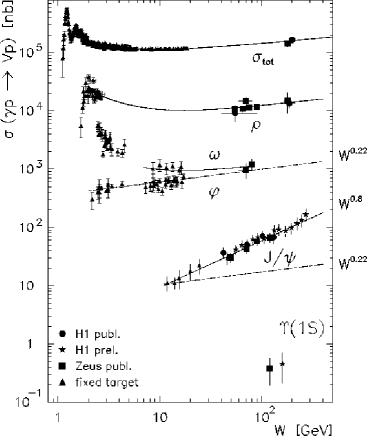
The energy dependence of exclusive vector meson production at (photoproduction) is summarized in Figure 19. While the production of light vector mesons, , and , have a weak energy dependence consistent with Regge expectations, the production cross-section rises rapidly with energy, as , i.e. twice as fast as , at GeV2. It is the fastest energy dependence of the processes discussed so far [29, 30].
The dependence of the production cross-section has been studied, but is still statistics limited. There is no evidence for a change of the energy dependence up to of 15 GeV2 [31].
The dependence of production cross-section is shown in Figure 20 [32], which shows , as obtained from a fit to the form , as a function of . The energy dependence clearly rises as a function of , although the precise form is not yet clear from the limited statistics.
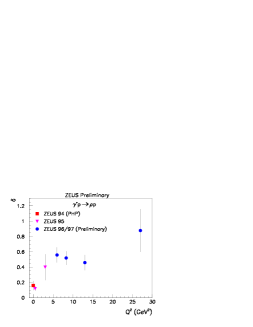
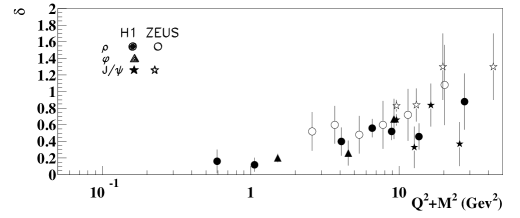
In Figure 21, for various species of vector mesons has been plotted as a function of , where is the mass of the vector meson. While the statistics are still limited, the data are consistent with a scaling of with . If we recall that (see Section 1.2), we can compare the energy dependence of vector meson production with that of inclusive DIS.
Comparing Figure 21 with Figure 4 which shows extracted from fits to to the form for , it can be seen that . This means that the vector meson production has an energy dependence at which is twice as fast as that of the inclusive DIS cross-section at .
The ratio of cross-sections of different species of vector mesons to the meson is shown in Figure 22 as a function of . The ratio is flat as a function of and is consistent with the ratios being 9:1:2:8. Such ratios are expected from the coupling of a photon to a vector meson, , from simple charge counting of the quark content of the vector mesons.

In the Vector Meson Dominance Model (VDM) of the production of vector mesons in photon (or virtual photon) proton collisions, the cross-section is given as , where is the vector-meson proton cross-section. The fact that the ratio of the cross-sections is given by implies that for different species of vector mesons scales as . In the context of color dipole models, the implication is that gives a measure of the radius, , of the color dipole, which is the primary variable on which the cross-section depends.
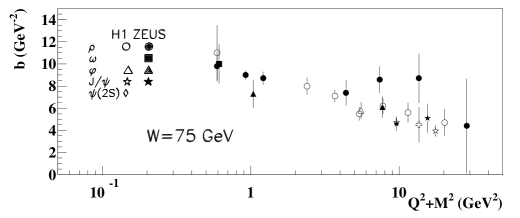
Figure 23 shows the values of the slope, , where the vector meson cross-sections are parameterized as . The parameter is plotted as a function of . Within the statistical accuracy of the measurements, scales with and decreases with increasing . This is an indication that is indeed giving the effective radius of the interaction, and thus the radius of the vector meson, or the color dipole.
The cross-section for diffractive vector meson production can be written in the color dipole model as,
| (10) |
where is the wave function of the vector meson, which, in contrast to the virtual photon wave function, , is not a well known quantity. Recently, evaluation of vector meson production in the context of Equation (10) and the dipole cross-section, , from the GB&W model has been made [33]. Simple wave-functions for the vector mesons were chosen. The results reproduce the elastic cross-section and their energy dependence very well. For the lighter mesons, and , the calculations fail to give a good description of the magnitude of the cross-sections. However, the steepening of the energy dependence with increasing (Figure 20) is well reproduced.
4 at Small- Revisited
In the first part of this presentation, it was stated that the proton measured so far at HERA and elsewhere is well described by fits using DGLAP equations above of 1 GeV2, and a model combining Regge theory and Vector Meson Dominance has been shown to work well below 1 GeV2.
The dipole model description of the total DIS cross-section (or ) is given in Equation (9). Currently the formal connection between the DGLAP interpretation and the dipole models is far from clear [27, 34, 35]. However many dipole models, in particular the GB&W model, describe the dynamics of cross-section saturation which goes beyond the physics of the DGLAP picture. Thus, it is appropriate to revisit the inclusive DIS data and ask if there are any indications of behavior beyond DGLAP, even though the DGLAP fits are successful.
The DGLAP evolution equations, at low and at LO, imply that the partial derivative of with respect to () is proportional to , the gluon momentum density of the proton (Equation (4)). On the other hand, at sufficiently low , must vanish as from current conservation, a behavior built into the GB&W model but not in the DGLAP formulation of DIS:
| (11) |

Since at low is related to and by , the plot of at a constant , over the range covered by the data, should show a transition from the behavior according to Equation (4) to that of Equation (11), provided has a weak dependence and , which corresponds to the photoproduction cross-section, has a weak (or equivalently energy) dependence. Since there is no quantitative prediction for the kinematic region in which the DGLAP formalism is applicable, the determination of the and at which this transition occurs is of great interest and may help in clarifying the nature of the transition [36].
Figure 24 shows recent measurements of from the ZEUS collaboration along with the fixed target measurements [37] from the NMC and the E665 collaborations. is shown as a function of for bins of fixed . Where necessary, the measurements have been interpolated to the appropriate values of using the ALLM parameterization [38]. The in each bin of fixed is offset by an additive factor of to ensure that the vertical separation between the bins is monotonic in . Therefore, at low , the line connecting at constant would be a straight line, as a function of , if were a constant and contained no dynamics.
The parameterization has been used to fit the measurements at each value of . The quality of the fit is good, and the result is shown in Figure 24 as solid lines. The constant points on the parameterizations have been found according to the formula , and are indicated on the plot with dashed lines. It is interesting to note the distortion in the fixed- lines that occurs at 10-4 at relatively high 5 GeV2 and at above 85 GeV.

In Figure 25, the derivatives of , evaluated from the fit , are shown. The errors of the derivatives are evaluated using the errors on, and correlations between, the parameters and obtained from the polynomial fits. Figure 25a shows the derivatives at constant as a function of , whereas Figure 25b shows the same as a function of .
Figure 25a shows that at lower , corresponding to lower in Figure 25b, the derivatives fall as decreases and tend to become independent of at of about 0.4 GeV2. This is in line with the expectation of Equation (11).
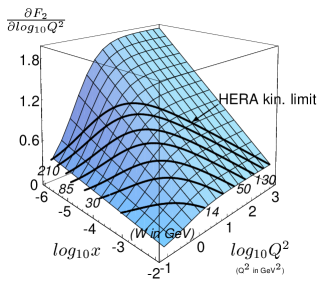
Figure 25b shows that at higher , corresponding to higher in Figure 25a, the derivatives fall with increasing and tend to become independent of at 0.003, in line with the expectation of Equation (4), if has the form and only a slow dependence on .
The value of , or , where the slope of the derivatives changes sign can be read off from Figures 25a and 25b.
This transition, for values of above 85 GeV, happens at a relatively high of 2-6 GeV2 at the corresponding of 510-4 to 310-3.

The dashed lines in Figure 25 are the prediction of the GB&W model, which explicitly incorporates the transition between the behaviors described in Equations (11) and (4) as a transition between the pQCD region and the saturation region of the dipole cross-section. The lines are drawn only at 0.01 where the model is applicable. The solid line is the result of a DGLAP fit by the ZEUS collaboration. The line is drawn only above GeV2, where data have been fit. In case of the DGLAP fit, the peaking behavior of Figure 25 is related to the rapid decrease of the gluon density at low between Q2 of 10 GeV2 and 1 GeV2 [18, 39].
Figure 26 is a 2-dimensional visualization of the qualitative features of Figure 25. The lines of constant (“trajectories”), plotted as thick solid lines, when projected to the and axes, approximately give Figures 22a and 22b, respectively. The peak structure of the constant lines represents the transition from the region where is steeply rising with to the region where it is steeply rising with , behaviors corresponding to Equations (4) and (11), respectively. The position of the peak structure does not depend strongly on the “trajectory”, , at which the derivatives are plotted, chosen to be in Figure 25. Inspection of Figure 26 shows that almost any choice of a function , which rises monotonically with decreasing for a fixed will have a peak at the same position which correctly indicates the transition. In particular, an early ZEUS analysis, made with a more limited data set available at the time, shows (Figure 27) the same transitional behavior at the same position.

Figure 28 shows the derivatives plotted for constant , as a function of . At above 1.9 GeV2, the derivatives rise rapidly as decreases in line with the expectations of Equation (4) assuming has the form . As falls, the rise of the derivative becomes less steep, as would be expected from Equation (11), if a mild energy dependence, of the Regge type, is assumed for ; thus a turn-over in Figure 28 is not expected from the GB&W model, while naively one might expect it from Equation (4) with saturating gluons, . The statements sometimes found in the literature that the turn-over found in Figure 27 is “accidental” or “only kinematic in origin” [35, 40, 41, 42] arises from the combination of the expectation of a turn-over in Figure 28 as a manifestation of gluon saturation and the misunderstanding that Figure 27 is in some way an approximation of Figure 28; rather, it is an approximation of Figure 25.
5 Discussion and Outlook
The measurements of the proton structure at small at HERA are now very precise. However, in spite of the expectation that these measurements should show some manifestation of dynamics beyond that incorporated in the () expansion of the DGLAP formalism, the DGLAP fits to the data give a good description above of about 1 GeV2.
The question of whether the success of DGLAP fits merely indicates the flexibility of the parton parameterizations and the still-limited () range of the measurement at small- is not likely to be answered by looking at alone, at least in the currently available kinematic range. As discussed in Section 4, while the qualitative features of at small- (and necessarily small ), show some characteristics expected by a saturation model, the DGLAP fits can reproduce those same features without any parton saturation, as a result of a rapidly evolving gluon density at low .
One of the most promising ways of investigating the small- proton structure is to look at the inclusive DIS measurements together (“and” rather than “or” of the title) with the diffractive DIS reactions. While the theoretical understanding of the relation of small- and diffraction is not yet very rigorous, the data sets from HERA provide many interesting indications of the underlying dynamics.
ACKNOWLEDGEMENTS
It is a pleasure to thank the organizers for a most enjoyable Symposium. The experimental results presented here are due to a huge collaborative effort, over many years, of the large number of people in the H1 and ZEUS experiments. I had many interesting discussions on the subject matter of this talk with many of my colleagues in H1 and ZEUS; I would particularly like to thank Brian Foster . I would also like to thank John Collins, Krzysztof Golec-Biernat, Al Mueller and Mara Soares for illuminating discussions. Finally, Jim Whitmore, Peter Schleper and Brian Foster were kind enough to carefully check the manuscript.
References
-
[1]
L. N. Lipatov,
Sov. J. Nucl. Phys. 20, 94 (1975);
V. N. Gribov and L. N. Lipatov, Sov. J. Nucl. Phys. 15, 438 (1972);
G. Altarelli and G. Parisi, Nucl. Phys. B126, 298 (1977);
Y. L. Dokshitzer, Sov. Phys. JETP46, 641 (1977). - [2] H. L. Lai et al., Phys. Rev. D 55, 1280 (1997) [hep-ph/9606399].
- [3] C. Adloff et al. [H1 Collaboration], hep-ex/0012053.
- [4] ZEUS Collaboration, paper 412, XXXth International Conference on High Energy Physics, July 27–August 2, 2000, Osaka, Japan.
- [5] C. Adloff et al. [H1 Collaboration], Nucl. Phys. B 497, 3 (1997) [hep-ex/9703012].
- [6] J. Breitweg et al. [ZEUS Collaboration], Eur. Phys. J. C7, 609 (1999) [hep-ex/9809005].
- [7] K. Prytz, Phys. Lett. B 311, 286 (1993).
-
[8]
M. Derrick et al. [ZEUS Collaboration],
Z. Phys. C63, 391 (1994);
S. Aid et al. [H1 Collaboration], Z. Phys. C69, 27 (1995) [hep-ex/9509001]. - [9] A. Donnachie and P. V. Landshoff, Nucl. Phys. B231, 189 (1984).
-
[10]
V. S. Fadin, E. A. Kuraev and L. N. Lipatov,
Phys. Lett. B60, 50 (1975);
E. A. Kuraev, L. N. Lipatov and V. S. Fadin, Sov. Phys. JETP44 (1976) 443;
E. A. Kuraev, L. N. Lipatov and V. S. Fadin, Sov. Phys. JETP45 (1977) 199;
I. I. Balitsky and L. N. Lipatov, Sov. J. Nucl. Phys. 28, 822 (1978). -
[11]
V. S. Fadin and L. N. Lipatov,
Phys. Lett. B429, 127 (1998)
[hep-ph/9802290];
M. Ciafaloni and G. Camici, Phys. Lett. B430, 349 (1998) [hep-ph/9803389]. -
[12]
J. Blumlein and A. Vogt,
Phys. Rev. D 57, 1 (1998)
[hep-ph/9707488].
J. Blumlein, V. Ravindran, W. L. van Neerven and A. Vogt, hep-ph/9806368. -
[13]
M. Ciafaloni,
Nucl. Phys. B296, 49 (1988);
S. Catani, F. Fiorani and G. Marchesini, Nucl. Phys. B336, 18 (1990);
S. Catani, F. Fiorani and G. Marchesini, Phys. Lett. B234, 339 (1990). - [14] L. V. Gribov, E. M. Levin and M. G. Ryskin, Phys. Rep. 100, 1 (1983).
- [15] J. Bartels, G. A. Schuler and J. Blumlein, Z. Phys. C 50 (1991) 91.
- [16] R. S. Thorne, Nucl. Phys. B512, 323 (1998) [hep-ph/9710541].
- [17] H. Jung, Nucl. Phys. Proc. Suppl. 79, 429 (1999) [hep-ph/9905554].
- [18] J. Breitweg et al. [ZEUS Collaboration], Eur. Phys. J. C6, 43 (1999) [hep-ex/9807010].
- [19] C. Adloff et al. [H1 Collaboration], Z. Phys. C76, 613 (1997) [hep-ex/9708016].
- [20] H1 Collaboration, paper 571, XXIXth International Conference on High Energy Physics, July 23–29, 1998, Tampere, Finland.
- [21] J. C. Collins, Phys. Rev. D 57, 3051 (1998) [hep-ph/9709499].
- [22] G. Ingelman and P. E. Schlein, Phys. Lett. B152, 256 (1985).
- [23] C. Adloff et al. [H1 Collaboration], hep-ex/0012051.
- [24] K. Golec-Biernat and M. Wusthoff, Phys. Rev. D 59, 014017 (1999) [hep-ph/9807513].
- [25] K. Golec-Biernat and M. Wusthoff, Phys. Rev. D 60, 114023 (1999) [hep-ph/9903358].
-
[26]
E. Gotsman, E. Levin and U. Maor,
Nucl. Phys. B493, 354 (1997)
[hep-ph/9606280];
E. Gotsman, E. Levin and U. Maor, Phys. Lett. B425, 369 (1998) [hep-ph/9712517];
E. Gotsman, E. Levin, U. Maor and E. Naftali, Nucl. Phys. B539, 535 (1999) [hep-ph/9808257];
N. N. Nikolaev and B. G. Zakharov, Z. Phys. C49, 607 (1991);
N. Nikolaev and B. G. Zakharov, Z. Phys. C53, 331 (1992);
V. Barone, M. Genovese, N. N. Nikolaev, E. Predazzi and B. G. Zakharov, Phys. Lett. B326, 161 (1994) [hep-ph/9307248];
J. R. Forshaw, G. Kerley and G. Shaw, Phys. Rev. D 60, 074012 (1999) [hep-ph/9903341];
W. Buchmuller, T. Gehrmann and A. Hebecker, Nucl. Phys. B537, 477 (1999) [hep-ph/9808454];
A. H. Mueller and B. Patel, Nucl. Phys. B425, 471 (1994) [hep-ph/9403256];
A. H. Mueller, Nucl. Phys. B415, 373 (1994).
W. Buchmuller and A. Hebecker, Nucl. Phys. B476, 203 (1996) [hep-ph/9512329];
W. Buchmuller, M. F. McDermott and A. Hebecker, Nucl. Phys. B487, 283 (1997) [hep-ph/9607290].
- [27] A. H. Mueller, hep-ph/9911289.
- [28] ZEUS Collaboration, paper 435, XXXth International Conference on High Energy Physics, July 27–August 2, 2000, Osaka, Japan.
- [29] C. Adloff et al. [H1 Collaboration], Phys. Lett. B483, 23 (2000) [hep-ex/0003020].
- [30] ZEUS Collaboration, paper 437, XXXth International Conference on High Energy Physics, July 27–August 2, 2000, Osaka, Japan.
- [31] ZEUS Collaboration, paper 438, XXXth International Conference on High Energy Physics, July 27–August 2, 2000, Osaka, Japan.
- [32] ZEUS Collaboration, paper 439, XXXth International Conference on High Energy Physics, July 27–August 2, 2000, Osaka, Japan.
- [33] A. C. Caldwell and M. S. Soares, hep-ph/0101085.
- [34] J. Bartels, J. Phys. G26, 481 (2000).
- [35] M. F. McDermott, hep-ph/0008260.
- [36] ZEUS Collaboration, paper 416, XXXth International Conference on High Energy Physics, July 27–August 2, 2000, Osaka, Japan.
-
[37]
M. R. Adams et al. [E665 Collaboration],
Phys. Rev. D 54, 3006 (1996);
M. Arneodo et al. [New Muon Collaboration], Nucl. Phys. B483, 3 (1997) [hep-ph/9610231]. -
[38]
H. Abramowicz, E. M. Levin, A. Levy and U. Maor,
Phys. Lett. B269, 465 (1991).
H. Abramowicz and A. Levy, hep-ph/9712415. - [39] A. D. Martin, R. G. Roberts, W. J. Stirling and R. S. Thorne, Eur. Phys. J. C4, 463 (1998) [hep-ph/9803445].
- [40] E. Gotsman, Nucl. Phys. Proc. Suppl. 79, 192 (1999).
- [41] A. De Roeck, in the Proceedings of “Yalta 2000, new trends in high-energy physics”.
- [42] P. Schleper, hep-ex/0102051.