Mayumi Aoki1***JSPS Fellow.,
Gi-Chol Cho2, Makiko Nagashima3,
and Noriyuki Oshimo2
1Theory Group, KEK, Tsukuba, Ibaraki 305-0801, Japan
2Department of Physics
Ochanomizu University, Bunkyo-ku, Tokyo 112-8610, Japan
3Graduate School of Humanities and Sciences
Ochanomizu University, Bunkyo-ku, Tokyo 112-8610, Japan
Abstract
We calculate the contributions of the vector-like quark model
to mixing, taking into account the
constraints from the decay .
In this model the neutral bosons mediate flavor-changing interactions
at the tree level.
However, mixing is dominated by
contributions from the box diagrams with the top quark and
the extra up-type quark.
In sizable ranges of the model parameters, the mixing parameter
is much different from the standard model prediction.
PACS number(s):
12.15.Ff, 12.60.-i, 14.40.Nd
The standard model (SM) may have to be extended to
describe physics around or above the electroweak scale.
Various works have thus discussed phenomena involving
the meson which are sensitive to new physics [1].
For instance, the radiative -meson decay
and mixing could receive non-trivial contributions
from supersymmetry [2, 3].
The vector-like quark model (VQM) could also affect
these processes of flavor-changing neutral
current [4, 5].
In this letter we discuss mixing within the
framework of the VQM which is one of the minimal extensions of the SM.
The mixing parameter
is evaluated and its dependencies on the model parameters are analyzed.
These model parameters are constrained by the branching ratio of
the decay .
Even under these constraints, the value of can be much different
from the SM prediction.
The VQM incorporates extra quarks whose left-handed
components, as well as right-handed ones, are singlets under
the SU(2) gauge transformation.
Then, the interactions of quarks
become different from those in the SM.
The Cabibbo-Kobayashi-Maskawa (CKM) matrix for the interactions
with the boson is extended and not unitary.
The boson couples directly to the quarks with different flavors.
The neutral Higgs boson also mediates
flavor-changing interactions at the tree level.
Our study concentrates on
mixing at the one-loop level through box diagrams.
The contributions at the tree level have already been analyzed
in the literature.
The order of these tree-level diagrams is lower than the
box diagrams of the SM.
However, the experimental bounds on the branching ratio of
the decay suggest very
weak couplings for the flavor-changing interactions at the tree level.
Consequently, the tree-level contributions turn out to be smaller than
the one-loop contributions.
On the other hand, the new box diagrams in the VQM are
expected to contribute at the same order as those of the SM.
Although these new contributions do not yield a drastic change
from the SM prediction, precise measurements in near-future
experiments, such as BTeV and LHCb, may be able to distinguish
the VQM and the SM.
Indeed, the VQM could give sizable new contributions to
the decay at the one-loop level [5],
imposing non-trivial constraints on the model.
We assume, for definiteness, that there exist two vector-like quarks
and with electric charge and , respectively.
The CKM matrix is then enlarged to be a matrix and
expressed as
(1)
and being unitary matrices which diagonalize
the mass matrices for up-type and down-type quarks, respectively.
It should be noted that the matrix is not unitary:
(2)
The interaction Lagrangian for the quarks with the and
Goldstone bosons is given by
(3)
Here, the mass eigenstates for the up-type and down-type quarks
are denoted by and ,
and being the generation indices,
and and represent the corresponding mass eigenvalues.
These eigenstates will also be called as and .
The interaction Lagrangian for the down-type quarks
with the , Higgs, and Goldstone bosons is given by
(4)
Since the matrix is not unitary, there appear flavor-changing
interactions at the tree level.
The Lagrangians in Eqs. (3) and (4)
contain also new sources of violation [6].
The amount of mixing is described by
the mixing parameter , which becomes
(5)
(6)
with .
The first term in Eq. (5) comes from the diagram
exchanging the boson at the tree level.
The contribution from the tree-level diagram exchanging the
Higgs boson is suppressed by a factor of
and thus negligible.
The second term arises from the box diagrams.
Neglecting the masses of the and quarks, we obtain
(7)
where the functions , , are defined by
(8)
(9)
(10)
In our numerical calculations we take
the bag factor , the decay constant ,
the meson mass , and the meson life time
for MeV [7], GeV, and
ps [8].
The QCD correction factor is set
at 0.55 [9].
The mixing parameter depends on the -quark mass
and the CKM matrix elements , , .
The mass should be larger than the top-quark mass.
The matrix elements are related to , , ,
and which have been directly measured in experiments.
Their experimental values [8] give a constraint
(11)
As seen in Eq. (4),
the value of determines the flavor-changing interactions at the
tree level.
From the upper bounds on the branching ratio of the decay
[8], a constraint
(12)
is derived 111The present experimental bounds do not give
non-trivial constraints on and which affect the decay
through one-loop diagrams.
For further discussions, see Ref. [13]..
The -quark mass and the CKM matrix
elements are related to each other through the mass
matrices of the up-type and down-type quarks.
However, there are many unknown factors for
these mass matrices, leaving open various possibilities
for the relations [10].
Therefore, for our numerical analyses, we assume that
the model parameters , , , and are
independent of each other.
For simplicity, these matrix elements are taken
as real.
The model parameters are further constrained [5] from
the branching ratio of , which has been measured
by CLEO [11] and ALEPH [12] as, respectively,
(1-) and
(1-).
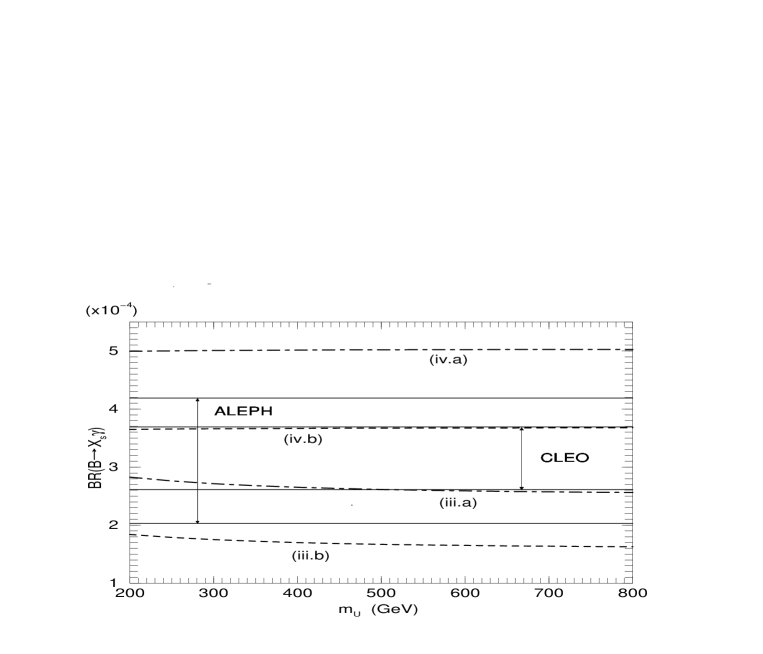
We show its predicted branching ratio in Figs. 1
and 2 for and , respectively,
as a function of the -quark mass.
The values of and are listed in Tables 1
and 2.
The experimental bounds are shown by solid lines.
For , the ranges and are
not allowed from the CLEO bounds, irrespectively of
the value for .
For , similarly excluded are the ranges
and .
The allowed ranges of and
do not depend very much
on the -quark mass.
A rather large part of the region which satisfies Eqs. (11)
and (12) becomes inconsistent with .
We now evaluate mixing within the obtained
parameter ranges consistent with the experiments.
In Figs. 3 and 4 the mixing parameter
is shown for the same parameter sets as those
in Figs. 1 and 2, respectively.
The solid line represents the SM prediction.
The parameter has a value between the curves (i) and (ii)
in Fig. 3 and the curves (iii) and (iv) in Fig. 4
for the ranges of allowed by the CLEO bounds.
A larger value for leads to a larger value for .
For and ,
the value of is larger than the SM value,
and their difference can be as much as a factor of two or more.
As the value of increases, this difference becomes small.
Still, a deviation by a factor of 0.5 of the SM value can
occur for and .
The value of does not affect much , while
a larger mass of the quark tends to give a larger value for .
The magnitude of the tree-level contribution to
is at most 20 percent of the SM value.
It should be noted that the value of may be
smaller than the SM value, which stands in contrast to the
prediction by the supersymmetric standard model [3].
In the SM, the measurement of determines the value of ,
which is examined from the point of unitarity for the CKM matrix.
Within the present accuracies for the values of and
, the range leads to unitarity violation.
More precise measurements of and ,
together with smaller errors in calculating and ,
will make it possible to examine the range .
Alternatively, the value of may be compared with that
measured by the top-quark decays.
A possible contradiction in these examinations within the framework
of the SM could imply the existence of the vector-like quarks.
In summary, we have studied the effects of the VQM
on mixing.
The contribution of the -mediated diagrams at the one-loop
level could be sizably different from that in the SM.
On the other hand, the -mediated diagrams at the tree level
cause merely a small effect.
The VQM is constrained from experimental results
for
the radiative decay .
Under these constraints, the mixing parameter can
non-trivially be larger or smaller than the SM prediction.
Its value could be more than twice the SM value.
The measurement of provides a useful test for the VQM.
The authors thank T. Onogi and M. Yamauchi for discussions.
The work of M.A. is supported in part by a Grant-in-Aid for
Scientific Research from the Ministry of Education, Science and
Culture, Japan.
References
[1]
For reviews, see
P.J. Franzini, Phys. Rep. 173 (1989) 1;
Y. Nir and H.R. Quinn, Annu. Rev. Nucl. Part. Sci. 42 (1992) 211.
[2]
N. Oshimo, Nucl. Phys. B404 (1993) 20.
[3]
G.C. Branco, G.C. Cho, Y. Kizukuri, and N. Oshimo,
Phys. Lett. B337 (1994) 316; Nucl. Phys. B449 (1995) 483.
[4]
Y. Nir and D. Silverman, Phys. Rev. D42 (1990) 1477;
D. Silverman, Phys. Rev. D45 (1992) 1800;
G.C. Branco, T. Morozumi, P.A. Parada, and M.N. Rebelo,
Phys. Rev. D48 (1993) 1167;
K. Fujikawa, Prog. Theor. Phys. 92 (1994) 1149;
G. Bhattacharyya, G.C. Branco, and D. Choudhury, Phys. Lett. B336 (1994) 487;
V. Barger, M.S. Berger, and R.J.N. Phillips, Phys. Rev. D52 (1995) 1663;
L.T. Handoko and T. Morozumi, Mod. Phys. Lett. A10 (1995) 309;
A10 (1995) 1733 (E);
C.-H. V. Chang, D. Chang, and W.-Y. Keung, Phys. Rev. D61 (2000) 053007.
[5]
M. Aoki, E. Asakawa, M. Nagashima, N.Oshimo, and A. Sugamoto,
Phys. Lett. B487 (2000) 321.
[6]
E. Asakawa, M. Marui, N. Oshimo, T. Saito, and A. Sugamoto,
Eur. Phys. J. C10 (1999) 327.
[7]
C. Bernard, hep-lat/0011064 (2000).
[8]
Particle Data Group, Eur. Phys. J. C15 (2000) 1.
[9]
A.J. Buras and R. Fleischer,
Heavy Flavours II, p. 65 (World Scientific, Singapore, 1998).
[10]
See e.g. K. Higuchi and K. Yamamoto, Phys. Rev. D62 (2000) 073005.
[11]
S. Ahmed et al. (CLEO Collaboration), CLEO CONF 99-10 (1999).
[12]
R. Barate et al. (ALEPH Collaboration), Phys. Lett. B429 (1998) 169.
[13]
M.R. Ahmady, M. Nagashima, and A. Sugamoto, Phys. Rev. D64 (2001) 054011.
Figure 1: The branching ratio of for
as a function of the -quark mass. Four curves correspond to
the four parameter sets given in Table 1.
The 1- allowed range of the branching ratio from
CLEO [11] and ALEPH [12] are also shown.
Figure 2: The branching ratio of for
as a function of the -quark mass. Four curves correspond to
the four parameter sets given in Table 2.
The 1- allowed range of the branching ratio from
CLEO [11] and ALEPH [12] are also shown.
Figure 3: The mixing parameter for
as a function of the -quark mass.
Four curves correspond to
the four parameter sets given in Table 1.
The solid horizontal line represents the SM prediction for GeV .
Figure 4: The mixing parameter for
as a function of the -quark mass.
Four curves correspond to
the four parameter sets given in Table 2.
The solid horizontal line represents the SM prediction for GeV .