On particle production for high energy neutrino beams
Abstract
Analytical formulae for the calculation of secondary particle yields in p-A interactions are given. These formulae can be of great practical importance for fast calculations of neutrino fluxes and for designing new neutrino beam-lines. The formulae are based on a parameterization of the inclusive invariant cross sections for secondary particle production measured in p-Be interactions. Data collected in different energy ranges and kinematic regions are used. The accuracy of the fit to the data with the empirical formulae adopted is within the experimental uncertainties. Prescriptions to extrapolate this parameterization to finite targets and to targets of different materials are given. The results obtained are then used as an input for the simulation of neutrino beams. We show that our approach describes well the main characteristics of measured neutrino spectra at CERN. Thus it may be used in fast simulations aiming at the optimisation of the long-baseline neutrino beams at CERN and FNAL. In particular we will show our predictions for the CNGS beam from CERN to Gran Sasso.
pacs:
13.85.NiInclusive production with identified hadrons and 29.25.-tParticle sources and targets and 29.27.EgBeam transport1 Introduction
A renewed interest in the predictions of absolute flux, energy distribution and flavour composition of neutrino beams produced at accelerators is motivated by the long-baseline neutrino beams in construction at CERN (CNGS CNGS ) and FNAL (NuMI NUMI ) and derived from the decays in flight of mesons generated by 400 GeV/c and 120 GeV/c proton interactions on graphite, respectively.
The available experimental data on particle yields from high energy proton interactions on light nuclei targets, such as the ones used in the production of neutrino beams, are not extensive and one is often faced with the problem of extrapolating to different target materials and shapes and to different incident proton energies.
Motivated by the need to estimate the neutrino flux at the West Area Neutrino Facility at CERN WANF , a consistent set of measurements of particle yields on Beryllium targets of different lengths were performed at CERN by the NA20 Coll. NA20 and subsequently by the NA56/SPY Coll. SPY1 ; SPY2 , with 400 GeV/c and 450 GeV/c incident protons, respectively. Secondary particles (, , , , , ) were measured in a transverse momentum range from 0 to 600 MeV/c, with the NA20 measurements in the high momentum range (60 GeV/c 300 GeV/c) and with NA56/ SPY extending to the low momentum region (7 GeV/c 135 GeV/c), thus covering also the relevant kinematic range of secondary particles for the planned long-baseline (LBL) neutrino beams.
In this work, in order to make these measurements of general applicability, the measured single-particle yields on Beryllium have been converted to single-particle invariant cross sections, correcting for target efficiency and tertiary particle production. The resulting data has been empirically parameterized as a function of the transverse momentum () and the scaling variable , defined as the ratio of the energy of the detected particle in the centre-of-momentum frame and the maximum energy kinematically available to the detected particle, with a formula based on general physical arguments. The choice of the variables used in the description of the invariant cross section is motivated by the approximate scaling behaviour of the invariant cross section, when expressed in terms of these variables. A satisfactory comparison of this empirical parameterization, based on data collected with 400 GeV/c and 450 GeV/c protons, with invariant cross section measurements with 100 GeV/c protons shows that such approach might be useful also for the prediction of the NuMI neutrino beam at FNAL.
Extension of the parameterization to target materials other than Beryllium is possible by the known dependence of the invariant cross section on the atomic number as shown in the measurements of Barton et al. Bar87 . This is particularly relevant for the planned long-baseline neutrino experiments at CERN and FNAL, both planning to use a graphite target.
Such parameterization of the invariant cross section for proton-nucleus interactions could be implemented in a full Monte Carlo simulation of the target geometry. On the other hand, we show that it is possible to compute analytically particle yields from a given target by taking into account the geometry of the target and the contribution of cascade processes. Based on the NA56/SPY measurements of particle yields from targets of different lengths, an empirical formula describing tertiary particle production is derived.
This approach, coupled to the tracking of the produced secondary hadrons through the neutrino beam-line elements (magnetic lenses, collimators and decay tunnel), has been implemented in a fast Monte Carlo for the explicit calculation of neutrino beam fluxes. Effects due to reinteractions in the beam-line material have been parameterized with good approximation. A comparison with the neutrino and anti-neutrino spectra measured by the CHARM II experiment at CERN is shown. Predictions for the planned CNGS long-baseline neutrino beam are given.
With respect to the standard approach using complex Monte Carlo simulations based on hadronic cascade codes, such as GEISHA GHEI or FLUKA92 FL92 , as implemented in the GEANT package GEAN , CALOR95 CA95 , the stand-alone version of FLUKA FONE or MARS MARS , a simple empirical parameterization of particle yields as described here has the advantage of a more transparent physical input to the calculations. Moreover, when coupled to the tracking of the secondary hadrons from the target, it becomes a fast neutrino Monte Carlo generator with the obvious advantage of enhanced statistics. Detailed studies of systematic effects due for example to horn misalignments in the neutrino beam-line are made possible even with limited computer time.
2 Parameterization of p-Be data
An empirical formula for particle production, based on the yields from thick Be targets measured by NA20, has long ago been proposed by Malensek Mal81 . This has already offered an alternative approach to neutrino beam computations NTeV . Extensions of this parameterization to include effects related to the target geometry have been proposed Bon96 . Malensek’s parameterization, however, fails to describe the particle production in the low momentum region covered by NA56/SPY measurements and cannot be stretched to consistently fit the whole set of available data on p-Be interactions. An alternative parameterization of NA20 data on particle yields, proposed by NA20 NA20 , gives an even less accurate description of the NA56/ SPY data.
At variance with these works, the particle yields measured by the NA20 and NA56/SPY collaborations have been converted to inclusive invariant cross sections for particle production, which have then been parameterized.
2.1 The data
In Ref. SPY2 , inclusive invariant cross sections for particle production in the forward direction in p-Be interactions have been reported by the NA56/SPY Collaboration. We have used the same method discussed in that paper to derive inclusive invariant cross section at all energies and angles from the published NA20 NA20 and NA56/SPY SPY1 ; SPY2 data on particle yields in p-Be interactions.
The inclusive invariant particle production cross section is related to the measured yields from targets of finite length by:
| (1) |
where is the yield per incident proton per sr ( %); , , the atomic mass number, density and length of the target; the Avogadro’s number; and the energy and momentum of the secondary particle, respectively. The target efficiency can be estimated assuming that the produced secondary particles if absorbed in the target do not generate additional particles. Under this approximation and for forward production, one has
| (2) |
representing the convolution of the probability that the primary proton interacts between and in the target and that the produced secondary particle escapes from the target ( and are the effective mean free paths of primary and secondary particles respectively). This model neglects the production of tertiaries. This effect can be accounted for, in a model independent way, by estimating the invariant cross sections for various target lengths and then extrapolating the results to zero target thickness SPY2 .
This procedure also allows to estimate at each momentum the contribution to the total yield from finite targets due to tertiary particles.
For particle production at angles different from zero, the method is easily generalised by taking into account the target geometry in eq. (2). At angles different from zero, however, the NA56/SPY collaboration has measured the production yields only at a fixed target length. In order to derive inclusive invariant cross sections from those data points, we have made the additional assumption that the correction for tertiary production be angle independent. This has been verified to be approximately true in the kinematic region covered by NA20 data, collected with a planar target setup identical to the one adopted in the NA56/SPY experiment.
In this way we have derived the single-particle inclusive invariant cross sections at all available energies and production angles from NA20 and NA56/SPY data. Table 1 summarizes our results. Errors include the experimental errors and the uncertainty on the extrapolation procedure.
| (mb/GeV) | ||||||||
| (GeV/c) | Ref. | |||||||
| 0.015 | 0. | 532.655.7 | 490.055.6 | 29.93.4 | 26.64.7 | 21.03.0 | 6.10.9 | SPY2 |
| 0.022 | 0. | 433.438.3 | – | 30.23.1 | – | 16.81.6 | – | SPY2 |
| 0.033 | 0. | 347.935.2 | 289.230.3 | 27.13.0 | 21.42.2 | 16.71.9 | 8.50.9 | SPY2 |
| 0.033 | 0.075 | 369.937.4 | 293.630.8 | 27.52.7 | 20.02.0 | 16.31.9 | 8.40.9 | SPY2 |
| 0.033 | 0.150 | 334.133.8 | – | 25.12.7 | – | 15.81.8 | – | SPY2 |
| 0.033 | 0.225 | 242.224.5 | 200.121.0 | 19.82.1 | 15.41.5 | 13.91.6 | 6.80.7 | SPY2 |
| 0.033 | 0.3375 | 127.712.9 | – | 14.21.6 | – | 10.51.2 | – | SPY2 |
| 0.033 | 0.450 | 68.46.9 | – | 8.80.9 | – | 7.81.0 | – | SPY2 |
| 0.045 | 0. | 293.024.8 | – | 27.02.5 | – | 18.01.6 | – | SPY2 |
| 0.067 | 0. | 222.014.9 | – | 22.21.6 | – | 18.91.5 | – | SPY2 |
| 0.090 | 0. | 169.79.7 | 137.87.8 | 18.41.1 | 11.50.8 | 19.21.2 | 5.20.3 | SPY2 |
| 0.090 | 0.075 | 176.19.9 | 139.37.8 | 18.01.2 | 11.50.8 | 19.01.2 | 5.30.3 | SPY2 |
| 0.090 | 0.150 | 186.410.5 | 135.37.6 | 17.01.1 | 10.50.7 | 18.01.1 | 4.90.3 | SPY2 |
| 0.090 | 0.225 | 160.29.1 | 114.56.4 | 14.71.0 | 9.60.7 | 16.61.0 | 4.80.3 | SPY2 |
| 0.090 | 0.450 | 58.23.3 | 44.02.5 | 7.70.5 | 4.60.3 | 10.00.6 | 2.70.2 | SPY2 |
| 0.090 | 0.600 | 22.81.3 | 20.31.1 | 3.90.2 | 2.60.2 | 6.00.4 | 1.60.1 | SPY2 |
| 0.150 | 0. | 111.17.0 | 64.54.7 | 11.70.9 | 5.50.4 | 24.41.8 | 2.40.2 | SPY2 |
| 0.150 | 0. | 105.06.5 | 70.54.5 | 10.70.7 | 5.720.46 | 22.31.5 | 2.770.21 | NA20 |
| 0.150 | 0.500 | 33.82.0 | 22.31.4 | 4.70.3 | 2.260.12 | 10.50.7 | 1.230.07 | NA20 |
| 0.300 | 0. | 64.04.6 | – | 5.00.4 | – | 40.63.0 | – | SPY2 |
| 0.300 | 0. | 68.14.7 | 23.21.4 | 5.300.37 | 1.510.09 | 43.13.0 | 0.4930.030 | NA20 |
| 0.300 | 0.300 | 35.42.4 | 14.10.9 | 4.130.28 | 1.060.07 | 32.02.1 | 0.3430.025 | NA20 |
| 0.300 | 0.500 | 17.11.2 | 8.40.5 | 2.600.17 | 0.660.04 | 20.41.7 | 0.2540.016 | NA20 |
| 0.500 | 0. | 14.64.3 | 5.000.29 | 1.700.50 | 0.2260.015 | 55.613.8 | (3.560.21)10-2 | NA20 |
| 0.500 | 0.500 | 4.490.30 | 1.640.09 | 0.850.06 | 0.0880.006 | 20.41.7 | (1.390.08)10-2 | NA20 |
| 0.750 | 0. | – | 0.270.02 | – | (2.820.17)10-3 | – | (1.320.07)10-4 | NA20 |
| 0.750 | 0.500 | 0.500.03 | 0.1140.008 | 0.1520.010 | (1.360.11)10-3 | 24.01.5 | (5.570.52)10-5 | NA20 |
2.2 The parameterization of inclusive invariant cross sections
One of the goals of this analysis is to adopt a simple functional form for inclusive particle production which will be appropriate for extrapolation to different centre of mass energies and/or secondary particle momenta.
Feynman has speculated in very general terms about the shape and energy dependence of inclusive processes Fey69 , suggesting an approximate scaling behaviour of the single-particle inclusive invariant cross section when expressed in terms of the transverse momentum () and the longitudinal variable , where and are the longitudinal momentum of the detected particle and the total energy in the centre-of-momentum frame. A factorization in and of the invariant cross section has also been advocated as an experimental fact.
An alternative scaling variable , defined as the ratio of the energy of the detected particle in the centre-of-momentum frame and the maximum energy kinematically available to the detected particle, was suggested by Yen Yen74 and Taylor et al. Tay76 and shown to greatly extend the range of validity of scaling at sub-asymptotic energies. As discussed in section 4.2, in the comparison of NA56/SPY and NA20 data to data collected at lower energies, we have not observed an improved scale invariance when is used. Nonetheless, we have adopted this variable because of two practical advantages, which translates in a simpler analytical parameterization: is always positive by construction and can never be zero, except for infinite energy in the centre-of-momentum frame.
| (mb/GeV2) | (GeV-1) | (GeV-2) | ||||||||
|---|---|---|---|---|---|---|---|---|---|---|
| 62.3 | 1.57 | 3.45 | 0.517 | 6.10 | – | 0.153 | 0.478 | 1.05 | 2.65 | |
| 7.74 | – | 2.45 | 0.444 | 5.04 | – | 0.121 | 1.15 | -3.17 | ||
| 8.69 | 12.3 | – | – | 5.77 | 1.47 | – | – | – | – | |
| 5.20 | – | 7.56 | 0.362 | 5.77 | – | – | – | – | – |
Early phenomenological analyses of data, based on the constituent quark model, helped clarify that in hadronic processes the produced particles reflect the motion of the constituents Och77 . In particular, in the fragmentation region of the projectile, the longitudinal momentum distribution of produced hadrons reflects the momentum distribution of valence quarks inside the incident hadron. This suggests an dependence of hadron production at large 111At large , and are equivalent. with a functional form similar to the one describing parton distributions. The functional shape of non-direct formation processes at small , in which sea quarks are involved, however, is not easily described in this framework.
After some trials and considerations of the physical process, the following empirical parameterization of the inclusive invariant cross sections for positive sign secondary meson (, ) production in p-Be interactions has been found to give a suitable description of data:
| (3) | |||||
where and .
These formula assumes an approximate factorized scaling form in and . The behaviour at large is theoretically motivated on the basis of quark counting rules Bla74 ; Gun79 . The behaviour empirically accounts for the non-direct hadron formation mechanism at small .
The behaviour is modelled with the known exponential fall of soft interactions and a polynomial behaviour to interpolate the low part of the spectrum. The dependence of and is introduced to parameterize the violation of invariance observed in the data. Models based on the parton structure of the hadrons predict a dependence of the cross section at large , where hard scattering processes take over. A reasonable parameterization of p-Be data with this functional form has not been found. The possibility that the proposed parametric form fail to describe particle production in the region not covered by present data is acknowledged.
The ratio r of positive to negative data ( or ) has been instead parameterized with the empirical formulae:
| (4) | |||
| (5) |
The shape of these ratios is supported by the phenomenological analysis of data of Ref. Och77 , showing that for and rises to about 5 for , closely following the ratio of valence quarks in the projectile proton, while has a behaviour for . NA56/SPY and NA20 data only cover the fragmentation region of the proton at large and the central region. At large a functional behaviour similar to the one exhibited by data is expected.
In order to keep the number of free parameters limited, positive and negative mesons are assumed to have the same distributions. This has long been known to be only approximate in data Allab .
Table 2 summarizes the results of our best-fit to the data. As indicated in the table, some of the parameters have been fixed in the fitting procedure, since they appeared to be redundant. In the fit, was chosen and was set to zero, since its fitted value was found to be consistent with zero within errors.
The comparison between the empirical parameterization and the experimental data is shown in figure 1. The accuracy of the parameterization of the and data is displayed in figure 2, showing the relative discrepancy between our parameterization and the experimental data as a function of . The proposed parameterization gives an accurate fit of data with a reduced , while the reduced is somewhat larger () for data. This partly reflects our difficulty to parameterize the dependence of the distribution, although about 1/3 of the is contributed by the two data points (one measured by NA20 and the other by NA56/SPY) for positive pion production in the forward direction at , which are about 30-40% off the best-fit prediction. A reduced around 1 is obtained, if a relative error of 10% on each experimental point is assumed. We conclude that the proposed empirical formulae are adequate to describe NA20 and NA56/SPY data with a 10% accuracy.


Proton and anti-proton data, which are of less direct interest for neutrino beams, have been parameterized with the following empirical formulae:
| (6) | |||||
| (7) | |||||
For anti-protons a functional similar to the one given in (3) has been adopted, except that an exact factorization in and has been assumed, since this was sufficient to give a reasonable fit to data. For protons the “leading particle effect” had to be taken into account. A reasonable fit to data has been obtained by following the empirical observation that the longitudinal momentum distributions of the leading nucleon in collisions is flat Coc71 , which translates into a linear rise of the inclusive invariant cross section as a function of . The transverse momentum distribution is also affected by the leading particle effect, resulting in an enhanced leading particle production in the forward direction (see for example Tay76 ; Allab ). In the proton fit, this is empirically accounted for by the term . The parameter , that controls the shape of the distribution for non-leading particle production, has been assumed to be the same for protons and anti-protons.
Results of these fits are also given in Table 2 and the comparison between the empirical parameterization and the experimental data is shown in figure 3. Our parameterization gives a satisfactory description of proton and anti-proton inclusive production, with a reduced about 1, in the range covered by NA56/SPY and NA20 data. At larger values of , proton production by means of diffraction should occur. This is not described by our parameterization.

3 Production of neutral Kaons
The knowledge of neutral kaon production in p-Be interactions is important for the exact calculation of the background in neutrino beams coming from decays. As an example, in the case of the WANF beam serving the CHORUS and NOMAD experiments, the estimated contribution to the content of the beam due to is around 15%. In addition, the knowledge of the neutral kaon production is also of interest for the experiments on CP-violation using neutral kaon beams and it is particularly relevant in searches for rare neutral kaon decays.
A rather complete set of data on production at angles different from zero was collected by Skubic et al. Sku78 , using a 300 GeV/c proton beam hitting Be targets. Measurements of production in the forward direction from 200 GeV/c protons on beryllium were performed by Edwards et al. Edw78 . Both these experiments, however, covered a region of secondary momenta corresponding to , which only partially overlaps to the momentum region important for present and future neutrino beams.
Additional information on neutral kaon production can be obtained starting from the available measurements of charged kaon production in p-Be interactions. Charged and neutral kaon production rates can be related in the frame of a simple quark parton model, in which valence quarks () and sea quarks () are considered.
In the simplest model, isospin symmetry may be assumed, giving , and , from which one finds that the production of charged and neutral kaons should be related by
| (8) |
This model has been shown to provide an accurate description of the asymmetry of / production in the range in neutral kaons beam-lines Dob90 . We have verified that it also agrees within 15% with direct measurements of production up to around . At larger values of , i.e. in the fragmentation region of the proton, we find that a reasonable description of existing production data requires a “dynamic” model in which the ratio is let to be -dependent and estimated from the production ratio, following the arguments given by Ochs Och77 , who has demonstrated a remarkable empirical similarity between the production ratio in collisions and the quark ratio measured in deep-inelastic lepton-proton scattering. The exploitation of this model is beyond the aim of this paper222A similar “dynamic” prediction of neutral kaon production was already considered in ref. Bor96 . These models however seems less accurate than formula (8) in the description of the / production asymmetry at small/intermediate . and neutral kaon production is always estimated from eq. (8) in the following.
4 Particle production for neutrino beams
4.1 Scaling to targets of different materials
Beryllium targets have been used in most neutrino beams derived from proton beams extracted from the Super Proton Synchrotron (SPS) at CERN, but the use of graphite as target material seems promising in view of operation with short spills in fast extracted proton beams. In particular, the use of a graphite target is foreseen in the design of both the CNGS and the NuMI beams CNGS ; NUMI . Prescriptions to rescale the inclusive invariant cross-sections to different target materials are given in the following.
Invariant cross sections for hadron-nucleus interactions () depend on the mass number of the target nucleus, via parameterizations of the type:
| (9) |
where a value for would correspond to the case where particle production off a nucleus is identical to the production off a single nucleon per inelastic collision. In accordance with the scaling hypothesis, has been found to be weakly dependent on the incident beam momentum. It depends on the incident hadron type and it is a smooth function of and of the produced hadron. It has moreover been experimentally observed that, in first approximation, it is independent of the detected particle type, with perhaps the exception of anti-protons Bar87 .
A parameterization of as a function of has been proposed by Barton et al. on the basis of their and previous data at GeV/c Bar87 . A dependence of has been clearly observed in and production by Skubic et al. Sku78 . A suitable representation of the whole set of data can be obtained with the parameterization:
| (10) |
where the dependence is taken from the fit of Barton et al. at GeV/c and the dependence is fitted to Skubic et al. data and normalized in such a way that it reduces to the parameterization of Barton et al. at GeV/c.
In conclusion, a conservative estimate of the uncertainty in the extrapolation from beryllium to carbon data sits (in the range of interest for neutrino beams: up to MeV/c) around 5%, on the top of a measurement error of 5–10%, depending on the secondary momentum, for the cross sections on beryllium. The estimate of this systematic uncertainty is based both on data collected by Barton et al. Bar87 and on the extensive compilation of J. Kuhn on nuclear dependence for interactions Kuh78 .
4.2 Scaling to different centre of mass energies
The NuMI neutrino beam at FNAL is planned to be derived from a primary proton beam of 120 GeV/c momentum, resulting in a centre-of-mass energy about two times smaller than that available at NA56/SPY and NA20. Besides its general interest, a test of the scaling hypothesis of one-particle inclusive invariant cross-sections is thus relevant to assess the range of validity of the proposed parameterization. This has been studied by comparing our parameterisation to available data collected at different centre-of-mass energies.


In figure 5, our prediction for one-particle inclusive invariant cross section are compared to data collected with 100 GeV/c protons on carbon target Bar87 , where the extrapolation from Be to C has been made using formulae (9) and (10). As discussed above has been used as scaling variable. The agreement between pion data shown in the figure and our empirical parameterization is excellent up to about . A good agreement is also found when kaon data are considered, although the precision of kaon data from ref. Bar87 is poorer.
Figure 5 shows a comparison of our parameterization with one-particle inclusive production data measured with 24 GeV/c protons hitting a Beryllium target Eic72 . In that work, Lorentz invariant particle densities were measured as a function of the particle momentum and production angle . These data have been converted into invariant cross sections using the relation
| (11) |
where is the absorption cross section for Car79 . A reasonable agreement is observed in the shape of the distributions for and , although the estimated production of is about 35 15% lower than that measured. This is also true for negative pions, not displayed in the figure, while the agreement is somewhat worse for the other particles.
Given its general interest, we have tested the scaling hypothesis on the same data also using and , the latter defined as the ratio of the momentum of the detected particle in the laboratory reference frame to the momentum of the incoming proton, as longitudinal variables. A better agreement with data is obtained, if is used, which however shows a worse agreement to kaon data333All the variables are off roughly by the same amount in the description of the production ratio.. The variable , where is the rapidity of the produced particle and is the maximum rapidity kinematically available to that particle, has also been tried. At variance with the previuos longitudinal variables, is Lorentz invariant and scales the phase space at different centre-of-mass energies independently of the reference frame. Although we find a somewhat improved agreement to data in this case, scaling to data collected with 24 GeV/c protons is only approximate even with this variable.
Still, in the centre-of-mass energy range of interest for present high-energy neutrino beams, the agreement between our parameterization scaled according to and the data is satisfactory.
4.3 Yields from finite length targets
With reference to eq. (1), the differential particle production along the target can be parameterized as:
| (12) |
where is the probability that the outgoing particle be produced at a depth to inside the target and the other quantities have been introduced in Section 2.1.
In general will also depend on the production angle of the secondary particle Bon96 . In the naive reabsorption model introduced in Section 2.1, one has:
| (13) |
which can be obtained by differentiating the target efficiency of equation (2), with representing the target length that the produced hadron has to cross to escape from the target ( for forward production). This naive model is only adequate to give a first order description of particle production from relatively thin targets or at large , but in general particle production by means of cascade processes cannot be neglected.
Since all types of hadrons can be produced when an energetic hadron of any flavour interacts in the target, the production of particles from a target of finite length is governed by a set of coupled transport equations that depend on the properties of the particles, their interactions and on the structure (geometry and material) of the target. Given their complexity, the solution of these equations is in general addressed numerically with hadron cascade/transport codes, calibrated on a large set of hadron production data. However, in the spirit of this work, the main features of the cascade process in needle-shaped targets, like those used for neutrino beams, can be described in a simple parametric form and tuned on NA56/SPY data on yields from targets of different length and geometry.
In hadronic interactions, about half of the available energy is typically dissipated in multiple particle production (inelasticity ) with average transverse momentum GeV/c . The remainder of the energy is carried by fast forward-going “leading” particles. Only these particles are responsible for the propagation of the cascade in thin and long targets, since they are almost collinear with the primary beam444The divergence of leading particles with respect to the primary beam is typically few mrad for proton energies of order a few hundred GeV. and their energy is large enough to result in a sizeable yield of additional energetic particles.
In the collinear approximation and assuming that leading particles in interactions are mostly protons, thus characterized by an effective mean free path equal to that of primary protons, the naive reabsorption model of equation (13) can be improved by the expansion:
| (14) |
where the second term in brackets accounts for particle production by reinteractions of secondary particles (tertiary particle production), while higher rank contributions are neglected, since neutrino targets are typically of order and the less energetic is the reinteracting particle the lower is the yield of produced particles.
In equation (14), weights the probability that reinteractions of secondary particles will result in a produced hadron of fractional longitudinal momentum and is given by:
where is the integrated cross section for inclusive production of in interactions and is the flux of particles. Thus, is a function of and only. Its dependence on these variables has been derived from NA56/SPY measurements of inclusive yields in the forward direction from finite length targets.
In the short target approximation, valid until the target length is , integration of equation (14) in the forward direction (i.e. ) predicts the fraction of tertiary particle production to be approximately a linear function of given by:
| (15) |
This linear behaviour is in agreement with experimental data, as shown figure 6, where the fraction of tertiary production as a function of target length for and as derived from NA56/SPY data is displayed, and was exploited in section 2.1 to derive inclusive invariant cross sections.


Compared to the naive absorption model, the excess of particle production present in the NA56/SPY data increases with decreasing momentum. Figure 7 shows the fraction of tertiary particles produced in the forward direction for a 100 mm target as a function of the fractional longitudinal momentum . The curves shown in the figure represent the best-fit of to data according to the empirical parameterization:
| (16) |
where a common value of and has been chosen for positive and negative particles. The best-fit results are reported in table 3.
| 0.80 | 1.56 | 7.3 | 10.1 |
In this simple model, no dependence of tertiary particle production is predicted. Indeed, assuming Feynman scaling and the (approximate) factorization in and of the invariant cross-section, the distribution of tertiary particles is expected to be the same as that of secondary particles. It follows that the divergence of leading particles with respect to the primary beam direction is in general negligible as compared to the typical production angle of lower momentum tertiary particles ( collinear approximation). These considerations are supported by NA56/SPY data that show no dependence of the transverse momentum distribution of tertiary particle production in a 300 mm Be needle-shaped target once mere geometric effects are considered (see figure 20 of Ref. SPY2 ).
Equation (14) is valid for NA56/SPY and NA20 targets, but fails to give the correct prediction for tertiary particle production when the target length is of order , where is the transverse dimension (radius) of the target and is the typical momentum of the leading particle. In this limit, there is a sizeable probability that some of the leading particles also escape from the side of the target before interacting. This can be accounted for, modifying equation (14) into:
| (17) |
where is an acceptance factor, which in general depends on the and energy distributions of the leading particles and on the target geometry555In equation (17), the collinear approximation has been again advocated to factorize the acceptance factor and the reinteraction probability of leading particles.. For cylindrical symmetry, one can write:
| (18) |
where in the collinear approximation and is the distribution of the produced particles.
In the simulation of neutrino beams, discussed in the following, the computation of this acceptance factor has been performed under the approximation that leading particles carry on average half of the primary beam momentum and that their transverse momentum distribution is represented by a pure exponential of average transverse momentum . For cylindrical symmetry this allows the analytical integration of equations (17) and (18). In case of continuous targets of radius , the integration yields:
| (19) |
which reduces to equation (14), predicting a linear increase of the differential production of tertiary particles along the target, until (short target approximation). At larger depth inside the target, the differential production of tertiary particles will tend to saturate to a value proportional to .
In case of a segmented target, made of several rods interleaved by air gaps, as that used in the WANF beam and considered for the forthcoming CNGS beam at CERN, the details of the target geometry have to be considered. The analytical integration of equations (17) and (18) is still possible under the same approximation as that adopted to derive equation (19) and it has been used in the evaluation of the efficiency of segmented targets.
In Figure 8 we present predictions for secondary meson production at target level, based on our parameterization of the inclusive invariant cross-sections corrected for target efficiency. Momentum spectra (top), angular distributions (middle) and exit point profiles (bottom) of the secondary mesons in the case of the CNGS target geometry and for an angular acceptance of 30 mrad (much larger than the horn aperture of the CNGS beam-line described in the next Section) are shown. For sake of comparison, the predictions of a FLUKA based full Monte Carlo program FONE ; CNGS are also shown. The agreement is remarkable, provided that tertiary particle production is taken into account in the evaluation of the target efficiency, as discussed in this Section.
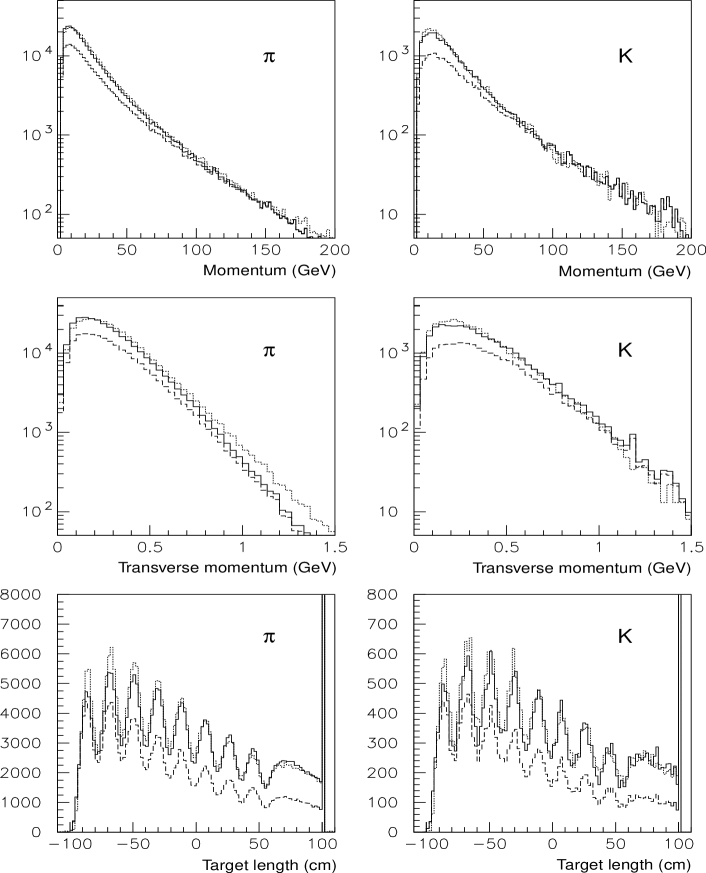
A slight disagreement in the distributions of all charged particles is visible mainly at large , that translates in a slightly more forward peaked distribution of the exit points along the target. This disagreement appears in a kinematic region not covered by NA56/SPY and NA20 data. However, as remarked in the next Section, neutrino beam predictions are only slightly affected by this large region, since it falls outside the momentum and angular acceptance selected by the focusing optics. The systematic difference between the two models is thus negligible.
5 Simulation of neutrino beams
As it is well known, a “classic” wide band neutrino beam is produced from the decay of mesons, mostly ’s and ’s. Mesons are created by the interaction of a proton beam into a needle shaped target, they are sign-selected and focused in the forward direction by two large acceptance magnetic coaxial lenses, conventionally called at CERN horn and reflector, and finally they are let to decay into an evacuated tunnel pointing toward the detector position.
In case of positive charge selection, the beam content is mostly from the decay of and . Small contaminations of (from the defocused and ) and (from three-body decay of ’s and ’s) are present at the level of few percent.
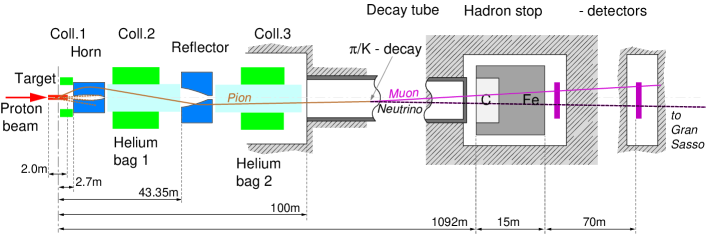
As an example, a schematic layout of the future CERN to Gran Sasso neutrino beam, CNGS CNGS , is shown in Figure 9. Its main characteristics, relevant for beam simulation purposes, are listed in Table 4 together with those of the old West Area Neutrino Facility (WANF) at CERN in the configuration set up for the CHARM II experimentWANF .
| Beam line | WANF | CNGS |
|---|---|---|
| Target material | beryllium | graphite |
| Target rod length | 10 cm | 10 cm |
| Target rod diameter | 3 mm | 4 mm |
| Number of rods | 10 | 8 |
| Rod separation | 9 cm | 9 cm |
| Additional end–rod length | – | 50 cm |
| Proton energy | 450 GeV | 400 GeV |
| Proton beam focal point | 50 cm from start of target | |
| Expected pot/year: | ||
| in shared SPS mode | ||
| in dedicated SPS mode | ||
| Horn & Reflector focusing momenta | 70–70 GeV | 35–50 GeV |
| Horn & Reflector length | 6.56 m | 6.65 m |
| Horn & Reflector current | 100–120 kA | 150–180 kA |
| Horn distance from focal point | 11.5 m | 2.7 m |
| Refl.distance from focal point | 82.8 m | 43.4 m |
| Horn acceptance | 10 mrad | 20 mrad |
| Decay tunnel length | 285 m | 992 m |
| Decay tunnel radius | 0.6 m | 1.22 m |
| Tunnel vertical slope | +42 mrad | -50 mrad |
| Pressure in decay tunnel | 1 Torr | 1 Torr |
The neutrino fluxes for such a kind of beam are relatively easy to predict once the secondary meson spectra are known, because the meson decay kinematics is well understood and the geometry of the decay tunnel is quite simple.
Uncertainty in the estimation of the neutrino fluxes could arise because secondary mesons are selected over a wide momentum range and over a wide angular acceptance ( mrad).
Re-interactions of secondary mesons in the target and downstream material contribute to reduce the neutrino fluxes and increase the uncertainty in the calculations (mainly for the wrong sign and wrong flavour contaminations). They are generally minimized using a target made of a number thin rods of low Z material interleaved with empty spaces (to let the secondary mesons exit the target without traversing too much material). In addition the amount of material downstream of the target (i.e. horn and reflector conductor thickness) is kept to the minimum.
The parameterization of the secondary meson production from protons onto a thin target, proposed in this paper, is thus well suited to be used in neutrino beam simulations both because it extends its prediction over a wide range of longitudinal and transverse momenta and also because the small fraction of tertiary production from re-interactions in the target and downstream material can be accounted for with the approximations described in Section 4.3.
A comparison of the neutrino flux prediction based on the proposed parameterization with some measured spectra is thus an effective estimator of the quality of the secondary mesons parameterization. For this purpose, our parameterization has been coupled with a neutrino beam simulation program able to provide rapid and accurate predictions of neutrino spectra at any distance (i.e. short and long base line). The comparison has been performed both with already published data (CHARM II) and with predictions for the future CNGS long-baseline neutrino beam generated with GEANT and/or FLUKA based Monte Carlo programs.
5.1 The simulation program
The program is a stand-alone code developed as a tool that allows to vary and optimize all elements and the geometry (in 3-D) of the beam line providing the results in terms of neutrino spectra and distributions at large distance with high statistics and in short time. As a by-product, the program provides also spectra and distributions of secondary hadrons and muons along the beam-line and in the muon monitor pits after the hadron stop at the end of the decay tunnel.
The underlying idea is that in order to produce rapidly a neutrino spectrum at large distance over a small solid angle (typically for the future LBL beams of CERN and FNAL), one has to force all the mesons to decay emitting a neutrino, and force all neutrinos to cross the detector volume. A weight is then assigned to each neutrino, proportional to the probability that this process actually happened.
In practice this method is implemented by subdividing the simulation into four subsequent steps (as described in detail in the following). The weight assigned to each neutrino is the product of factors originated in each step times the solid angle subtended by the detector:
5.1.1 Mesons production along target
First the total number of secondary mesons (, , , and ) to be generated is calculated by integration of the yield calculated in our model over the interesting range of longitudinal and transverse momenta. These numbers obviously depend on target material, density and length and on the number of protons on target.
Secondary mesons are generated along the target according to the distribution of proton interaction points. The latter depends on the proton beam size and divergence, on the target thickness, , and on the proton interaction length, , of the target material. Momentum and angular distributions of the mesons are sampled from the proposed parameterization. The weight associated with this step is
because protons are forced to interact in the target.
Meson trajectories in the target are calculated and their length, used to estimate the probability that the mesons exit the target without re-interacting: , where is the meson interaction length in the target.
5.1.2 Meson tracking in the neutrino beam-line
The trajectory of each meson in the beam-line is calculated, taking into account the tracking in the magnetic field of horn and reflector, until it hits the walls of the decay tunnel or the collimators. The amount of material crossed by the particle is also recorded.
The meson is forced to decay along its trajectory, , accordingly to its decay length, . The weight associated to this process is
where is the amount of material crossed up to the decay point and is the interaction length in that material.
5.1.3 Neutrino production from mesons
For each meson a neutrino is produced; its flavour and its momentum distribution in the parent meson rest frame depend on the decay mode and branching ratio, . The neutrino direction in the laboratory frame is determined requiring that it crosses the detector volume. The angle, , between parent meson and neutrino directions allows to calculate the Lorenz boost of the neutrino from the meson rest frame to the laboratory frame. This in turns allows to obtain the neutrino momentum in the laboratory frame.
The weight associated to this process is proportional to the probability that the neutrino is emitted in the detector direction. This is obtained by simply boosting back the solid angle subtended by the detector in the meson rest frame, where the neutrino is emitted isotropically;
where , and are the mass, energy and momentum of the secondary meson.
5.1.4 Neutrino production from muons
Muons are produced in the decay of secondary mesons taking into account the correct kinematics (branching ratio and polarisation). Muons are also tracked through the neutrino beam line and forced to decay to produce neutrinos in the detector direction. An additional weight, (equivalent to for meson decays), is introduced for the neutrinos from muon decay. A weight replaces accounting for the the muon decay kinematics (including polarisation).
5.2 Statistical accuracy
The statistical accuracy of this way of simulating neutrino beams does not depend much on the distance between the detector position and the neutrino source as it is the case for classical unweighted methods.
In the classical unweighted case, only a fraction of the pions (typically 5–10%) decay before interacting (either in the beam-line material or in the decay tunnel walls); in addition neutrinos are spread over a wide solid angle (about 1 mrad in the CNGS case) because of the decay kinematics. It follows that, to enhance statistics, at large distance the neutrino spectra need to be computed on a surface much wider than the actual detector area, relying on the fact that the spectra shapes varies slowly with the radius. In the CNGS case an accuracy of a few percent can be achieved with several millions protons on target if a detector area larger than m2 is considered.
In the parameterization case, since all mesons – within the focusing optics acceptance – are exploited to produce neutrinos in the detector, the statistical accuracy is independent from the detector distance and proportional to the inverse of the square root of the number of generated positive pions (for beams), namely about the number of generated proton interactions on target. An accuracy better than a percent is thus obtained with less than p.o.t., for any size of the detector surface.
5.3 Simulations of past and future neutrino beams
In order to give a more quantitative appreciation of the accuracy that one can obtain in the simulation of neutrino beams using the generator described in the previous Sections, we present the comparison with the published neutrino spectra measured with the CHARM II detector CHdet exposed at the CERN-WANF beam.
In addition we present the comparison between the CNGS simulation based on our method and that based on the FLUKA stand-alone program for secondary meson production interfaced with GEANT for particle tracking.
5.3.1 Comparison with CHARM II data
The WANF neutrino beam line at CERN, to which the CHARM II detector was exposed, is well described elsewhere WANF . Its main characteristics has been summarized in Table 4. The facility was run, during several years of operation, either selecting positive charged particles ( beam) or negative ones ( beam). Neutrino/anti-neutrino interactions were collected in the CHARM II detector and fully reconstructed CHARM .
In figure Figure 10–top, we show the comparison between the measured neutrino fluxes in case of positive mesons focusing, ( beam with contamination) and the simulation performed with our method and based on p.o.t.. On the left hand side a logarithmic scale is used to make evident the spectral behaviour at high energy as well as the wrong sign contamination; on the right hand side a linear scale is used for a better appreciation of the focusing/defocusing effect. In figure Figure 10–bottom, the same plots are shown in the case of negative meson focusing ( beam with contaminations).

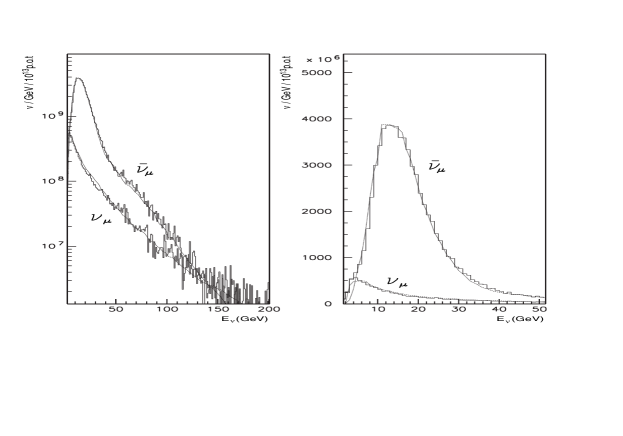
The overall agreement is at the percent level, with at most 10% disagreement on a bin per bin basis.
The high energy tails of the distributions are dominated by the production of high energy secondary mesons peaked in the forward direction, and are practically insensitive to the magnetic focusing. In fact high energy mesons, with small angular aperture, travel most likely through the neck of the horn where they are hardly deviated. The good agreement between simulation and data indicates that high production on target is well simulated and that re-interactions on the material along the beam-line is correctly taken into account.
In the focusing/defocusing energy range the agreement is an indication that low production is correctly generated at least up to mrad (the WANF optics acceptance). The fact that also the wrong sign contamination in the simulation behaves as the data, means that tertiary production in target and down-stream material (mainly the horn neck) is described to a sufficient level of approximation.
5.3.2 The CNGS beam-line
As mentioned earlier, our neutrino beam generator was originally developed to allow a rapid optimization of LBL neutrino beams. To test the reliability of it, we have performed a detailed simulation of the CNGS LBL neutrino beam for an extensive comparison with the full beam simulation based on the FLUKA stand-alone package FONE for secondary particle production and on GEANT for tracking along the beam line CNGS .
Apart from the tunnel geometry and the focusing optics, the main differences of the CNGS beam-line with respect to the WANF are the target material ( instead of ) and the proton beam energy ( GeV instead of GeV). These differences have been taken into account in our simulation with the scaling laws proposed and described in Section 4.2 and 4.3.
As remarked in Section 4.3, the agreement at the target level between our calculation and the FLUKA based full Monte Carlo program is noticeable, provided that tertiary production is taken into account in the former case. The slight disagreement visible in the distributions of all charged particles mainly at large translates in a slightly more forward peaked distribution of the exit points along the target.
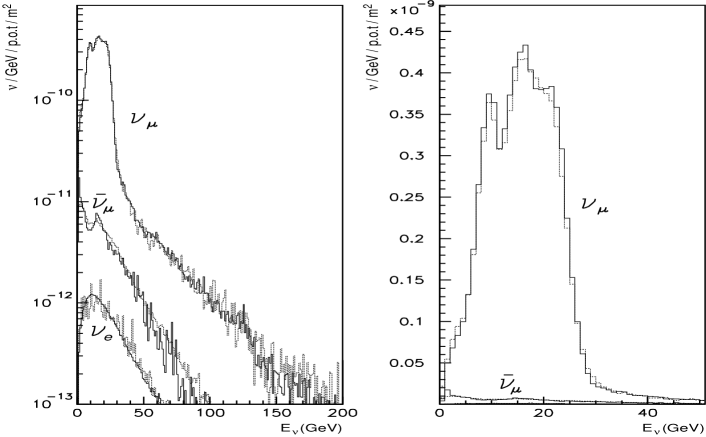
Remarkably enough, as far as the neutrino spectra at large distance are concerned, the discrepancies between the two models do not propagate with the same strength (see Figure 11). This is because in the momentum range and angular acceptance selected by the focusing optics both particle production models reproduce very well the available experimental data.
Before concluding, it is worth mentioning that early simulations of the CNGS beam line based on GEANT stand-alone disagreed with those presented here, being too optimistic by more than . On the other hand FLUKA stand-alone gives results fully compatible with those presented here.
6 Conclusions
Empirical formulae for single-particle inclusive invariant cross sections in -Be interactions have been derived, on the basis of single-particle inclusive production data collected by the NA20 NA20 and NA56/SPY SPY1 ; SPY2 experiments. These formulae reproduce the experimental data within a 10% accuracy.
The hypothesis of Feynman scaling has been verified to hold with our parametrisation giving a suitable representation of production data collected over a wide range of primary proton beam energies (from 24 GeV to 450 GeV).
Prescriptions to extrapolate this parameterization to finite targets and to targets of different materials have been given.
The results obtained have been used as an input for the simulation of neutrino beams. A comparison to data collected by the CHARM-II neutrino experiment at CERN has demonstrated the capability of this approach to predict the past.
These formulae can be of great practical importance for fast calculations of neutrino fluxes and for designing new neutrino beam-lines. Thus they may be used in fast simulations aiming at the optimisation of the long-baseline neutrino beams at CERN and FNAL. Predictions for the neutrino spectra of the CNGS beam from CERN to Gran Sasso have also been given.
Acknowledgements
We gratefully acknowledge enlightening discussions with and fruitful suggestions of K. Elsener, L. Gatignon, P.G. Ratcliffe, S.I. Striganov. We are indebted to P. Gorbunov, for having provided us the files with neutrino spectra measured in CHARM II. We are grateful to S. Ragazzi, our spokesman in the NA56/SPY collaboration, and P. Picchi for their encouragement to this work and to all our colleagues in the NA56/SPY collaboration.
References
-
(1)
G. Acquistapace et al., CERN 98-02; INFN/AE-98/05, 1998;
R. Bailey et al., CERN-SL-99-034-DI, 1999. -
(2)
The NuMI Facility Technical Design Report,
NUMI-346, October 1998;
The MINOS Detectors Technical Design Report, NUMI-L-337, October 1998. - (3) G. Acquistapace et al., CERN-ECP/95-14, 1995.
- (4) H.W. Atherton et al., CERN 80-07, 1980.
-
(5)
G. Ambrosini et al., Phys. Lett. B420 (1998) 225;
G. Ambrosini et al., Phys. Lett. B425 (1998) 208. - (6) G. Ambrosini et al., Eur. Jour. Phys. C10 (1999) 605.
- (7) D.S. Barton et al., Phys. Rev. D35 (1987) 35.
- (8) H. Fesefeldt, PITHA 85/02 report, 1985.
- (9) P. A. Aarnio et al., FLUKA User’s Guide, CERN TIS-RP (1990); TIS-RP-190 (1987);
- (10) R. Brun et al., “GEANT: Detector Description and Simulation Tool”, CERN Program Library, Long Writeup W5013.
-
(11)
T.A. Gabriel et al., ORNL/TM-11185
C. Zeitnitz, T.A. Gabriel, Nucl. Instr. Meth. A349 (1994) 106;
CCC-610/CALOR95 Code Package, available from Oak Ridge National Laboratory, USA. -
(12)
A. Fassó et al., Proc. of the Workshop on Simulating
Radiation Environments, Santa Fe, USA, January 1997,
LA-12835-C (p. 134);
A. Ferrari and P.R. Sala, NDST-97, Trieste, SIF Atti e Conferenze, p. 247, Vol. I (1998). - (13) N.V. Mokhov, S.I. Striganov, AIP Conf. Proc. 435 (1997) 543
- (14) A.J. Malensek, FERMILAB Report FN-341 (1981).
- (15) J. Yu et al., “NuTeV SSQT Performance”, FERMILAB Report TM-2040 (1998).
- (16) M. Bonesini, S. Ragazzi, T. Tabarelli de Fatis, Nucl. Instr. Meth. A378 (1996), 349.
- (17) R.P. Feynman, Phys. Rev. Lett. 23 (1969) 1415.
- (18) E. Yen, Phys. Rev. D 10 (1974) 836.
- (19) F.E. Taylor et al., Phys. Rev. D 14 (1976) 1217.
- (20) W. Ochs, Nucl. Phys. B118(1977), 397.
- (21) R. Blankenbecler and S.J. Brodsky, Phys. Rev. D10 (1974) 2973.
- (22) J.F. Gunion, Phys. Lett. B88 (1979) 150.
- (23) J.V. Allaby et al., Contribution to the 4th Int. Conf. on high-energy collisions, Oxford, 1972, vol. 2, p. 85
- (24) G. Cocconi, Nucl. Phys. B28 (1971) 341.
- (25) N. Doble, L. Gatignon and P. Grafstrom, NA31 Internal note 83 (1990). According to the authors, the formula and its derivation are due to Horst Wachsmuth.
- (26) P. Skubic et al., Phys. Rev. D 18 (1978) 3115
- (27) R.T. Edwards et al., Phys. Rev. D 18 (1978) 76
-
(28)
A.A. Borisov et al., Phys. Lett. B 369 (1996) 39;
A.S. Vovenko et al., “Calculation of neutrino spectra with a program based on the GEANT library”, preprint IFVE 95-94, Protvino, 1995 (Russian). - (29) T. Eichten et al., Nucl. Phys. B44 (1972) 333.
- (30) J. Kuhn, Phys. Rev. D18 (1978) 338
- (31) A.S. Carrol et al., Phys. Lett. B80 (1979) 319.
-
(32)
K. De Winter et al., Nucl. Inst. and Meth. A278 (1989) 670;
D. Geiregat et al., Nucl. Inst. and Meth. A325 (1993) 92. - (33) Neutrino spectra measured by the CHARM II collaboration and used in our comparison are published in P. Vilain et al., Eur. Phys. J. C11 (1999) 19, and have been kindly provided to us by P. Gorbunov.