UGVA-DPNC 2001/1-185 January 2001
hep-ph/0101158
A Phenomenological Analysis of Gluon Mass Effects in Inclusive Radiative Decays of the and
J.H.Field∗
Département de Physique Nucléaire et Corpusculaire Université de Genève . 24, quai Ernest-Ansermet CH-1211 Genève 4.
The shapes of the inclusive photon spectra in the processes and have been analysed using all available experimental data. Relativistic, higher order QCD and gluon mass corrections were taken into account in the fitted functions. Only on including the gluon mass corrections, were consistent and acceptable fits obtained. Values of GeV and GeV were found for the effective gluon masses (corresponding to Born level diagrams) for the and respectively. The width ratios were used to determine and . Values consistent with the current world average were obtained only when gluon mass correction factors, calculated using the fitted values of the effective gluon mass, were applied. A gluon mass GeV, as suggested with these results, is consistent with previous analytical theoretical calculations and independent phenomenological estimates, as well as with a recent, more accurate, lattice calculation of the gluon propagator in the infra-red region.
PACS 13.10.+q, 13.15.Jr, 13.38.+c, 14.80.Er, 14.80.Gt
Keywords ; Radiative decays of heavy quarkonia, Relativistic Corrections, Quantum Chromodynamics,
Gluon mass effects.
e-mail address: john.field@cern.ch
Second Revised Version May 2002
1 Introduction
As suggested by the inventors of QCD [1, 2], the colour symmetry of the theory is, conventionally, assumed to be unbroken, so that, theoretically [3], the gluon is supposed to have a vanishing mass. It was also conjectured, by the same authors, that the resulting infra-red divergences of the theory at large distances (‘infra-red slavery’) might explain the confinement of quarks. As is also well known, in the contrary case that gluons are massive, there is a possible breakdown of renormalisability as well as violation of unitarity at high energy by certain tree level amplitudes. These problems are common to all non-abelian gauge theories with massive vector mesons [4, 5].
These problems may be solved, as in the Standard Electroweak Model, by the introduction, also for the strong interaction, of spontaneous symmetry breaking and the Higgs mechanism [6]. Since, however, there is no experimental evidence for the existence of a Higgs boson for the strong interaction, or for electrically charged gluons, which are also predicted by some of these ‘broken colour’ theories, it is still generally supposed, in spite of the infra-red divergent nature of such a theory, that the QCD colour symmetry remains unbroken.
A possible way out of this dilemma (infra-red divergences if the gluon mass is zero, breakdown of renormalisabilty and unitarity if it is not) was suggested by Cornwall [7, 8] who suggested that non-vanishing gluon mass might be dynamically generated in a theory in which the colour gauge symmetry remained unbroken. Other authors [9, 10] pointed out that a gauge invariant, renormalisable and infra-red finite, version of QCD with massive gluons is possible, provided that a suitable four-vertex Faddeev-Popov ghost field is introduced into the theory.
The aim of the present paper is not to pursue further these theoretical considerations111 The interested reader is referred to Reference [11] for recent developments, and citations of the related literature, but rather to seek direct experimental evidence on the mass of the gluon. The processes considered, the radiative decays of ground state vector heavy quarkonia into a photon and light hadrons, are particularly well adapted to such a study, as the observed final state results from the hadronisation of a pure two gluon final state at the lowest order in perturbative QCD (pQCD). These are the ‘golden’ physical processes for the determination of the gluon mass, that may be compared to the neutral kaon system for the study of CP violation or Tritium -decay for the direct determination of the mass of the electron antineutrino. Indeed, the analogy between the process and Tritium -decay is a very close one. In both cases it is the study of the end-point region of a spectrum ( that of the electron for Tritium -decay, of the photon for the radiative decay) that give the mass limits on the or the gluon mass. The , being the lightest quarkonia is the most sensitive to the gluon mass, just as the Tritium -decay, with a very low energy release, gives the best direct limit on the mass. Indeed, as will be shown below, the suppression of the spectrum end point due to gluon mass effects, is much more severe in the case of radiative decays than for the heavier state.
Already in 1980, Parisi and Petronzio [12](PP) had suggested a mass of 800 MeV for the gluon, on the basis of the strong suppression of the end point of the photon spectrum in radiative decays, as measured by the MARK II collaboration [13]. In order to relate, however, in a precise way, the shape of the photon spectrum to the gluon mass, two other important physical effects, which also soften the shape of the photon spectrum, must also be properly accounted for. These are: (i) relativistic corrections and (ii) higher order QCD corrections. Because of the only recently available complete next-to-leading-order (NLO) pQCD calculation of the photon spectrum in the decays [14] and a much improved understanding of the phenomenology of relativistic corrections based on several recent and independent potential model calculations, the analysis presented below is the first to take fully into account the important effects (i) and (ii) and so confirm the conclusion of PP that the gluon mass is 1 GeV. At the time of writing, no calculation yet exists in which the effects (i) and (ii), as well as that of the gluon mass are taken into account in a unified way, so the present analysis is inevitably a phenomenological one where the three different types of corrections are assumed, loosely speaking, to ‘factorise’. Since, however, it is clear that the gluon mass effects are, by far, the most important, no large uncertainity on the results obtained are expected to result from this approximation.
The results presented below also confirm the conclusions of two previous, closely related, papers written by M.Consoli and the present author [15, 16](MCJHF1,MCJHF2). Some brief comments are made here on these papers: some more detailed remarks are made in Section 8 below.
In MCJHF1 effective gluon masses, , determined from fits to and were used, in conjunction with gluon mass correction factors calculated by PP (or re-calculated using pure phase-space considerations) to derive a large number of values from different charmonium and bottomonium branching ratios. Agreement with the expected pQCD evolution of from the scale to was only obtained when the gluon mass corrections were applied. Also, only in this case, was good agreement found between the derived values of and those obtained from deep inlastic scattering experiments. In this paper only the Photiadis [17] higher order (HO) QCD correction (that is only applicable in the end-point region of the photon spectrum, and does not include real gluon radiation effects) was used, and relativistic corrections were completely neglected.
The second paper, MCJHF2, made essential use of the recently proposed non-relativistic quantum chromodynamics (NRQCD) formalism of Bodwin, Braaten and Lepage (BBL) [18], in which both non-relativistic and HO QCD corrections (but not gluon mass effects) were treated in a rigorous way, order-by-order in perturbation theory, using an Operator Product Expansion. As suggested by BBL, the values of , and the leading relativistic correction parameter were treated as free parameters in fits to various charmonium and bottomonium decay widths. Similar fits were also performed to the inclusive photon spectra in and decays. No consistent values of and were found in the absence of gluon mass corrections. When the latter were included, consistent values of similar to those found in MCJHF1 were obtained. However, in this case, the values of were found to be much smaller in absolute value than the expectations from potential model calculations, and even (as discussed further in Section 8 below) of the wrong sign. The conclusion concerning the inability of the NRQCD formalism to describe the experimental data, in the absence of gluon mass corrections, was not however affected by the incorrect treatment of relativistic corrections.
The structure of this paper is as follows. Sections 2, 3 and 4 are devoted to descriptions of the implementation of relativistic, HO QCD and gluon mass corrections respectively. Fits to the experimental data on and to obtain, in each case, the corresponding effective gluon mass , are described in Sections 5 and 6. Section 7 describes the determination of and from the experimental branching ratios , . The values of obtained in this way are unaffected by relativistic corrections. In Section 8, the effective gluon mass values obtained in this paper are compared with other estimates of the gluon mass in the literature. Finally Section 9 contains a brief summary and outlook. Details of the method used to simulate the effects of experimental resolution on the inclusive photon spectrum are given in an Appendix.
2 Relativistic Corrections
| Reference | ||
|---|---|---|
| Bradley [29] | 0.44 | 0.069 |
| Eichten el al. [30] | 0.20 | 0.096 |
| Bergström el al. I [31] | ||
| 0.47 | — | |
| 0.21 | — | |
| 0.34 | — | |
| Bergström el al. II [32] | ||
| 0.47 | — | |
| — | 0.47 | |
| Beyer el al. [28] | 0.21 | 0.18 |
| Chiang el al. [25] | 0.21 | 0.078 |
| Chao el al. [26] | 0.26 | 0.13 |
| Schuler [27] | ||
| 0.36 | 0.075 | |
| 0.32 | 0.066 | |
| 0.25 | 0.048 |


Relativistic corrections to the van Royen-Weisskopf formula [19] for the decay rate of a vector meson V into a charged lepton pair:
| (2.1) |
were calculated by Bergström et al. [20]. A relativistic correction factor, , to the leptonic decay width was found with the general form:
| (2.2) |
where
| (2.3) |
and , and are the energy, momentum and mass of the bound heavy quark. is the wavefunction in relative momentum space, related to the spatial wavefunction at the origin, , by the expression:
| (2.4) |
In the approximation where the valence quarks of the vector meson are considered to be symmetrically bound in the meson rest frame, so that , it follows that
| (2.5) | |||||
Here is the ‘binding energy’ and is the velocity of the heavy quark222In units with . Using Eqn(2.5), (2.2) may be written as:
| (2.6) |
where is the mean value of the squared velocity, that depends on the bound state potential. Similar relativistic corrections were calculated for several decay processes of heavy quarkonia by Keung and Muzinich (KM) [21]. The calculation was based on a non-relativistic reduction of the Bethe-Salpeter equation [22] for the relativistic quark-antiquark bound state problem. The results of KM were presented as corrections to the decay rate rather than to the decay amplitude, as in Eqn(2.6) above. In the present paper all relativistic corrections are applied at the amplitude level so that additional terms are added to the results quoted by KM to ‘complete the square’ and obtain a positive definite decay rate. This correction is important only for charmonium decays where, because of the relatively large value of , the corrected decay rate becomes negative for both small and large values of , if only the correction terms are retained. KM confirm the relativistic correction factor for given in Eqn(2.6) and find also:
| (2.7) |
Of particular importance for the present study, KM also give, in their Eqn(3.5), the relativistic correction to the inclusive photon spectrum in . ‘Completing the square’ to obtain a positive definite differential decay rate yields the spectrum:
| (2.8) | |||||
where [23]:
| (2.9) |
and
| (2.10) |
The functions and are reported in Eqns(15) and (16) of Reference [16]. In the approximation used here, relativistic corrections are completely specified by the single parameter . Although one may hope, in the future, to determine this non-perturbative parameter by lattice QCD methods [24], the only existing estimates are derived from potential models of the quarkonium bound state. Some of the estimates of for the and the , that have been given in the literature, are presented in Table 1. Usually in these papers the relativistic correction factor for the decay is quoted. For the entries in Table 1, this is converted into a value of using Eqn(2.6). In the case of Chiang et al. [25] Eqn(2.7) is used, and for Chao et al. [26] the ratio . Schuler [27] calculated directly values of for a series of different charmonium and bottomonium states as a function of the prameter in a power-like potential of the form . The range of different values of presented in Table 1 is very wide: 0.20-0.47 for the and 0.048-0.47 for the . Apart from the estimates of Bergström et al. [32] and Beyer et al. [28] the value of is found to be significantly larger for the than for the , as intuitively expected, given the smaller mass of the charm quark. The near equality of the values of for the and the and the very large value found for the in References [32] and [28] may be a consequence of an extreme choice of the parameters of the potential in the case of the .
In the present paper, more weight is given to the more recent results of Chiang et al, Chao et al and Schuler which are roughly consistent with each other. In the following, the values taken are: for the and for the , which lie near the middle of the range of values obtained by these last three authors. As it will be seen that the effects of relativistic corrections on the shape of the fitted photon spectra are, after the inclusion of gluon mass effects, small (as already conjectured in Refs [15, 16]) the conclusions of the present work are not sensitive to the precise values assumed for . The relativistically corrected inclusive photon spectra for the and the calculated using Eqn(2.8) are shown, in comparison with the lowest order (LO) QCD prediction [33], in Figs.1a and 1b respectively. Also shown in Fig.1a is the curve given by truncating the correction to the decay rate above . In this case the spectrum is set to zero if the prediction is negative. It may be remarked that Eqn(2.8) shows singular behaviour as 333 The corresponding peaks near are suppressed in Fig.(1). However, this does not affect any of the fits presented below, as no experimental measurements exist for .
3 Higher Order QCD Corrections
To lowest order (LO) in perturbative QCD, the inclusive photon spectrum is described by the process . Assuming massless gluons and neglecting relativistic corrections, the shape of the photon spectrum is the same as in orthopositronium decay [33]:
| (3.1) | |||||
The first estimation of higher order QCD corrections to the spectrum was made by R.D.Field (RDF) [34]. These QCD effects were calculated using a parton shower Monte Carlo program in which the process was iterated. The invariant mass of the cascading virtual gluons was cut off at the scale GeV and a value GeV was used for the QCD scale parameter in the parton shower. For decays the average, perturbatively generated, ‘effective gluon mass’, i.e. the mass of the virtual gluon initiating the parton cascade, was 1.6 GeV. Because of the low value of the cut-off scale, the shapes of the photon spectra for and decays were predicted to be similar. In both cases the average value of was found to be 0.57, and even in the case of the decay of a hypothetical state with a mass of 60 GeV, the average increased only to 0.59. The RDF spectrum for decays is shown in Fig.2 as the dotted line. The parton cascade used by RDF does not take into account QCD coherence effects in gluon radiation [35] usually implemented in parton shower Monte Carlo event generators by an ‘angular ordering’ ansatz [36]. The effect of this coherence, which is the QCD analogue of the ‘Chudakov Effect’ [37] in QED, is to suppress corrections due to real gluon radiation for kinematical configurations that yield photons close to the kinematical end point. In this case the two primary recoiling gluons are almost collinear, forming an effectively colourless current from which the radiation of large angle secondary gluons is strongly suppressed by destructive interference [38]. The radiation of almost collinear gluons is not suppressed, but such radiation will hardly modify the shape of the LO spectrum. It is thus to be expected that the neglect of QCD coherence in the parton shower used to calculate the RDF spectrum will result in a too strong suppression of the spectrum in the end point region. The comparison, shown below, with a complete NLO perturbative QCD calculation, where such coherence effects are taken into account, indicates that this is indeed the case. The RDF spectrum gives a good description of four out of five of the experimental measurements of the spectrum (see Section 6 below). It will be seen however, that, for the case of decays, the spectrum is much too hard to describe the experimental measurements.
The second estimate of higher order QCD corrections to the inclusive photon spectrum in decays was made by Photiadis [17]. This calculation, expected to be valid near to , neglected completely real gluon radiation, which, as discussed above, is strongly suppressed in this region, but resummed to all orders in the leading logarithmic terms of the form resulting from the exchange of virtual gluons and quarks between the two recoiling gluons of the LO diagram. As shown in Fig.2 (the dashed curve), these effects give only a modest suppression of the LO spectrum near .
The most recent result on higher order QCD corrections to the spectrum is the complete NLO calculation of Krämer [14] that is also shown in Fig.2 as the solid curve. It can be seen that strong suppression occurs only very near to , and is much less marked than in the case of the RDF spectrum.
Since the Photiadis calculation does not include the effects of real gluon radiation, it can be argued that the corrections calculated by both Krämer and Photiadis should be applied. This will double count virtual corrections of the type shown in Fig.2c of Reference [14], but should give a better description, particularly away from the end point region, than using only the Photiadis correction.
To date, no calculations of the inclusive photon spectrum in heavy quarkonia decays have been made taking into account, at the same time, higher order QCD corrections, relativistic corrections and genuine gluon mass effects 444That is, including a fixed gluon mass in the calculation of both the invariant amplitude and the phase space, and taking into account the longitudinal polarisation states of the gluons. This is to be contrasted with the parton shower model of RDF where an effective gluon mass (actually a time-like gluon virtuality) is perturbatively generated from massless gluons. The distinction between ‘genuine’ and ‘effective’ gluon masses is discussed further in Section 4.. Indeed, since the pioneering paper of PP [12], gluon mass effects have been completely calculated only for the LO processes: and [39] (see Section 4 below).
In the present analysis, the higher order QCD calculations of Photiadis and Krämer, made for decays are also used, unmodified, for decays. In fact it will be seen that the observed end point suppression of the photon spectrum of the is so large, as compared to the predicted effect of both relativistic and higher order QCD corrections, that these play only a minor role. Indeed, the value of the effective gluon mass, , needed to describe the experimental spectrum is little affected by the inclusion of these corrections. The ansatz used to apply the higher order (HO) QCD corrections is to multiply the relativistically corrected photon spectrum given by Eqn(2.8) by the QCD correction factor:
| (3.2) |
In the case of fits with , phase space limitations are taken into account by the replacement: in Eqn(3.2) where
| (3.3) |
In view of the large value found for the ratio for the , it is to be expected that phase space suppression effects will be even more important for the HO corrections than for the LO process. This will reduce even further the effect of such corrections on the fitted value of .
4 Gluon Mass Effects
The possibility of gluon mass effects in the decay was first considered by PP [12]. They noted that the very strong suppression of the end point region of the photon spectrum measured by the Mark II collaboration [13] could be explained by introducing a gluon mass of about 0.8 GeV. The comparison of the PP prediction with the experimental data did not, however, take into account experimental resolution effects which are very large in this case. Also relativistic and higher order QCD corrections were not included. The aim of the present paper is perform a similar comparison to that made by PP, but using all available experimental data on both and radiative decays, as well as including experimental resolution effects, relativistic corrections and higher order QCD corrections. As the latter two effects also suppress the end point region of the photon spectrum, only a complete quantitative analysis, including all relevant effects, can show if the introduction of a non-vanishing effective gluon mass is required to describe the experimental data.
Introducing an ‘effective gluon mass’ in the calculation of the Born diagram has two effects:
-
(i)
Restriction of the available phase space, i.e. modification of the boundary of the Dalitz plot.
-
(ii)
Contributions to the amplitude from longitudinal gluon polarisation states.
As will be seen, the effect (i) is, by far, the most important.
The gluon mass is ‘effective’ because it is defined only at the level of the Born diagram. When such a prediction is fitted to the data, which includes QCD corrections to all orders, the value of is expected to be different from the value obtained if the gluon mass were correctly included also in higher order diagrams in the prediction. In fact, a ‘genuine’ gluon mass might be operationally defined as the effective mass corresponding to a hypothetical all-orders pQCD calculation with massive gluons. If phase space limitations are very important, as in the case of the , the tree level ‘effective’ value is expected to be lower than the ‘genuine’ value that would be found in a fit that properly includes gluon mass effects at all orders. If, on the other hand, the ‘genuine’ gluon mass is small compared to that of the decaying state, the effects of the non-vanishing gluon mass will be limited to a small region near the boundaries of phase space. In this case the tree level ‘effective’ mass is mainly generated perturbatively by splitting into gluon and quark pairs (as in the RDF model) and is expected to be much larger than the ‘genuine’ value. However, the ‘genuine’ mass found by comparing the prediction of the all-orders pQCD calculation to the data is expected to be independent of the mass of the decaying state. The above argument also shows that, for some mass of the decaying state, the tree level ‘effective’ mass and the ‘genuine’ gluon mass should be equal. It may be conjectured that this is almost the case for the .
The correction curves for the processes and calculated by PP and shown in their Fig.1 took into account both the effects (i) and (ii), but no explicit formulae were given. In the present paper essential use is made of formulae including both effects (i) and (ii) obtained by Liu and Wetzel [39]. For the decay , the fully differential spectrum is:
| (4.1) | |||||
Here is the radiative width uncorrected for gluon mass effects. The allowed phase space region is defined by the conditions555Note that is defined differently here than in Reference [16].:
| (4.2) | |||||
| (4.3) | |||||
| (4.4) | |||||
| (4.5) | |||||
| (4.6) |
In the gluon mass dependent fits to be presented below, the functions and in the KM formula (2.8) are replaced by the functions:
| (4.7) | |||||
| (4.8) |
Where is derived from Eqn.(4.1) and from Eqn.(3.5) of KM. Thus phase space effects are taken properly into account in both and , whereas the effect of longitudinal polarisation states are included only in . As will be shown below, the latter effect is much smaller than the former, so that the effect on the fit results of the uncalculated contribution of gluon longitudinal polarisation states on the relativistic correction coefficient is expected to completely negligible.
5 The Decay


| Experiment | Decay process | at () | |
|---|---|---|---|
| 9.6 | |||
| Mark II | 9.6 | ||
| 3.4 | |||
| CUSB | 3.2 | ||
| ARGUS | 7.8 | ||
| Crystal Ball | 1.8 | ||
| CLEO2 | 1.5 |
| Channel | z | BR104 | Relative BR |
|---|---|---|---|
| Resonances | |||
| 0.998 | 0.39 0.13 | 0.009 | |
| 0.969 | 8.6 0.8 | 0.2 | |
| 0.904 | 43.1 3.0 | 1.0 | |
| 0.784 | 17.0 4.0 | 0.39 | |
| 0.784 | 0.64 0.14 | 0.015 | |
| 0.784 | 9.1 1.8 | 0.21 | |
| 0.784 | 3.0 0.5 | 0.07 | |
| 0.677 | 1.3 0.9 | 0.030 | |
| 0.63 | 6.2 2.4 | 0.144 | |
| 0.484 | 2.9 0.6 | 0.067 | |
| 0.832 | 13.8 1.4 | 0.32 | |
| 0.828 | 6.1 0.9 | 0.14 | |
| 0.790 | 8.3 1.5 | 0.19 | |
| 0.765 | 5.7 0.8 | 0.13 | |
| 0.762 | 4.5 1.2 | 0.10 | |
| 0.758 | 4.7 0.6 | 0.11 | |
| 0.695 | 8.5 1.0 | 0.20 | |
| 0.603 | 7.0 2.2 | 0.16 | |
| 0.561 | 27.0 7.0 | 0.63 | |
| 0.486 | 0.8 0.4 | 0.019 | |
| 0.486 | 0.8 0.3 | 0.019 | |
| 0.486 | 0.15 0.08 | 0.003 | |
| Total BR (Res.) | 180 10 | 4.17 | |
| Exclusive states | |||
| – | 83.0 31.0 | 1.93 | |
| – | 28.0 5.0 | 0.65 | |
| – | 21.0 6.0 | 0.49 | |
| – | 61.0 10.0 | 1.42 | |
| – | 45.0 8.0 | 1.05 | |
| – | 15.9 3.3 | 0.37 | |
| – | 4.0 1.2 | 0.093 | |
| – | 40.0 13.0 | 0.92 | |
| – | 3.8 1.0 | 0.09 | |
| Total BR (Excl.) | 302 37 | 7.0 | |
| Total BR (Res.Excl.) | 482 38 | 11.2 | |
| fraction | fraction | CL | ||
|---|---|---|---|---|
| Mark II (25 dof) | ||||
| 0.0 | 0.0 | 0.610 0.015 | 51.7 | 210-3 |
| 0.074 | 0.015 | 0.720 0.012 | 17.5 | 0.86 |
| Mark II cascade (25 dof) | ||||
| 0.078 | 0.016 | 0.722 | 18.3 | 0.79 |
| Mark II conversion (22 dof) | ||||
| 0.073 | 0.015 | 0.597 0.019 | 20.0 | 0.58 |
| Fitted Model | CL | |
| Mark II (27 dof) | ||
| LO | 666 | 10-30 |
| Rel. Corrn | 336 | 10-30 |
| Rel. Corrn, QCD(P) | 279 | 10-30 |
| Rel. Corrn, QCD(K) | 253 | 10-30 |
| Rel. Corrn, QCD(PK) | 224 | 10-30 |
| Mark II cascade (26 dof) | ||
| LO | 348 | 10-30 |
| Rel. Corrn | 183 | 1.510-25 |
| Rel. Corrn, QCD(P) | 153 | 5.910-20 |
| Rel. Corrn, QCD(K) | 136 | 7.310-17 |
| Rel. Corrn, QCD(PK) | 121 | 3.310-14 |
| Mark II conversion (24 dof) | ||
| LO | 198 | 2.510-29 |
| Rel. Corrn | 80.9 | 4.410-25 |
| Rel. Corrn, QCD(P) | 66.3 | 7.810-6 |
| Rel. Corrn, QCD(K) | 50.8 | 1.110-3 |
| Rel. Corrn, QCD(PK) | 45.0 | 5.810-3 |
| Fitted Model | (GeV) | CL | |
|---|---|---|---|
| Mark II (26 dof) | |||
| LW | 0.734 0.010 | 24.6 | 0.54 |
| LW, Rel. Corrn | 0.740 | 22.6 | 0.66 |
| LW, Rel. Corrn | |||
| QCD(P) | 0.721 | 17.5 | 0.89 |
| LW, Rel. Corrn | |||
| QCD(K) | 0.665 | 19.9 | 0.80 |
| LW, Rel. Corrn | |||
| QCD(PK) | 0.653 | 16.9 | 0.91 |
| Mark II cascade (25 dof) | |||
| LW | 0.737 | 24.4 | 0.50 |
| LW, Rel. Corrn | 0.740 0.017 | 21.9 | 0.64 |
| LW, Rel. Corrn | |||
| QCD(P) | 0.719 0.019 | 18.4 | 0.82 |
| LW, Rel. Corrn | |||
| QCD(K) | 0.667 0.021 | 22.7 | 0.60 |
| LW, Rel. Corrn | |||
| QCD(PK) | 0.655 0.021 | 20.0 | 0.75 |
| Mark II conversion (23 dof) | |||
| LW | 0.623 | 31.6 | 0.11 |
| LW, Rel. Corrn | 0.607 | 23.9 | 0.41 |
| LW, Rel. Corrn | |||
| QCD(P) | 0.598 | 19.9 | 0.65 |
| LW, Rel. Corrn | |||
| QCD(K) | 0.537 | 22.5 | 0.49 |
| LW, Rel. Corrn | |||
| QCD(PK) | 0.526 | 20.3 | 0.62 |
To date, the inclusive photon spectrum in decays has been measured by only one experiment, the Mark II collaboration [13]. Actually, in Reference [13], three independent measurements of the spectrum are given. The first (referred to simply as ‘Mark II’) uses the process:
where the photons are detected in the electromagnetic calorimeter of the detector. The second, sample, ‘Mark II(cascade)’, uses the process:
In this case the acceptance and resolution are similar to the ‘Mark II’ measurement. The third data sample, ‘Mark II(conversion)’, uses radiative decay events where the photon converts into an pair in the beam pipe or the inner flange of the tracking chamber. Measurement of the momenta of the in the chamber yields a sample with reduced statistics but much improved photon energy resolution The photon energy resolutions for these three event samples are given in Table 2.
As well as these inclusive measurements, many exclusive measurements have been made where a single resonant state or an exclusive multihadron final state is produced in association with a hard photon [3]. These measurements are summarised in Table 3 where the values of for each exclusive channel with a single particle recoiling against the photon are given. As can be seen from Table 3 ( see also Fig.59 of Reference [40]) the most striking feature of the photon spectrum near the end point is the strong exclusive production of and mesons:
These two channels alone account for 13 of the total branching ratio for and completely dominate the end point region . Because of the large contribution of these two resonances, it was not possible to obtain acceptable fits to the spectra using the function of Eqn.(2.8) even when HO QCD corrections and gluon mass effects were included. The procedure adopted was then to fix the ratio to the measured value 5.0 [3], and perform fits treating the ratio:
as a free parameter, which include the and contributions at the appropriate values of 0.904 and 0.969 respectively. Here ‘ continuum’ refers to Eqn(2.8), including also gluon mass effects and the Photiadis HO QCD correction. The other two parameters in the fit are an overall normalisation constant and the effective gluon mass . The method used to fold in the experimental resolution function is described in the Appendix. As shown in Table 4, attempting to fit the spectrum without explicitly introducing the and contributions (i.e. with ), leads to an unacceptably low confidence level (CL) of 3 10-3. However, including their contributions, good fits are obtained for all three spectra with consistent values of . Their weighted average is:
The Mark II and Mark II(cascade) spectra yield consistent values of around 720 MeV, but the Mark II(conversion) spectrum gives a significantly lower (5.8 ) value of 597 MeV, indicating some systematic difference in the latter measurement. The weighted average value of corresponds to :
which may be compared to the summed branching ratio of all channels reported in Table 3 of . So it is estimated that 76 of all radiative decays to light hadrons are contributed by the exclusive channels listed in Table 3.
The results of fits to the three inclusive photon spectra, including the exclusive and contributions, estimated using the weighted average value of obtained above, without including gluon mass effects, are presented in Table 5 and Fig.3. No acceptable fits are obtained, even after the inclusion of of both relativistic and HO QCD corrections. The best confidence levels obtained for the fits to the Mark II, Mark II(cascade) and Mark II(conversion) spectra are: , and respectively. Although, as expected from Fig. 1, the shape of the spectrum is drastically modified by the relativistic correction, the change in shape, though qualitatively in the right direction, is, by far, not enough to explain the observed spectrum shape. As can be seen in Fig. 3a, the estimated effects of HO QCD corrections are even smaller than those of the relativistic correction.
A similar series of fits, but including gluon mass effects, is presented in Table 6 and Fig.4. Good fits are obtained in all cases, and it can be seen that the inclusion of relativistic and HO QCD corrections have only a minor effect on the fitted values of . For example, in the case of the largest statistics (Mark II) data sample, introducing the relativistic correction increases the fitted value of of 734 MeV by only 6 MeV. Further applying either the Photiadis or Krämer HO QCD corrections give further shifts of -19 MeV or -75 MeV respectively in the fitted value. In fact because of the relatively large value of as compared to , it is to be expected, as mentioned previously, that HO QCD corrections will be much reduced by by phase space and propagator suppression effects. Choosing then the fit with relativistic and the smallest (Photiadis) HO QCD correction as best estimate yields the result:
where the first error is statistical (from the fit to the Mark II spectrum) and the second is systematic, conservatively estimated from the full spread of the different fit results to the Mark II data given in Table 6. In view of the size of this systematic error in the Mark II value, and the large observed systematic shift in obtained with the Mark II(conversion) spectrum, no significant improvement in the knowledge of is expected by combining the results of the fits to the three spectra. The less precise values provided by the Mark II(cascade) and Mark II(conversion) data should then be considered as consistency checks.
It may be noted that the exclusive signal is clearly seen in the Mark II(conversion) spectrum shown in Figs. 3c and 4c. The shape of the observed peak is well described in Fig. 4c by the fit including the relativistic and Photiadis HO QCD corrections, and the experimental resolution function given in Table 2. This agreement gives an important cross check on the method used here (see the Appendix) to fold in the experimental resolution effects.
In order to study the relative importance of phase space effects and longitudinal gluon contributions in the gluon mass fits, the fit to the Mark II data, including both the relativistic and the Photiadis HO QCD corrections, is repeated setting in the function of Eqn(4.7), thus removing the longitudinal contributions. A very good fit is still obtained (confidence level 0.94) with GeV. This is only 5.4 lower than the value GeV obtained including the longitudinal contributions. Thus the gluon mass correction is dominated by phase space effects.
6 The Decay


| Fitted Model | CL | |
|---|---|---|
| CUSB (11 dof) | ||
| LO | 30.2 | 1.510-3 |
| Rel. Corrn | 10.9 | 0.45 |
| Rel. Corrn, QCD(P) | 14.7 | 0.2 |
| Rel. Corrn, QCD(K) | 13.0 | 0.29 |
| Rel. Corrn, QCD(PK) | 21.3 | 0.03 |
| ARGUS (19 dof) | ||
| LO | 95.3 | 3.810-12 |
| Rel. Corrn | 62.6 | 1.510-6 |
| Rel. Corrn, QCD(P) | 44.7 | 7.510-4 |
| Rel. Corrn, QCD(K) | 49.8 | 1.410-4 |
| Rel. Corrn, QCD(PK) | 37.6 | 6.710-3 |
| Crystal Ball (14 dof) | ||
| LO | 51.9 | 2.9 10-6 |
| Rel. Corrn | 31.6 | 4.610-3 |
| Rel. Corrn, QCD(P) | 22.4 | 0.071 |
| Rel. Corrn, QCD(K) | 24.6 | 0.039 |
| Rel. Corrn, QCD(PK) | 18.9 | 0.17 |
| CLEO2 (22 dof) | ||
| LO | 90.7 | 2.610-10 |
| Rel. Corrn | 56.9 | 6.310-5 |
| Rel. Corrn, QCD(P) | 32.1 | 0.076 |
| Rel. Corrn, QCD(K) | 48.8 | 8.510-4 |
| Rel. Corrn, QCD(PK) | 29.5 | 0.131 |
| Fitted Model | (GeV) | CL | |
|---|---|---|---|
| CUSB (10 dof) | |||
| LW | 0.66 0.08 | 5.2 | 0.88 |
| LW, Rel. Corrn | 0.64 0.09 | 6.1 | 0.81 |
| LW, Rel. Corrn | |||
| QCD(P) | 0.54 0.12 | 13.1 | 0.22 |
| LW, Rel. Corrn | |||
| QCD(K) | 0.16 | 12.6 | 0.25 |
| LW, Rel. Corrn | |||
| QCD(PK) | 0.15 | 21.0 | 0.021 |
| ARGUS (18 dof) | |||
| LW | 1.39 | 27.3 | 0.074 |
| LW, Rel. Corrn | 1.39 0.10 | 28.8 | 0.051 |
| LW, Rel. Corrn | |||
| QCD(P) | 1.27 | 23.3 | 0.18 |
| LW, Rel. Corrn | |||
| QCD(K) | 1.19 | 34.4 | 0.011 |
| LW, Rel. Corrn | |||
| QCD(PK) | 1.06 | 28.8 | 0.05 |
| Crystal Ball (13 dof) | |||
| LW | 1.21 | 21.5 | 0.064 |
| LW, Rel. Corrn | 1.21 | 22.2 | 0.052 |
| LW, Rel. Corrn | |||
| QCD(P) | 1.14 | 18.0 | 0.16 |
| LW, Rel. Corrn | |||
| QCD(K) | 0.90 | 23.5 | 0.036 |
| LW, Rel. Corrn | |||
| QCD(PK) | No | — | — |
| CLEO2 (21 dof) | |||
| LW | 1.27 0.07 | 29.5 | 0.103 |
| LW, Rel. Corrn | 1.25 | 30.4 | 0.08 |
| LW, Rel. Corrn | |||
| QCD(P) | 1.15 | 16.9 | 0.72 |
| LW, Rel. Corrn | |||
| QCD(K) | 1.03 | 34.5 | 0.032 |
| LW, Rel. Corrn | |||
| QCD(PK) | 0.90 | 22.5 | 0.37 |
Five different experiments have measured the inclusive photon spectrum in decays: CUSB [41], CLEO [42], ARGUS [43], Crystal Ball [44] and CLEO2 [45]. The CLEO measurement, which, like Crystal Ball, ARGUS and CLEO2, but unlike CUSB, is in good agreement with the RDF prediction, is not analysed in the present paper as no efficiency corrected spectrum was provided.
Unlike for the case of the , no positive evidence has been found for the exclusive production of single resonances in the radiative decays of the [3]. The efficiency corrected inclusive photon spectra measured by CUSB, ARGUS, Crystal Ball, and CLEO2 have therefore been directly fitted to the relativistically corrected spectrum Eqn(2.8), possibly also including HO QCD corrections as discussed in Section 3 and gluon mass effects as described in Section 4. Experimental resolution effects are included in the same way as for the fits to the decays described above. The photon energy resolutions of the different experiments are given in Table 2. Results of fits assuming a vanishing effective gluon mass are presented in Table 7 and Fig.5, while fits to and an overall normalisation constant yield the results shown in Table 8 and Fig.6.
As can be seen in Figs.5 and 6, the CUSB spectrum differs markedly in shape from those of the later ARGUS, Crystal Ball, and CLEO2 experiments. The suppression of the end-point region, relative to the LO QCD prediction (the dash-dotted curves), is much reduced. The results of the fits to the CUSB data should be treated with caution as, unlike the other experiments, the published errors on the photon spectrum are are purely statistical. A relatively large systematic error is expected (as found in the other experiments) from the separation procedure, especially at lower values of .
Considering first the fits with in Table 7, it can be seen that the LO spectrum is ruled out, individually, by all four experiments. Inclusion of the relativistic correction with gives a good description of the CUSB data but is ruled out with a confidence level of less than 0.5 by each of the other experiments. The best overall description is given by combining the relativistic and Photiadis HO QCD corrections. Low, but acceptable, confidence levels of 0.2, 0.071 and 0.076 are found for the fits to CUSB, Crystal Ball and CLEO2 data, respectively. Only the ARGUS spectrum (CL = 7.510-4) is inconsistent with this hypothesis. However, combining the fits to all four experiments gives (CL=2.310-4).
For ARGUS, Crystal Ball and CLEO2 the best fits are given by including both the Photiadis and Krämer HO QCD corrections. The combined fit gives, however, (CL=4.710-3). Thus no consistent overall description of the data is found for .
When the effective gluon mass is included as a fit parameter it can be seen (Table 8) that fits with confidence levels are found for all fit hypotheses and all experimental spectra. However, the ARGUS, Crystal Ball and CLEO2 data give consistent values of in the range 0.9-1.4 GeV, whereas significantly lower values 0.15-0.66 GeV are found in the fits to the CUSB spectrum. Because of this discrepancy and the neglect of (potentially large) systematic errors in the latter experiment, only the results from the three most recent experiments are used to obtain the average value of quoted below. For these experiments the best overall fit is given (as in the case ) by including both the relativistic and the Photiadis HO QCD correction. This yields, for the weighted average value of the effective gluon mass:
where the error quoted is derived from fit errors of the different experiments. Performing a fit to the ARGUS, Crystal Ball and CLEO2 spectra, with fixed at the above value, and varying only the normalisation constants of the fitted curves gives a good overall fit with (CL0.33). Making the same type of fit, but including CUSB leads to: (CL=4.310-5). The published CUSB data is therefore clearly inconsistent with value of favoured by ARGUS, Crystal Ball and CLEO2. This apparent inconsistency of the CUSB measurement, is, however, very sensitive to the error assignement of the data. Increasing the quoted (purely statistical) errors by a constant factor of 1.5 to account for systematic effects, modifies the last fit result quoted above to: (CL0.031). The CUSB measurement is now marginally consistent with the average of the three other experiments.
The theoretical systematic error on is estimated in the same way as for decays. This gives:
where the first error is experimental and the second is a conservatively estimated theoretical error that that includes the full range of relativistic and HO QCD corrections in the fits to the CLEO2 data in Table 8.
To investigate the importance of the effects of longitudinal gluon polarisation states for the case of the , a fit is made to the CLEO2 data including relativistic and the Photiadis HO QCD corrections, with in the function of Eqn(4.7). The fit gives GeV with (CL0.91) to be compared with GeV with (CL0.70) when longitudinal gluon contributions are included in . As in the case of the , longitudinal gluon states give only a small effect; they increase the fitted value of by only 4.5.
Finally in this Section a few remarks on the CLEO measurement [42], which is not included in the present analysis. Relativistic corrections were not taken into account in the theoretical predictions, which were suitably modified to account for detector acceptance and resolution effects before comparison with the (uncorrected) experimental data. Fitting the LO QCD, Photiadis and RDF spectra to the data yields of 14.2, 10.0, and 8.1, respectively, for eleven degrees of freedom [42]. The corresponding respective confidence levels are 0.22, 0.46 and 0.70. Although the RDF model is slightly favoured, all the fits have acceptable confidence levels and no distinction between the different theoretical models is possible from this measurement.
7 Determinations of
| Branching ratio | Experimental value | Reference |
|---|---|---|
| 0.632 0.022 | [3] | |
| 0.0624 0.0067 | This paper | |
| 10.13 1.14 | Ratio of above | |
| 33.33 2.44 | ARGUS [43] | |
| 37.04 6.17 | Crystal Ball [44] | |
| 36.36 2.11 | CLEO2 [45] | |
| 35.46 1.51 | Weighted average |
| 0.6 | 1.0 | 2.0 | |
|---|---|---|---|
| 0.178 0.011 | 0.184 0.015 | 0.213 0.023 | |
| -0.179 0.022 | -0.173 0.024 | -0.144 0.03 | |
| Deviation() | -8.1 | -7.2 | -4.8 |
| 0.169 0.005 | 0.169 0.006 | 0.186 0.008 | |
| -0.048 0.008 | -0.048 0.009 | -0.031 0.01 | |
| Deviation() | -6.0 | -5.3 | -3.0 |
| Phase Space | ||||
|---|---|---|---|---|
| LW | ||||
| Phase Space | ||||
| LW |
| 0.6 | 1.0 | 2.0 | No O() Corr. | |
|---|---|---|---|---|
| 0.221 | 0.298 | 0.467 | 0.525 | |
| -0.136 0.027 | -0.059 0.025 | 0.110 0.120 | 0.168 0.133 | |
| Deviation() | -5.0 | -2.4 | 0.9 | 1.3 |
| 0.189 | 0.193 | 0.221 | 0.248 | |
| -0.028 0.009 | -0.024 0.011 | 0.004 0.016 | 0.032 0.025 | |
| Deviation() | -3.1 | -2.2 | 0.25 | 1.2 |
| 0.6 | 1.0 | 2.0 | No O() Corr. | |
|---|---|---|---|---|
| 0.224 | 0.332 | 0.617 | 0.681 | |
| -0.133 0.019 | -0.025 0.024 | 0.260 0.178 | 0.324 0.187 | |
| Deviation() | -7.0 | -1.0 | 1.5 | 1.7 |
| 0.197 | 0.205 | 0.239 | 0.271 | |
| -0.020 0.009 | -0.012 0.012 | 0.022 0.033 | 0.054 0.040 | |
| Deviation() | -2.2 | -1.0 | 0.67 | 1.4 |
| Experiment | |
|---|---|
| CUSB | |
| ARGUS | |
| Crystal Ball | |
| CLEO | |
| Weighted Mean |
The strong coupling constant may be determined from the experimental measurements of the branching ratio:
| (7.1) |
where denotes a vector heavy quarkonium ground state ( or ). Use of has the advantage, as compared with other branching ratios sensitive to (for example , that relativistic corrections cancel in the approximation used in the present paper.
In Eqn(7.1) the process ‘’ is understood to be the heavy quark annihilation process into light hadrons, for which the lowest order QCD process is . Thus the non-annihilation process , where is the lowest-lying pseudoscalar heavy quarkonium ground state, is not included. Similarly, ‘’ is understood to be the direct (strong interaction) process for which the lowest order QCD process is . The contribution of the radiative process: (branching ratio 17 for the ) is, therefore, not included.
The experimental branching ratios used here to extract are summarised in Table 9. For the the branching ratio , where denotes the total width of the , is obtained from the fits to the branching ratio presented in Table 4. The measured exclusive branching ratio into [3], is used to derive, from , the branching fraction for ‘’ (see Section 5 above). The measured exclusive and ’ fractions are then added to the ‘’ fraction to give the full branching fraction into quoted in Table 9. The errors on this quantity are derived from that on the weighted average value of and the experimental and ’ fractions [3]. The branching fraction is derived from the total hadronic width of the given in Ref [3] by subtracting the contribution [3] of the process .
In the case of the measurements, the branching ratio was directly measured by CUSB, CLEO, ARGUS, Crystal Ball and CLEO2. The values of obtained by the last three of these experiments are reported in Table 9. In all cases the extrapolation of the measured photon spectrum to was done using the RDF theoretical spectrum. As will be shown below, the shape of this spectrum is in good agreement with the fit curves obtained in the present paper, which take into account relativistic corrections and explicit gluon mass effects at the born level. This shape is little affected by including HO QCD corrections according to Ref [17] and/or Ref [14]. To extract , the weighted average (also reported in Table 9) of the measurements of ARGUS, Crystal Ball and CLEO2 is used.
Consistent results for were found by CUSB: 33.4 6.6 and CLEO (using the RDF spectrum): 39.4 3.6. Since, however, the shape of the inclusive photon spectrum measured by CUSB is inconsistent with those measured by the other four experiments, and the analysis of the CLEO photon spectrum could not be performed, these two measurements are omitted from the average used here to determine . Thus, the analysis is performed using only data from experiments for which a consistent determination of the effective gluon mass was possible. Including also the CUSB and CLEO measurements in the weighted average of gives the value 35.94 1.36 which differs by only 0.35 from the weighted average of ARGUS, Crystal Ball and CLEO2 quoted in the last row of Table 9.


Taking into account NLO QCD radiative corrections [46] as well as gluon mass corrections, may be derived from the formulae:
| (7.2) | |||||
| (7.3) |
Here is the one-loop QCD beta function coefficient:
where the number of active quark flavours, , is taken to be 3 for the and 4 for the . The values of the heavy quark masses are assumed to be GeV and GeV. The parameter is an arbitary renormalisation scale, and , are correction factors taking into account gluon mass effects. As previously pointed out, relativistic corrections cancel in the ratio . For any given value of the renormalisation scale , Eqns.(7.2) or (7.3) are solved for . The corresponding value of is then found by use of the one-loop QCD evolution formula:
| (7.4) |
Setting ( i.e. neglecting gluon mass corrections) and choosing the values666Eqns.(7.2) and (7.3) have no real solution for when 0.5 0.6, 1.0 and 2.0 yields the values of and reported in Table 10. It can be seen that there is poor agreement with the world average values [3]:
These are calculated using Eqn.(9.5) of reference [47] and correspond to four active quark flavours. Matching to the five flavour region where MeV (corresponding to the world average value ) is done using Eqn.(9.7) of reference [47] at a matching scale of 4.3 GeV. For both the and the the best agreement is found for , but the respective deviations are still 4.8 and 3.0. Fig.7 shows a comparison of the and values quoted in Table 10 for with the present world average value of [3].
The gluon mass correction factors are calculated by integrating the differential distributions of gluon and photon energies of the decay processes or over the kinematically allowed regions of their respective Dalitz plots. For it is convenient to use the photon spectrum given by integrating Eqn.(4.1) over the gluon energies [39]:
| (7.5) | |||||
where:
For the decays a two dimensional integration is performed over the distribution [39]:
| (7.6) | |||||
The allowed phase space region is:
| (7.7) | |||||
| (7.8) | |||||
| (7.9) | |||||
| (7.10) | |||||
| (7.11) | |||||
| (7.12) |
The allowed regions of the Dalitz plots for decays (open contour) and (cross-hatched contour) for GeV are shown in Fig.8a. Similar contours for the corresponding decays and GeV, are shown in Fig.8b. The phase space suppression factors due to gluon mass effects are the ratios of the areas inside the contours to the area above the dotted line, corresponding to . It is seen that the phase space suppression is considerable for and very large for decays.
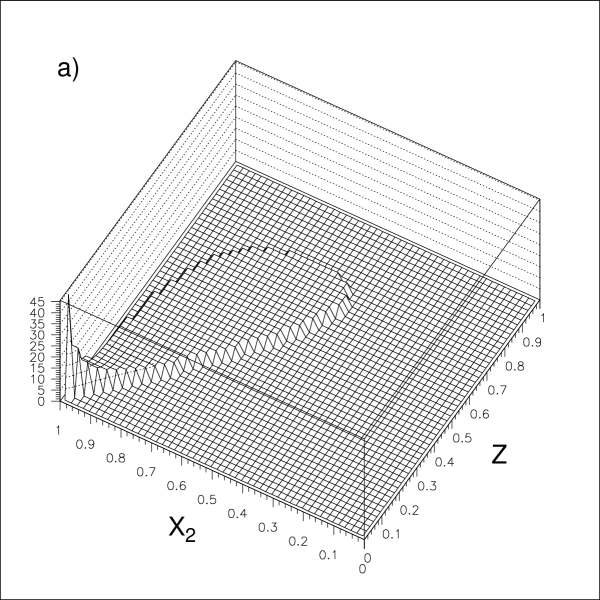
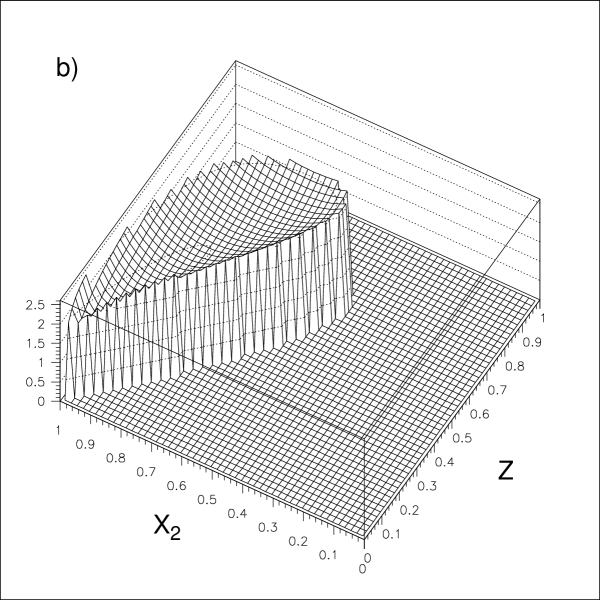
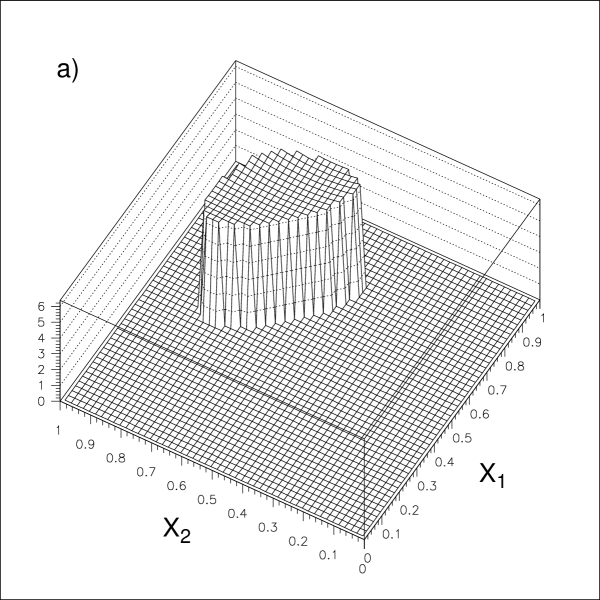
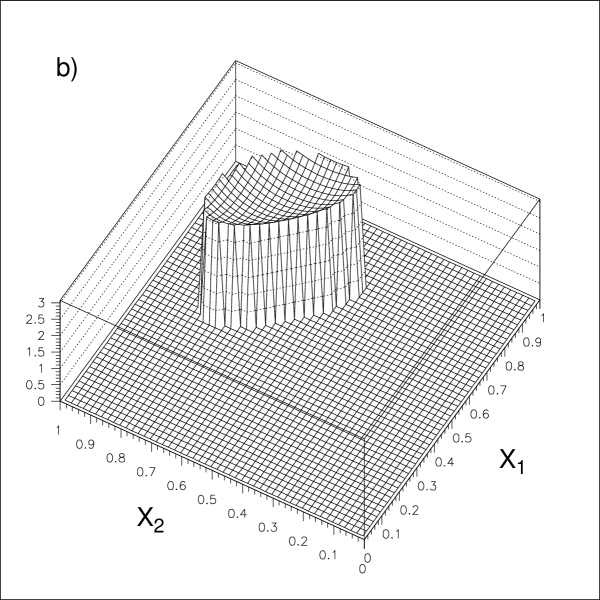
The effect of the inclusion of longitudinal polarisation states for the gluons is illustrated in Figs. 9 and 10, which show decay rates as a function of photon and gluon energies as given by Eqn.(4.1) ( ) and Eqn.(7.6) (), respectively, for GeV. In Fig.9a,10a the longitudinal gluon contributions are suppressed by setting except in the equations defining the Dalitz plot boundary, i.e. only the phase space limitations due to the non-vanishing value of are taken into account. In Fig.9b and 10b the complete formulae (4.1) and (7.6), respectively, are used. The most dramatic effect of the longitudinal contributions is a strong suppression of the decay rate for in the region , . As the experimental data analysed here has , this has no practical consequences for the present work. Indeed, in the region of small , the dominant mechanism of direct photon production is expected to be the fragmentation of light hadrons into photons [38], [48], which is not taken into account in the NLO QCD calculation of Reference [14]. As can be seen in Figs.9b,10b the other effect of the longitudinal contributions is a modest suppression of the decay rate, near the centre of the allowed region of the Dalitz plot, relative to the boundaries. The gluon mass correction factors given by integrating Eqn.(7.5) over or Eqn.(7.6) over and , are presented in Table 11. The rows labelled ‘LW’ use the complete formulae, those labelled ‘Phase Space’ have except in the equations defining the kinematic limits. It can be seen that that longitudinal gluon effects are negligible in the correction factors for decays for both the and the . For decays these effects increase by 30 and 8, respectively, for the and the . The errors quoted on the correction factors are derived from the total errors on given in Sections 5 and 6 above.
The values of and derived from Eqns.(7.2) and (7.3), taking into account gluon mass effects according to the values of given in Table 11 are presented in Table 12 (phase space corrections only) and Table 13 (full gluon mass corrections). In each case the values for 0.6, 1.0 and 2.0 are presented as well as those given by neglecting the corrections in Eqns.(7.2) and (7.3). For all choices of renormalisation scale, the agreement with the world average values is improved as compared to the values presented in Table 10, where gluon mass effects are neglected. The best agreement (at the 0.3-1.5 level) is found for 2.0, though almost equally consistent results (deviations of 1.2-1.7) are found when the corrections are neglected. The inclusion of longitudinal gluon effects, in the latter case, increases the value of by 30 and by 9. These shifts are comparable to the uncertainties on due to the experimental errors on and the gluon mass correction factors. Similar shifts are found for 2.0 and somewhat smaller ones for 1.0. The values of and given by using the full gluon mass correction with 1.0 are compared, in Fig.7, with the world average value of , and the values obtained for the same renormalisation scale, but without gluon mass corrections.
Comparison of Tables 12 and 13 with Table 10 and inspection of Fig.7 shows that that the inclusion of effective gluon corrections are essential in order to obtain values of and , derived from measurements of , that are consistent with the current world average determination of .
Each of the published experiments extracted a value of from the measured values of . In all cases, good consistency was found with other available measurements of . This is due to the relatively large errors, at the time, both on the individual measurements and on the average value of the other measurements with which they were compared. It does not at all contradict the results shown in Table 10, which show instead a poor consistency of values derived from the weighted average value of of the three latest experiments with the current world average value of . The experiments CUSB, ARGUS, Crystal Ball and CLEO all used the Brodsky-Lepage-Mackenzie (BLM) scale setting procedure [49] to determine at a scale of , i.e. 1.5 GeV. These results, together with their weighted mean, are presented in Table 14. The mean value of of differs from the current world average value of by 4.8 standard deviations, and is consistent with the results for given in Table 10. The CLEO2 experiment used the Principle of Minimal Sensitivity (PMS) [50] to determine:
where the first error is statistical, the second systematic, and the third due to the estimated uncertainty of the PMS scale setting procedure. Evolving to the scale GeV using Eqn.(7.4) gives
This differs from the current world average value cited above by only 1.3, but also agrees within 0.19-1.1 with the values quoted in Table 10. The latter, however, differ from the world average by 3.0-5.7. The results of the present analysis, and the combined average of those already published in the literature are thus in agreement, and lie 3 or more below the world average. No consistent description is obtained unless the effective gluon mass effects are taken into account.
8 Discussion
The inclusive photon spectrum for decays (dashed curve) and decays (solid curve) obtained from the fits performed here to all available experimental data are shown in Fig.11. In both cases, the relativistic corrections and the Photiadis HO QCD correction are included. The values 0.721 GeV and 1.18 GeV of found in Sections 5 and 6 above, are used for the and respectively. It is clearly seen that the end-point suppression is much more severe for the than the . Also shown in Fig.11 is the RDF spectrum, which has been found to describe well all the measurements of the photon spectrum in except that of CUSB. It is seen to be in good qualitative agreement with the fit curve, but to predict a much harder spectrum than the fit curve for the . In fact, the RDF model, where the gluon mass is perturbatively generated using a low cut-off value of 0.45 GeV, predicts that the spectra are very similar in shape for the and the . This is clearly not the case.
The very different shapes of the spectra for the and the can only be understood if the scale introduced into the kinematics of the process by the effective gluon mass is not small in comparison with the mass of the . This condition is very well satisfied, since the rest mass of the two effective gluons of GeV is 47 of the mass. As previously discussed in MCJHF1 and MCJHF2, the stronger suppression of the end point in decays can be understood as a propagator effect acting on off-shell gluons if the genuine gluon mass is GeV, i.e. larger than the fitted value of for the , and similar to that found for the . Corroborative evidence for this picture is provided by the structure of the hadronic final state. The dominance, for massive gluons, of the process over gluon splitting leads to a similar hadronic final state in radiative decays, to the annihilation process at the same energy [13] [16], consistent with the experimental observations.
The huge difference observed in the shape of the and spectra in Fig.11 is clearly at variance with the principle of Local Parton Hadron Duality (LPHD) where parton level pQCD calculations are used (as in the RDF model) down to scales of a few hundred MeV [52]. Indeed, in Monte Carlo models that give a good detailed description of hadronisation effects [53] [54] the cut-off scale of perturbative QCD effects is in the range 1-2 GeV, comparable to the effective gluon mass in decays, and much larger than . This point will be further discussed below.
Some remarks are now made on the related work presented in MCJHF1 and MCJHF2. In this case fits were performed only to the MARKII data for the , and to those of ARGUS and Crystal Ball for the . In the fit to the , only phase space gluon mass corrections were included, with no HO QCD or relativistic corrections. The fits used phase space gluon mass corrections and the Photiadis HO QCD correction, but no relativistic correction. The values obtained for of 777There is a misprint in MCJHF1, propagated also to MCJHF2, where this error is wrongly quoted as 0.08 GeV and GeV, respectively, are similar to those GeV, GeV, found in the present paper. The larger errors quoted here result from a study of theoretical systematics (relativistic corrections, different HO QCD corrections) not done in MCJHF1 and MCJHF2. Due to a programming error, the resolution functions used in these papers had a width that was too large by a factor . This had the effect of destroying the sensitivity of the high part of the spectrum to the process . A fit with an acceptable Confidence Level was then obtained without explictly taking into account this decay channel as described in Section 5 above. An important difference between the present work and MCJHF2 is an improved understanding of the effect of relativistic corrections. As is clear from the discussion at the beginning of Section 2 above, the ‘binding energy’ introduced by KM must be a positive definite quantity. The same conclusion can be reached from simple physical reasoning. In the presence of the relativistic correction the heavy quark-antiquark annihilation process occurs over a finite spatial region around the origin of the radial wave function, instead of at the origin as in the static limit. As the ground state wave function peaks at the origin, relativistic corrections must always reduce the decay rate, not increase it. In MCJHF2, following the NRQCD [18] approach, the corresponding parameter was taken to be free, to be determined from experiment, and was allowed to take positive or negative values. In the present paper the relativistic correction parameter is set to the fixed values 0.28 and 0.09, respectively, for the and on the basis of potential model calculations. Finally, the NLO QCD correction to the inclusive photon spectrum [14] was not available when MCJHF2 was written.
The analysis presented in this paper has neglected possible Colour Octet contributions to the radiative decay rates. These have been calculated for decays at NLO in the NRQCD formalism by Maltoni and Petrelli [55]. In the region of interest for the fits performed in the present paper, , the corrections to the LO spectrum were found to be modest, . In a more recent study [56] in which octet operators were resummed to yield the so-called shape functions [57] a much larger contribution was predicted in the near end-point region. However, comparison with the CLEO2 data showed that the colour octet contribution, with normalisation fixed by the velocity counting rules of NRQCD, exceeds the experimental data by between one and two orders of magnitude. It may also be remarked that the result of the shape function calculation, in which clusters of ‘non-perturbative’ soft gluons are summed, is expected to be drastically affected (reduced) if the phase space suppression associated with a gluon mass of GeV is taken into account. In view of the small correction to the shape of the spectrum due even to the full colour singlet NLO correction [14] as compared to that resulting from gluon mass effects (see Figs.3-6), the neglect of possible colour octet contributions is not expected to modify, in any essential way, the conclusions of this paper. In fact, according to Reference [56] the colour octet contributions are expected to strongly enhance the rate in the end-point region, whereas what is observed is actually a strong suppression. Indeed, both colour octet and colour singlet NLO QCD corrections should be redone, taking into account gluon mass effects. Phase space restrictions are expected, in this case, to significantly reduce the NLO corrections to both colour singlet and colour octet contributions, especially for decays.
The values of the effective gluon mass determined, in the present paper, from radiative and decays are now compared with the results of other studies in the literature of gluon mass effects. A number of representative estimates of the gluon mass are presented in Table 15. In the following the generic symbol will be used for the genuine gluon mass, reserving the symbol for the ‘effective mass’ in the sense described in Section 4 above, determined at tree level in the radiative decays of heavy quarkonia to light hadrons.
| Author | Reference | Estimation Method | Gluon Mass |
| Parisi, Petronzio | [12] | 800 MeV | |
| Cornwall | [8] | Various | 500 200 MeV |
| Donnachie, Landshoff | [59] | Pomeron parameters | 687-985 MeV |
| Hancock, Ross | [61] | Pomeron slope | 800 MeV |
| Nikolaev et al. | [62] | Pomeron parameters | 750 MeV |
| Spiridonov, Chetyrkin | [63] | , | 750 MeV |
| Lavelle | [64] | , | 640 MeV |
| Kogan, Kovner | [67] | QCD vacuum energy, | 1.46 GeV |
| Field | [68] | pQCD at low scales (various) | 1.5 GeV |
| Liu, Wetzel | [39] | , | 570 MeV |
| Glue ball current, | 470 MeV | ||
| Ynduráin | [66] | QCD potential | 10-10-20 MeV |
| Leinweber et al. | [69] | Lattice Gauge | 1.02 0.10 GeV |
| Field | This paper | 0.721 GeV | |
| 1.18 GeV |
Pioneering work in this field was done by PP [12]. An estimate of MeV for the gluon mass was made from the observed softening of the end-point of the inclusive photon spectrum in radiative decays. The work presented in this paper is, in essence, a more refined version of the analysis of PP, taking into account experimental resolution effects, and the including decays as well as the best current knowledge on relativistic and HO QCD corrections.
The first extended theoretical discussion of gluon mass effects within QCD was made by Cornwall [8]. Estimates were made of the possible value of a dynamically generated gluon mass by several different methods: phenomenological glueball regularisation, considerations based on the gluon condensate, the glueball spectrum and lattice gauge calculations. In fact, many of the gluon mass estimates shown in Table 15 are based on the use of the gluon condensate:
| (8.1) |
introduced by Shiftman, Vainstein and Zakharov (SVZ) [58]. Here is the gluon field tensor. The gluon mass is related to the inverse of the correlation length, , of the gluonic vacuum fields. In Reference [58] the phenomenological determination of by the use of QCD Sum Rules is described.
Donnachie and Landshoff [59], identified the Pomeron trajectory, used to describe diffractive scattering, with the QCD two gluon exchange process [60]. They modified the perturbative gluon propagator in the long distance region by introducing a finite correlation length. The value of the latter was derived from phenomenological Pomeron exchange parameters. In Table 15 the reciprocal of the correlation length is equated to the gluon mass. Other studies of the sensitivity of the Pomeron parameters to non-perturbative modifications of the gluon propagator were made by Hancock and Ross [61] and Nickolaev et al. [62]. Again, an effective gluon mass of about 800 MeV was found.
Spiridonov and Chetyrkin [63] estimated the gluon mass by calculating power corrections to the polarisation tensor of the electromagnetic current of light quarks, and identifying them with the gluon condensate term in the Operator Product Expansion (OPE) for this quantity derived by SVZ. The calculation was later repeated by Liu and Wetzel [39], who obtained a very similar, though not identical, result (see below).
Lavelle [64], by considering a long-distance modification of the gluon propagator in the amplitude for quark-quark scattering, established a relation between a running, dynamically generated, gluon mass and the gluon condensate of SVZ. It was emphasised by Lavelle that the derived formula, based on the OPE is only valid in the deep Euclidean region. Even so, in a recent paper Mihara and Natale (MN) [65] applied the running gluon mass formula of Lavelle to decays of the and to ggg of gg where the gluons are either on shell or have time-like virtualities. MN concluded that the average effective gluon mass should be smaller for than for decays, at variance with the results of the fits presented in the present paper. The correction factors due to gluon mass effects: were calculated for the and and found to be 0.47 0.30 and 0.94 0.03 respectively, to be compared with the values found here (see Table 11) of 0.18+0.08-0.02 and 0.61+0.16-0.06. The smaller gluon mass corrections found by MN are unable to explain the large differences in the values of determined from and the the world average value of (see Table 10 and Fig.7).
The gluon mass estimates presented in Table 15 are, with one exception, in the range from a few hundred MeV to about 1.5 GeV. The exception is the paper of Ynduráin [66] which claims that experimental upper bounds in the range from 20 MeV to 10-10 MeV may be set. These limits are based on considerations of the quantum mechanical potential between a quark and an anti-quark. This is assumed to be Coulombic for short distances () where is the QCD scale parameter, linear ( ) for and, finally, for , to exhibit a Yukawa form: . The linear portion of the potential gives rise to a barrier of height . Ynduráin argues that may be identified with the highest energy at which unsuccessful searches for liberated quarks have been performed. For example, GeV leads to the limit:
Other limits are given by applying similar arguments to the absence of proton decay into free quarks ( MeV), and the non-observation of free quarks on cosmological scales ( MeV). The arguments leading to these limits are clearly untenable because of the neglect of the Quantum Field Theory (QFT) aspects of the problem888Interestingly enough, Ynduráin mentions, near the end of his paper, the screening of the potential by quark pair production, but does not draw the conclusion that the existence of such effects invalidate his limits on derived from a pure quantum mechanical potential. In the real world it is impossible to deconfine a quark since the production of low mass pairs (mesons) is always energetically favoured.. In fact, when a colour field is stretched between a quark and an anti-quark, the number of colour charges is not conserved. The vacuum energy materialises as quark-antiquark pairs, which form bound states of light mesons ( , ,…) This mechanism, as implemented in the JETSET Monte Carlo Program [53] is found to give a good description of the observed hadron multiplicity in , where the final state is just a colour singlet pair of the type discussed by Ynduráin. This neglect of the QFT aspects of the problem renders it unecessary to discuss further the contradiction between Ynduráin’s upper limits and the other gluon mass estimates in Table 15. It is interesting to note, however, that the paper of Ynduráin is the only one cited on the subject of experimental limits on the gluon mass in the current Review of Particle Properties [3].
The estimations of the gluon mass based on the phenomenologically determined value of the gluon condensate [58] cited in Table 15 are, with one exception, in the range from 500-700 MeV. As discussed above, such a value for the gluon mass could not explain the much stronger suppression of the end point of the inclusive photon spectrum in decays, as compared to decays. The exception, that is much more consistent with the gluon mass value suggested by the radiative decays, is the calculation of Kogan and Kovner [67]. This uses an analytical approach in which the vacuum energy of a gauge-invariant QCD wave functional is minimised. It leads to the relation, for a pure SU(3) Yang-Mills theory999i.e. effects of quark fields are neglected:
| (8.2) |
Substituting the value of of 0.038 GeV4 from Reference [58] gives GeV. This value is quite consistent with the effective gluon masses derived earlier [15, 16] and confirmed in the present study. It also agrees well with a previous, independent, estimate of the present author, based on a pQCD analysis of several processes with low physical scales [68], and a recent Lattice Gauge estimate [69].
An effective gluon mass has also been introduced in the context of the estimation of power-corrections to various hard QCD processes [70]. This was already briefly discussed in MCJHF2. The leading correction to the mean thrust in annihilation into hadrons, for example, is found to be . The gluon mass appears as an intermediate parameter in these calculations, but no explicit values are quoted, and to date, no comparisons have been made with other estimates of the effective gluon mass, e.g. lattice calculations. Power corrections are an example of ‘higher twist’ effects in the language of the OPE formalism. In fact, it was pointed out in Reference [58] that, as a consequence of the dimensionality of the relevant operators, physical systems described by an OPE (as in the case of QCD Sum Rules) are expected to have a leading power correction . A OPE description, as used in QCD Sum Rules, is not appropriate to describe higher twist effects in the quarkonium radiative decay spectrum discussed in the present paper. As can be seen by inspection of Eqns.(7.5) and (7.6) the leading higher twist effects are where .
The gluon mass estimate labelled ‘pQCD at low scales’ in Table 15, is based on phenomenological arguments (similar to those used later in Reference [67]), proposed in Reference [71] and further developed in References [68, 72, 73]. In this approach, effective gluon and quark masses are related to the QCD parameter, that plays the role of an infra-red cut-off of the theory.
It is interesting to note that the approach just mentioned, which relates the parameter of pQCD to effective quark and gluon masses, is complementary to the SVZ approach of describing the perturbative/non-perturbative interface in terms of QCD Sum Rules. In this context it is interesting to consider the relation between , and [63]:
| (8.3) |
The value MeV quoted in Table 15, was obtained by setting GeV in Eqn(8.3), but the equation is expected to be valid for any value of in the perturbative region. Substituting the values GeV, and GeV, which reproduce well the measured value of [68], into Eqn(8.3) gives, for the gluon condensate, (GeV)4, which may be compared with the average value derived by Narison [75] of (GeV)4. Liu and Wetzel [39] derived a formula identical to Eqn(8.3) except that the term 23/2 is replaced by 10. With the same parameters as quoted above, the value (GeV)4 is obtained. In view of the factor of two difference between the original SVZ estimation of the numerical value of , as compared to that of Narison, the overall consistency of the value of derived from the QCD Sum Rule approach, and the pQCD phenomenology of Reference [68], is very satisfactory.
Thus, although gluon mass effects are only directly observable in processes with pure gluonic parton-level final states, such as the radiative heavy quarkonia decays analysed in detail in this paper, the existence of a gluon mass of order one GeV is already implicit in all pQCD analyses that use, as an infra-red cut-off, the conventional parameter. It is important to stress, however, that as previously pointed out [73, 74], the scale at which pQCD is expected to break down is gluon mass GeV, not , which is typically a factor of five smaller. It is interesting to note that the same conclusion has recently been reached in a study of the five-loop QCD -function, using Padé-approximant methods [51]. From this point-of-view the success of pQCD, in association with the LPHD hypothesis, in describing observed particle multiplicity distributions, as well as their energy dependence, using cut-off scales as low as 270 or even 150 MeV [52], seems somewhat mysterious and may be accidental. As previously mentioned, Monte-Carlo generators that actually simulate in detail both the partonic and hadronic phases of the space-time evolution of the final state use infra-red cut-off parameters of about 1-2 GeV, of the same order as the observed gluon mass.
Since the main effect of the inclusion of a phenomenological gluon mass on the QCD predictions is phase spaee suppression, it is clear that the associated mass must be time-like: . This behaviour is also consistent with an analytical parameterisation of the lattice results of Reference [69]. Another recent lattice study using a Coulomb gauge gluon propagator [76] has suggested rather a pure imaginary pole mass: MeV. This work is related to the suggestion of Gribov [77] that colour confinement is due to a long range Coulomb force. In this model physical (transverse) gluons disappear form the physical spectrum in the infra-red region. This would appear to be at variance with the essential role of massive, time-like, and dominantly transverse, physical gluons in the description of inclusive photon spectra that is demonstrated in the present paper. Actually, renormalisability remains to be proved for the Coulomb gauge and, as pointed out by the authors of Reference [76], except possibly in a confined phase, in quantum field theory the square of a particle mass identified with the pole of a propagator must be real and positive. The author’s opinion is that pure quantum field theory studies of the type carried out by Gribov and Zwanziger [78] are no better adapted than the quantum mechanical potential model of Ynduráin [66], discussed above, to understand the physical mechanism of confinement. This appears to occur via a transition beween partonic and hadronic phases of matter, after which colour charges are all confined within hadrons, which are mostly bound states of quarks. Clearly quenched lattice calulations of the type done in Reference [76] are unable to describe such a mechanism.
It has recently been pointed out that the introduction of a term containing a tachyonic gluon mass with GeV2 in the OPE of QCD Sum Rules is able to explain some long standing puzzles in the related phenomenology [79]. This approach was justified by evidence from lattice gauge calculations for non-perturbative contributions leading to a linearly increasing term in the static QCD potential at short distances [80]. The connection of this gluon mass parameter, which gives an economical description, within the QCD Sum Rule formalism, of a non perturbative short distance effect with the time-like effective mass discussed in the present paper (and all references cited in Table 15), is unclear. This latter mass describes rather the long distance behaviour of the gluon propagator. It is quite possible that both the time-like and tachyonic gluon masses may be appropriate and consistent phenomenological parameters within their different domains of applicablity.
9 Summary and Outlook
In this paper a phenomenological QCD analysis has been performed using all available data on the inclusive photon spectrum in the decays of the (Mark II Collaboration) and the (CUSB, ARGUS, Crystal Ball and CLEO2 Collaborations). The fits performed to the shape of the spectra included, for the first time, the combined contributions of relativistic corrections, NLO pQCD corrections, and corrections due to the non-vanishing gluon mass. For the relativistic correction, fixed values of of 0.28, and 0.09 were assumed for the and repectively, in accordance with recent potential model calculations. Both the new, complete, NLO pQCD calculation by Krämer [14] of the photon spectrum and the old resummed calculation of Photiadis [17] (applicable only in the end-point region ) were used in the fits. Gluon mass effects were estimated using the complete tree-level calculation of of Liu and Wetzel [39].
For neither the nor the was any consistent description of the experimental data possible in the absence of gluon mass corrections. In this case, for the Mark II data, no fit was obtained with a confidence level greater than 10-30 (Table 5). For the , acceptable confidence levels of 0.17 and 0.13 were found for some fits to the Crystal Ball and CLEO2 data, but not for ARGUS where the best confidence level obtained was (Table 7). However the best confidence level for the combined fit to these three experiments was only .
Including gluon mass corrections yielded confidence levels of greater than 1 for all the fit hypotheses tried (see Tables 6 and 8) and values of the effective gluon mass, , of:
The first errors quoted are experimental, and correspond to the 68 error contour of the fit, while the second errors are theoretical, reflecting the spread in the best fit values of resulting from different treatments of relativistic and HO pQCD corrections. It is clear from the fit results shown in Tables 6 and 8 that the shape of the photon spectrum for both the and the is completely dominated by gluon mass effects. Introducing the relativistic correction leaves the fitted values of almost unchanged, while the shifts produced by different HO pQCD corrections are less than, or comparable to, the fit errors. The gluon mass corrections are due essentially to phase space restrictions. Including or excluding contributions from longitudinal gluon polarisation states changes the fitted values of by only .
It can be seen, from the theoretical photon spectra calculated including the effects given by the experimentally determined values of (Fig. 11), that the suppresssion of the end point of the spectrum is much stronger in the case of the , than that of the . This is in contradiction with the prediction of the QCD parton shower model of R.D.Field [34] that agrees well with the measured spectrum, but predicts, for the , a much harder spectrum than that actually observed. Such a strong suppression of the end-point, in comparison with that of the is only possible if the gluon mass is 1 GeV. All these conclusions are in agreement with those of two earlier, closely related, papers [15, 16], in which it was conjectured, following the work of Parisi and Petronzio [12], that gluon mass corrections must be much more important than either relativistic of HO pQCD corrections in determining the shapes of the inclusive photon spectra.
The QCD coupling constants and were determined from the experimental measurements of the branching ratio (Eqn. 7.1) for the and respectively. Use of has the advantage of being insensitive to relativistic correction effects. As shown in Fig. 7, even allowing for a variation of the renormalisation scale in the range from to , poor agreement (deviations of for the , respectively) is found with the current world average value of . Using the measured values to calculate the gluon mass correction factors in the theoretical expressions for (Eqns. (7.2) and (7.3)) leads to values of that are consistent, albeit within much larger errors, (due mainly to the large theoretical error on ), with the expected value of (see Fig. 7).
The results obtained in this paper for the effective gluon mass in radiative and decays are compared, in Table 15, with some other estimates of the gluon mass that have appeared in the literature over the last 20 years. Apart from the upper limits of Ynduráin [66], that have been critically discussed in the previous Section of this paper, all the estimates lie in the range from 500 MeV to 1.5 GeV. The values of obtained here favour somewhat higher values of the genuine gluon masss of 1 GeV. In particular, there is good agreement with the estimates of Kogan and Kovner [67], (minimisation of the energy of a pure Yang-Mills QCD wave functional), a previous estimate of the present author, using a pQCD analysis of several processes with low physical scales, and the recent Lattice Gauge estimate of Leinweber et al. [69] with improved lattice sampling in the far infra-red region. It is also mentioned in the previous Section that the conventional value for the phenomenological scale parameter of pQCD of several hundred MeV actually implies a gluon mass some five times larger. Since for scales less than , is actually a (calculable) scale dependent parameter [71], there is no Landau pole in QCD at the scale , but rather a break-down of pQCD at a much larger infra-red cut-off scale GeV.
A model of confinement in which a purely imaginary gluon mass is introduced [76] predicts the decoupling of physical gluon states at low physical scales. Such behaviour would seem to be inconsistent with the radiative decay data which can only be described by the contribution, in the same infra-red region, of physical gluons with a time-like effective mass.
A contribution in the OPE of QCD Sum Rules corresponding to a tachyonic gluon mass was recently proposed [79] to describe some short distance properties of the QCD potential suggested by lattice studies [80]. This work has no obvious connection with the present one where it is shown instead that a gluon with a time-like effective mass apparently plays an important role in the long-distance region.
Since the theoretical uncertainties on the values of the effective gluon mass, , determined here are much larger than the experimental ones ( the former are (), () as compared to (), () for the latter) the most urgent need is for improved theory predictions rather than more precise experimental data101010 It is interesting to note that the effective gluon mass is determined with a much better relative precision for the than for the . This is a consequence of the larger size of the gluon mass corrections for the resulting in a greater sensitivity to .. As a first step, NLO pQCD calculations should be repeated including gluon mass effects, as has been done at tree level by Parisi and Petronzio and Liu and Wetzel. Of even more interest may be the calculation of:
via the exchange of two massive virtual gluons (actually a NNLO process) to test the conjectured dominance of this process as already indicated by the structure of the hadronic final state.
As was already evident from previously presented results [16], the usefulness of the NRQCD approach of Reference [18] will be very limited unless some means is found of incorporating the numerically very important gluon mass effects within the formalism. Another important problem that this approach must address is the possible double counting of pQCD and relativistic corrections [73].
Finally it should not be forgotten that the most dramatic effects discussed in this paper (in the process ) are based on the results of a single experiment [13] performed more than 20 years ago now. It is clearly important that this remarkable experimental result, strongly suggesting that the gluon mass is GeV should be confirmed. In a world where half dozen or so b-factories (or their equivalents) exist, or are under construction, it is high time that the charm-quark energy region be revisited with modern general-purpose detectors and much higher integrated luminosity than that which yielded the data from the Mark II collaboration that has been analysed in this paper111111It seems, at the time of writing, that there is now a very good chance that this will soon be done [82]. In view of the less than perfect consistency of the different measurements of , an improved measurement of this process, with at least an order of magnitude greater statistics, and reduced systematic errors, would be of great interest. This is perhaps possible at existing b-factories.
Acknowledgements
I specially thank M.Consoli for a collaboration that is at the inception of the work described in this paper. I thank S.Catani, M.Krämer, M.Mangano and D.Ross for their interesting critical comments. Finally, I am indebted to D.Duchesneau for a careful reading of the manuscript, and a discussion that helped to improve the clarity of the presentation.
Appendix
In the previously published analysis of the and inclusive photon spectra [16], resolution effects were simulated by smearing the theoretical distributions with a gaussian random number. In order to obtain stable fit results, an unsmeared histogram with a very large number of entries was necessary, and the random number throwing had to be repeated at each fit iteration, which was both time consuming and resulted in different statistical errors in the fitted function at each iteration. Even with events in the histogram, the determination of the exact position of the minimum was quite difficult. To avoid these problems, a new, purely analytical smearing technique was used for the fits presented in this paper. The method was faster and eliminated all problems related to the statistical errors inherent in Monte Carlo methods.
A theoretical histogram of the inclusive photon spectrum, with bin index , , is generated with a fine binning, typically . The corresponding resolution smeared histogram with bin index , , is the generated according to the following algorithm:
where
and
Here is the central value of the scaled photon energy in bin and is the photon energy resolution at energy . Values of for the different experiments analysed here are reported in Table 2. In this way, a gaussian resolution smearing of the photon energy by up to around the true value is performed. Precise results were obtained by normalising the unsmeared histogram to a million events:
but, unlike in the case of a Monte-Carlo simulation, the execution time of the program does not depend on this number. The bins of the smeared histogram are grouped to correspond to those of the experimental histogram before fitting [81]. In all the fits the relative normalisation of the experimental and the smeared theoretical histogram was allowed to float.
References
- [1] H.Frizsch, M.Gell Mann and H.Leutwyler, Phys. Lett. 47B, 365 (1973).
- [2] S.Weinberg, Phys. Rev. Lett. 31, 494 (1973).
- [3] Review of Particle Properties, D.E.Groom et al., Eur. Phys. J C15, 1 (2000).
- [4] C.H.Lewellyn Smith, Phys. Lett. 46B, 233 (1973).
- [5] J.M.Cornwall, D.N.Levin and G.Tiktopoulos, Phys. Rev. Lett. 30, 1268 (1973).
-
[6]
J.C.Pati and A.Salam, Phys. Rev. D8, 1240 (1973);
D10, 275 (1974);
R.N.Mohapatra, J.C.Pati and A.Salam, Phys. Rev. D13, 1733 (1976);
A. de Rujula, R.C.Giles and R.L.Jaffe, Phys. Rev. D17, 285 (1973); D22, 227 (1980);
T.Goldman and G.L.Shaw, Phys. Rev. Lett. 47, 887 (1981);
E.W.Kolb, G.Steigman and M.S.Turner, Phys. Rev. Lett. 47, 1357 (1981);
G.Rajasekaran and S.D.Rindani, Phys. Lett. 99B, 361 (1981); Prog. Theor. Phys. 67, 1505 (1982);
A. Yu. Ignatiev et al., Theor. Math. Phys. 47, 373 (1981). - [7] J.M.Cornwall, Nucl. Phys. B157, 392 (1979).
- [8] J.M.Cornwall, Phys. Rev. D26, 1453 (1982).
- [9] G.Curci and R.Ferrari, Il Nuovo Cimento 32A, 151 (1976).
- [10] G.Curci and E. d’Emilio, Phys. Lett. 83B, 199 (1979).
- [11] J.R.Forshaw, J.Papavassiliou and C.Parrinello, Phys. Rev. D59, 074008 (1999).
- [12] G.Parisi and R.Petronzio, Phys. Lett. 94B, 51 (1980).
- [13] MARK II Collaboration, D. L. Scharre et al., Phys. Rev. D23, 43 (1981).
- [14] M.Krämer, Phys. Rev. D60, 11503 (1999).
- [15] M.Consoli and J.H.Field, Phys. Rev. D49, 1293 (1994).
- [16] M. Consoli and J.H.Field, J. Phys. G 23, 41 (1997).
- [17] D.M.Photiadis, Phys. Lett.164B, 160 (1985).
- [18] G.T.Bodwin, E.Braaten and G.P.Lepage, Phys. Rev. D51,
- [19] R.van Royen and V.F.Weisskopf, Nuovo Cimento 50, 617 (1967).
- [20] H.Bergström, H.Snellman and G.Tengstrand, Phys. Lett. 82B, 419 (1979).
- [21] W.Y.Keung and I.J.Muzinich, Phys. Rev. D27, 1518 (1983).
- [22] H.A.Bethe and E.E.Salpeter, Phys. Rev. 82 , 309 (1951); 84 , 1232 (1951).
- [23] G.A.Schuler, Quarkonium Production and Decays, CERN-TH.7170/94, February 1994.
- [24] See for example, C.T.H.Davies et al., Phys. Rev. D50, 6963 (1994); D52, 6519 (1995).
- [25] H.C.Chiang, J.Hüfner and H.J.Pirner, Phys. Lett. 324B, 482 (1994).
- [26] K-T.Chao, H-W.Huang and Y-Q.Liu, Phys. Rev. D53, 221 (1996).
- [27] G.A.Schuler, Proceedings of the UIC Quarkonium Physics Workshop, Chicago Il, USA, 13-15 Jun 1996. Editors: H.Goldberg, T.Imbo and W.Y.Keung. Int. J. Mod. Phys. A12, 22 (3951-3963) (1997).
- [28] M.Beyer et al., Zeit. Phys. C55, 307 (1992).
- [29] A.Bradley, Phys.Lett.77B, 422 (1978).
- [30] E.Eichten et al., Phys. Rev. D21, 203 (1980).
- [31] H.Bergström, H.Snellman and G.Tengstrand, Phys. Lett.80B, 242 (1979).
- [32] H.Bergström, H.Snellman and G.Tengstrand, Zeit. Phys. C4, 215 (1980).
- [33] A.Ore and J.L.Powell, Phys. Rev. 75 , 1696 (1949).
- [34] R.D.Field, Phys. Lett. 133B,248(1983).
- [35] Ya.I.Azimov et al., Phys.Lett. 165B, 147 (1985).
- [36] B.I.Ermolayev and V.S.Fadin, JETP Lett. 33, 285 (1981), A.H.Mueller, Phys. Lett. 104B, 161 (1981).
- [37] A.E.Chudakov, IZv. Akad. Nauk SSSR Sec Fiz. 19, 650 (1955).
- [38] F.Hautmann in Proceedings of PHOTON ’97, Egmond an Zee The Netherlands, 10-15 May 1997. Editors A.Buijs and F.C.Erné, World Scientific Singapore 1998, P68.
- [39] J-p.Liu and W.Wetzel Gluon-mass effects in quarkonia decays, annihilation and the scalar glueball current, University of Heidelberg pre-print HD-THEP-96-47, hep-ph/9611250.
- [40] L.Köpke and N.Wermes, Phys. Rep. 174, 67 (1989).
- [41] R.D.Schamberger et al., Phys. Lett. 138B, 225 (1984).
- [42] CLEO Collaboration, A.Bean et al., Phys. Rev. Lett. 56, 1222 (1986).
- [43] ARGUS Collaboration, H.Albrecht et al., Phys. Lett. 199B, 291 (1987).
- [44] Crystal Ball Collaboration, A.Bizzeti et al., Phys. Lett. 267B, 286 (1991).
- [45] CLEO II collaboration, B.Nemati et al., Phys. Rev. D55, 5273 (1999). This publication did not present an acceptance corrected spectrum. The spectrum used here was taken from Contributed paper 274 to the XVI International Symposium on Lepton and Photon Interactions, Ithaca NY August 1993 and F.Muheim, private communication.
- [46] W.Kwong et al., Phys. Rev. D37, 3210 (1988).
- [47] Review of Particle Properties, C.Caso et al., Eur. Phys. J C3, 1 (1998).
- [48] S.Catani and F.Hautmann, Nucl. Phys. B (Proc. Suppl.) 39BC, 359 (1995).
- [49] S.J.Brodsky, G.P.Lepage and P.B.Mackenzie, Phys. Rev. D28, 228 (1983).
- [50] P.M.Stevenson, Phys. Rev. D23, 2916 (1981), S.Sanghera, Int. J. Mod. Phys. A9 5743 (1994).
- [51] F.A.Chishtie, V.Elias and T.G.Steele, Phys. Lett. 514B, 279 (2001)
- [52] See, for example, V.A.Khoze, S.Lupia and W.Ochs, Eur. Phys. J C5, 77 (1998).
- [53] T.Sjöstrand, Comp. Phys. Comm. 82 74 (1994).
- [54] G.Marchesini et al., Comp. Phys. Comm. 67 465 (1992).
- [55] F.Maltoni and A.Petrelli, Phys. Rev. D59, 074006 (1999).
- [56] S.Wolf, Phys. Rev. D63, 074020 (2001).
-
[57]
I.Z.Rothstein and M.B.Wise, Phys. Lett. 402B, 346 (1997);
M.Beneke, I.Z.Rothstein and M.B.Wise, Phys. Lett. 408B, 373 (1997);
M.Beneke, G.A.Schuler and S.Wolf, Phys. Rev. D62, 034004 (2000). - [58] M.A.Shiftman, A.I.Vainstein and V.I.Zakharov, Nucl. Phys. B147, 385 (1979); B147, 448 (1979).
- [59] A.Donnachie and P.V.Landshoff, Nucl. Phys. B311, 509 (1989)
-
[60]
F.E.Low, Phys. Rev. D12,
163 (1975);
S.Nussinov, Phys. Rev. Lett. 34, 1286 (1975);
L.V.Gribov, E.M.Levin and M.G.Ryskin, Phys. Rep. 100 1 (1983). - [61] R.E.Hancock and D.A.Ross, Nucl. Phys. B394, 200 (1993), See also J.R.Forshaw and D.A.Ross, Quantum Chromodynamics and the Pomeron, Cambridge University Press, 1997, P131.
- [62] M.N.Nickolaev, B.G.Zakharov and V.R.Zoller, Phys. Lett.328, 486 (1994).
- [63] V.P.Spiridonov and K.G.Chetrykin, Sov. J. Nucl. Phys. 47, 522 (1988), Yad Fiz 47 818 (1988).
- [64] M.Lavelle, Phys. Rev. D44, R26 (1991).
- [65] A.Mihara and A.A.Natale, Phys. Lett. 482B, 378 (2000).
- [66] F.J.Ynduráin, Phys. Lett. 345B, 524 (1995).
- [67] I.I.Kogan and A.Kovner, Phys. Rev. D52, 3719 (1995).
- [68] J.H.Field, Int. J. Mod. Phys. A9 3283 (1994).
- [69] D.B.Leinweber et al., Phys. Rev. D60, 094507 (1999).
-
[70]
Yu.L.Dokshitzer and B.R.Webber, Phys. Lett. 352B,
451 (1995);
Yu.L.Dokshitzer G.Marchesini and B.R.Webber, Nucl. Phys. B469, 93 (1996). - [71] J.H.Field, Ann. Phys. (N.Y.), 226, 209 (1993).
- [72] J.H.Field, Mod. Phys. Lett. A11, 2921 (1996); E A12, 217 (1997).
- [73] J.H.Field, Nucl. Phys. B (Proc. Suppl.) 54A, 247 (1997).
- [74] J.R.Cudell, A.Donnachie and P.V.Landshoff, Nucl. Phys. B322, 51 (1989).
- [75] S.Narison, Phys. Lett. 387B, 162 (1996).
- [76] A.Cucchieri and D.Zwanziger, Phys. Lett. 524B, 123 (2002).
- [77] V.N.Gribov, Nucl. Phys. B39, 1 (1978).
- [78] D.Zwanziger, Nucl. Phys. B518, 237 (1998).
- [79] K.G.Chetrykin, S.Narison, and V.I. Zakharov, Nucl. Phys. B550, 353 (1999).
- [80] G.S.Bali, Phys. Lett. 460B, 170 (1999).
- [81] The Function Minimisation and Error Analysis program MINUIT was used. See CERN Program Library Long Write-Up D506, March 1994.
-
[82]
H.Stöck, The CLEO-c Project - A New Frontier of QCD Physics
Talk presented at the XXXVIIth Recontres de Moriond: - QCD and High Energy Hadronic Interactions, Les Arcs, France, March 2002; hep-ex/02040125.