NUMI-L-713
hep-ph/0101090
Matter enhanced signals using various Fermilab main injector beam configurations
Lawrence Wai and Bradley Patterson
Stanford University
January 17, 2001
1 Introduction
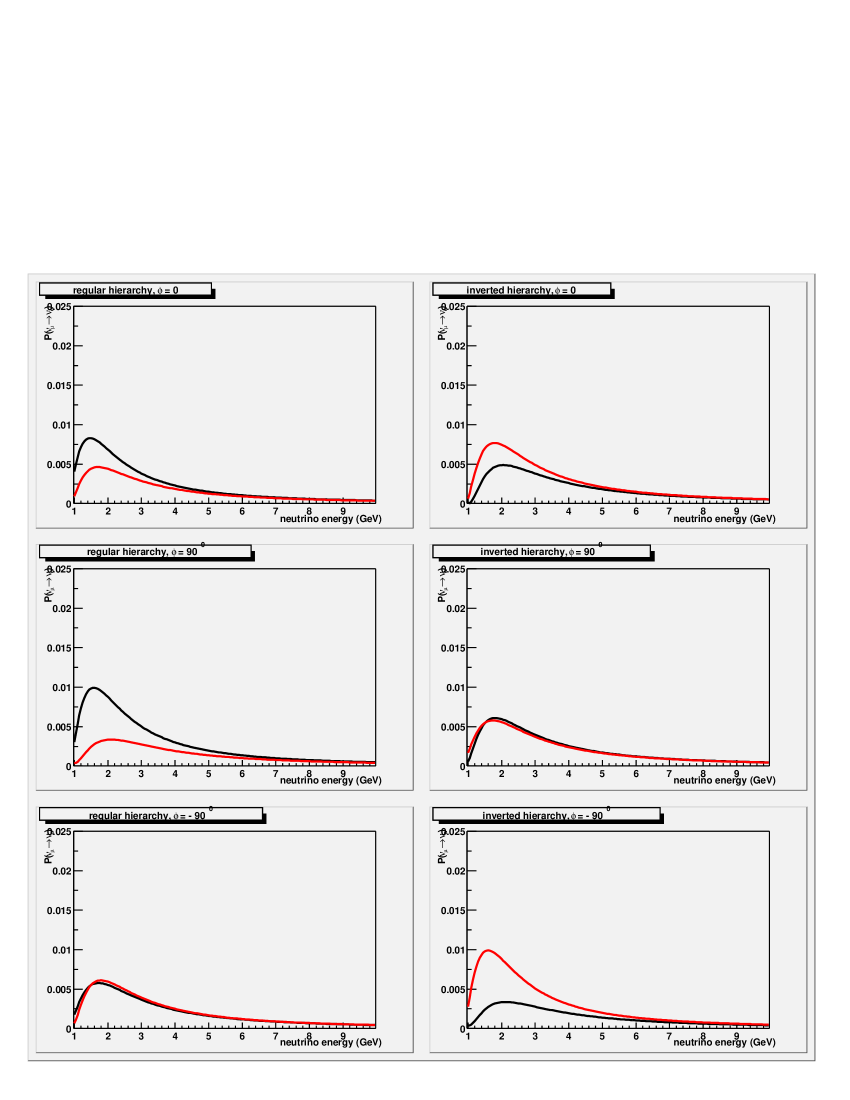
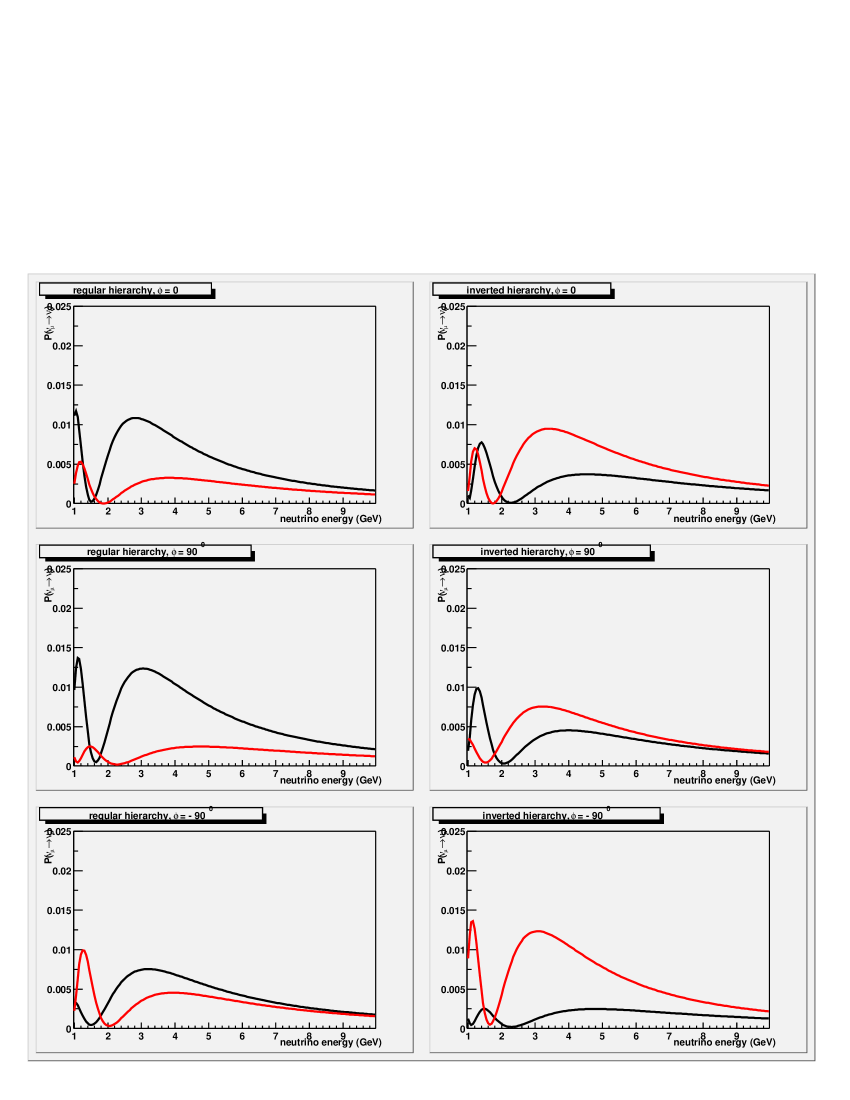
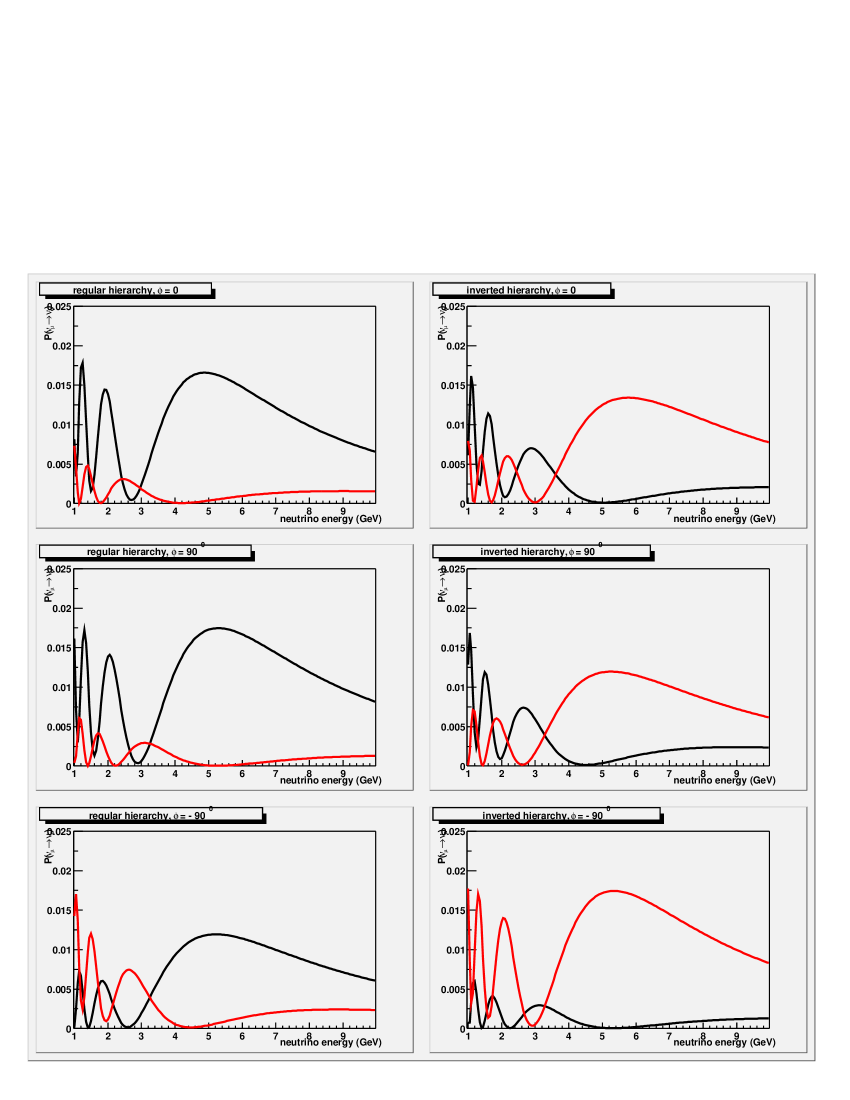
In this report we estimate the sensitivity of experiments optimized for measuring and the sign of in various Fermilab main injector beam configurations. We calculate the sensitivity to appearance making the assumption of 3 neutrino generations, and that only solar and atmospheric neutrino oscillations signals are ”real.” We have implemented an exact calculation of oscillation probabilities in matter from Barger et.al. [1] for the FNAL-Soudan (732km), and hypothetical FNAL-BNL (1500km) and FNAL-SLAC (2900km) beamlines, as shown in figures 1, 2, and 3. Of course, these appearance probabilities must be folded into the neutrino flux spectrum produced by a particular Fermilab main injector neutrino beam configuration, as well as the cross-section in the far detector. For the neutrino flux spectrum we have used the GEANT simulation of the NuMI beamline [2], and for the neutrino cross-section we have used the Soudan 2 [3] event generator. For the purposes of illustration, we shall use the test point (regular hierarchy), (ie. ), , , , and phase . Using these parameters, the numbers of charged current interactions per kiloton-year (in steel) are as follows:
| Event rates for steel exposure | |||
|---|---|---|---|
| regular hierarchy, , | |||
| FNAL-Soudan | FNAL-BNL | FNAL-SLAC | |
| PH2 low CC | 0.93 / kt-yr | 0.55 / kt-yr | 0.23 / kt-yr |
| PH2 medium CC | 1.41 / kt-yr | 1.15 / kt-yr | 0.79 / kt-yr |
| PH2 high CC | 0.98 / kt-yr | 0.95 / kt-yr | 0.87 / kt-yr |
Note that the peak energy values for the PH2 low, medium, and high energy beams are roughly 3, 6, and 12 GeV respectively. In this report we will consider two examples of detectors: a 10-kt “MINOS-like” detector, and a 10-kt “OPERA-like” detector optimized for appearance. We define “MINOS-like detector” in this report to be a 10-kt detector composed of alternating 2.54cm Fe plates and scintillator strips. We define the “OPERA-like” detector as follows.
In an earlier note, we have described how a hybrid emulsion detector (HED) can obtain low background measurements of and oscillation events in the NuMI beam [6]. We now consider a HED designed exclusively to measure . The tracking requirements for appearance are more stringent than those for appearance, and thus we can significantly relax certain parameters of a HED optimized for [5] if we only care about identifying . The main difference is that we propose to use 5 mm Fe instead of 1 mm Pb as in OPERA [9]. Thus, for roughly the same emulsion cost as in OPERA (a 2-kt detector) we obtain a detector with 3.5 times greater mass.
The detector would be composed of 10 cm thick steel-emulsion stacks, separated by RPC planes. The RPC planes would be used for triggering and event location. Emulsion sheets would be sandwiched between 5 mm thick steel plates. If the planes have an area of 8x8 square meters, then the mass of one steel-emulsion target plane would be 50 tons. The entire detector would consist of 200 planes. Note that there is enough floor space behind the first two MINOS supermodules in the MINOS Soudan cavern for such a detector.
We now attempt to estimate how much a HED would cost. We use the cost of emulsion film from the OPERA proposal [9] (converted to US dollars). We estimate the cost of salary, wages, and institutional overhead to be the same fraction as in the MINOS TDR [4], ie 50% of total cost before contingency. We add a 50% contingency. This results in a total detector cost of roughly $18.4M per kt. The rough cost breakdown is shown in the following table:
| Cost breakdown for 10-kt HED | |||
|---|---|---|---|
| component | cost per unit | # units | total cost |
| emulsion film | $150 / | 256,000 | $38.4M |
| steel | $1000 / ton | 10,000 | $10.0M |
| RPC+electronics | $500 / | 25,600 | $12.8M |
| wages, salary, overhead | $61.2M | ||
| contingency | $61.2M | ||
| total | $183.6M | ||
We now turn to a comparison of MINOS-like and OPERA-like detector analyses.
2 MINOS-like data analysis
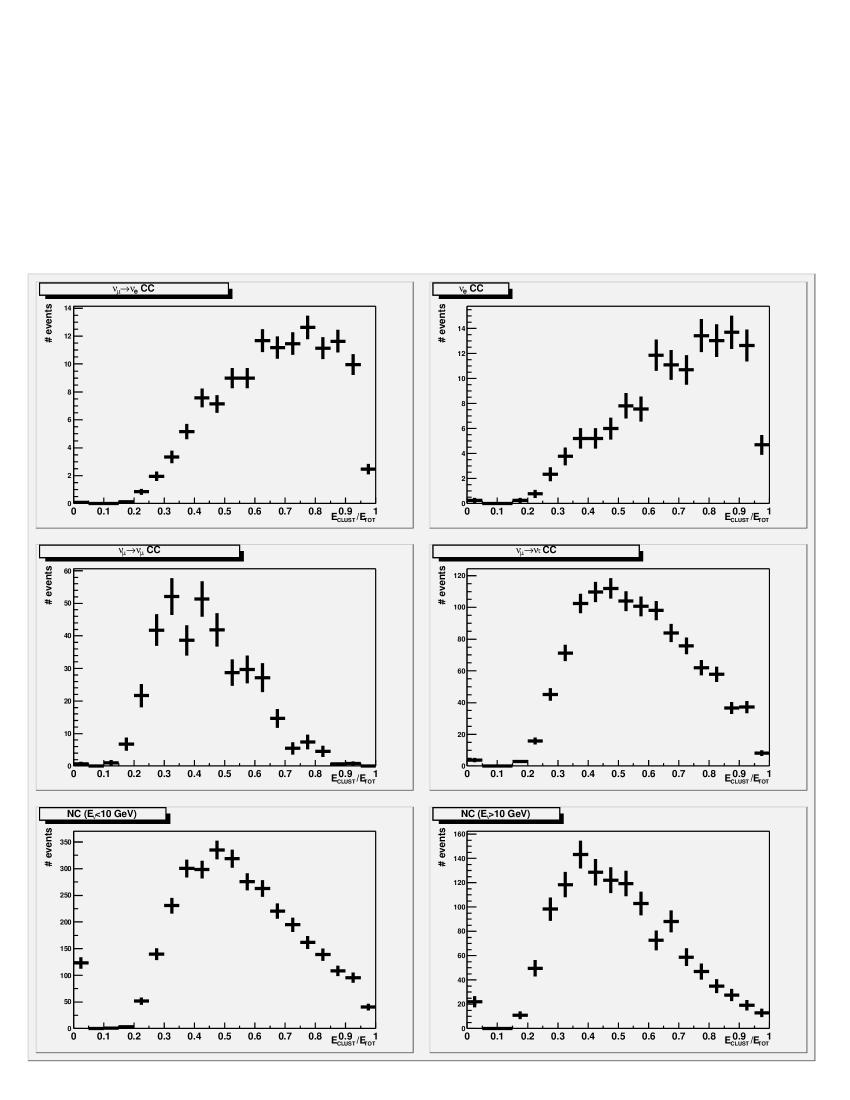
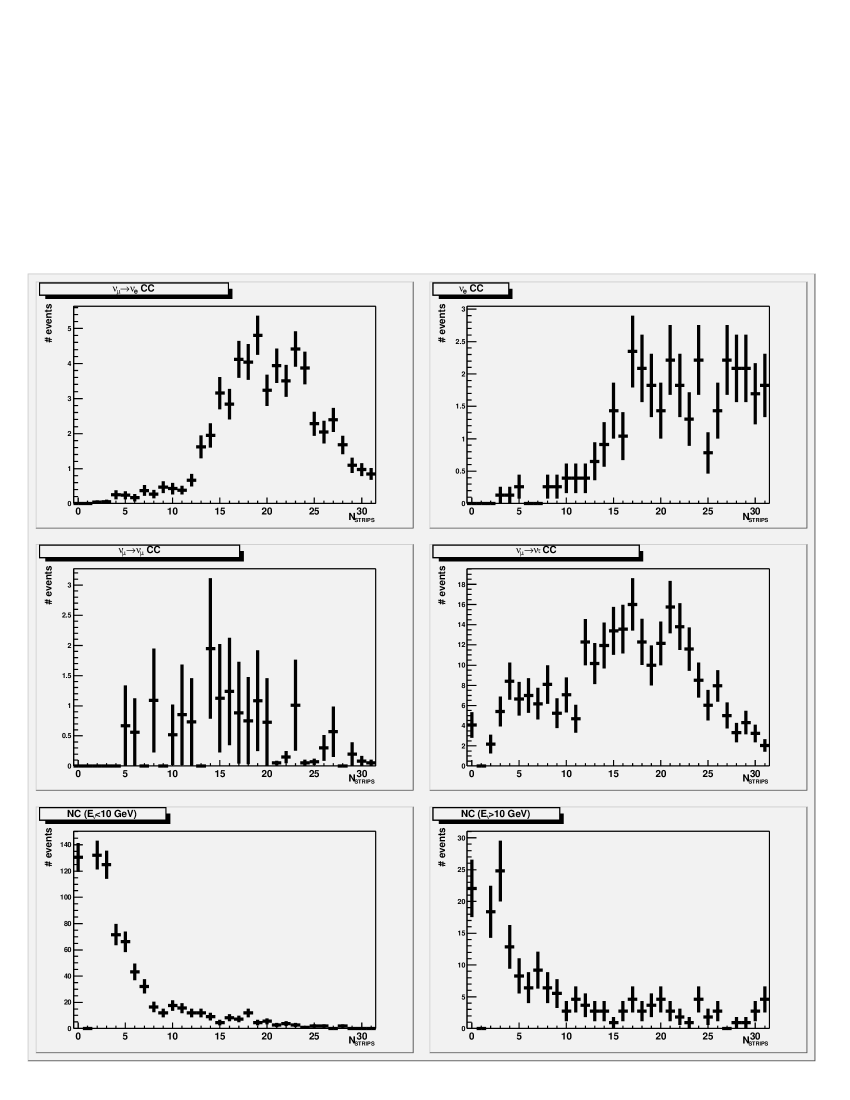
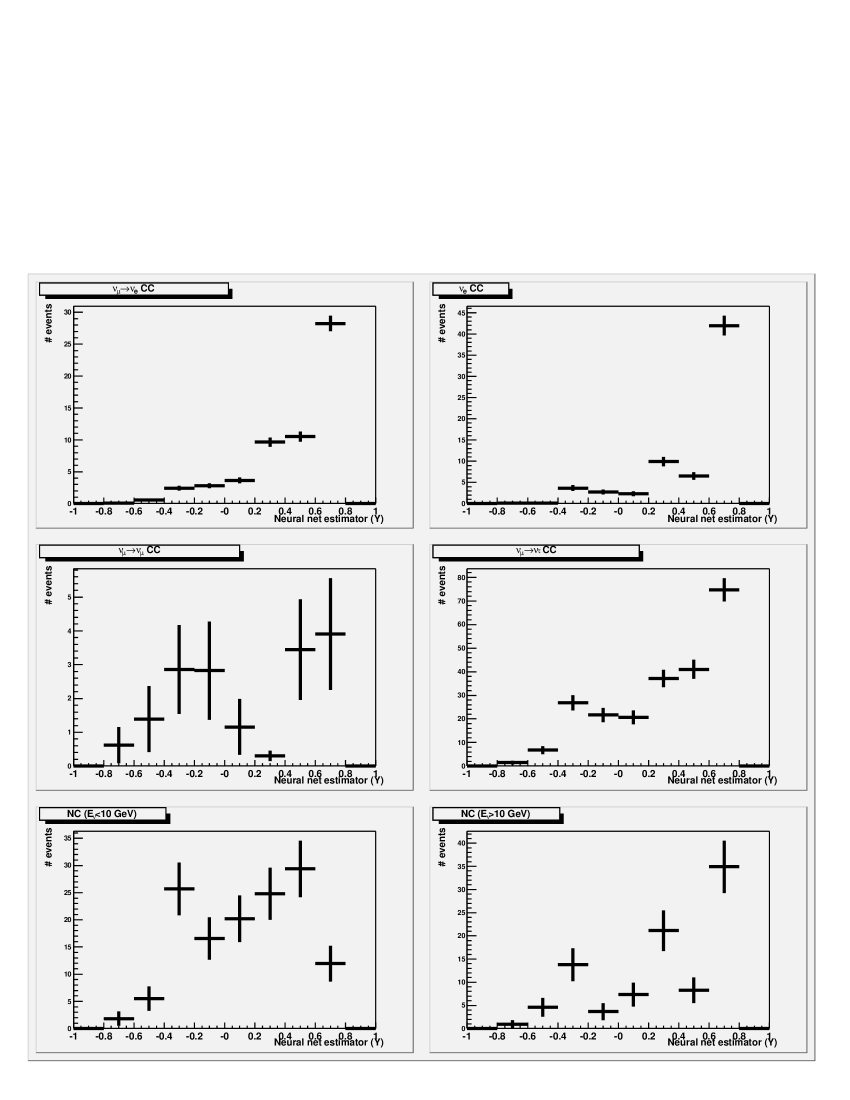
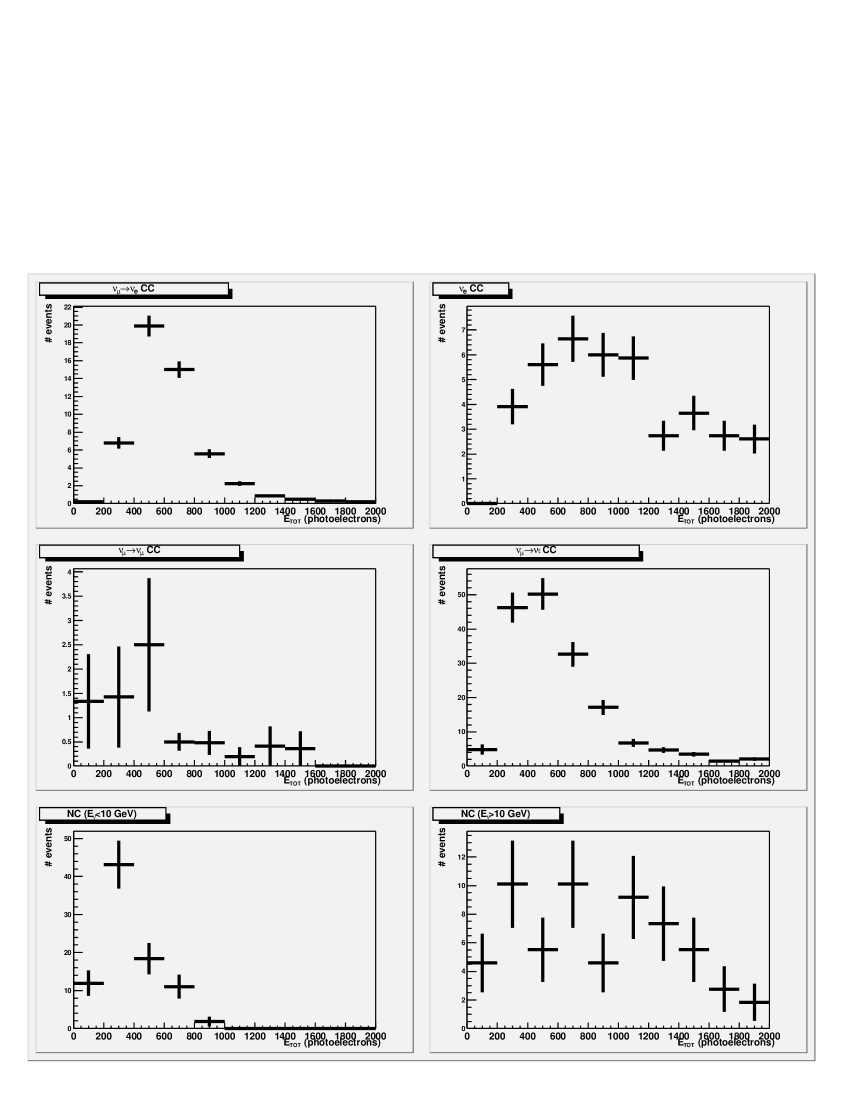
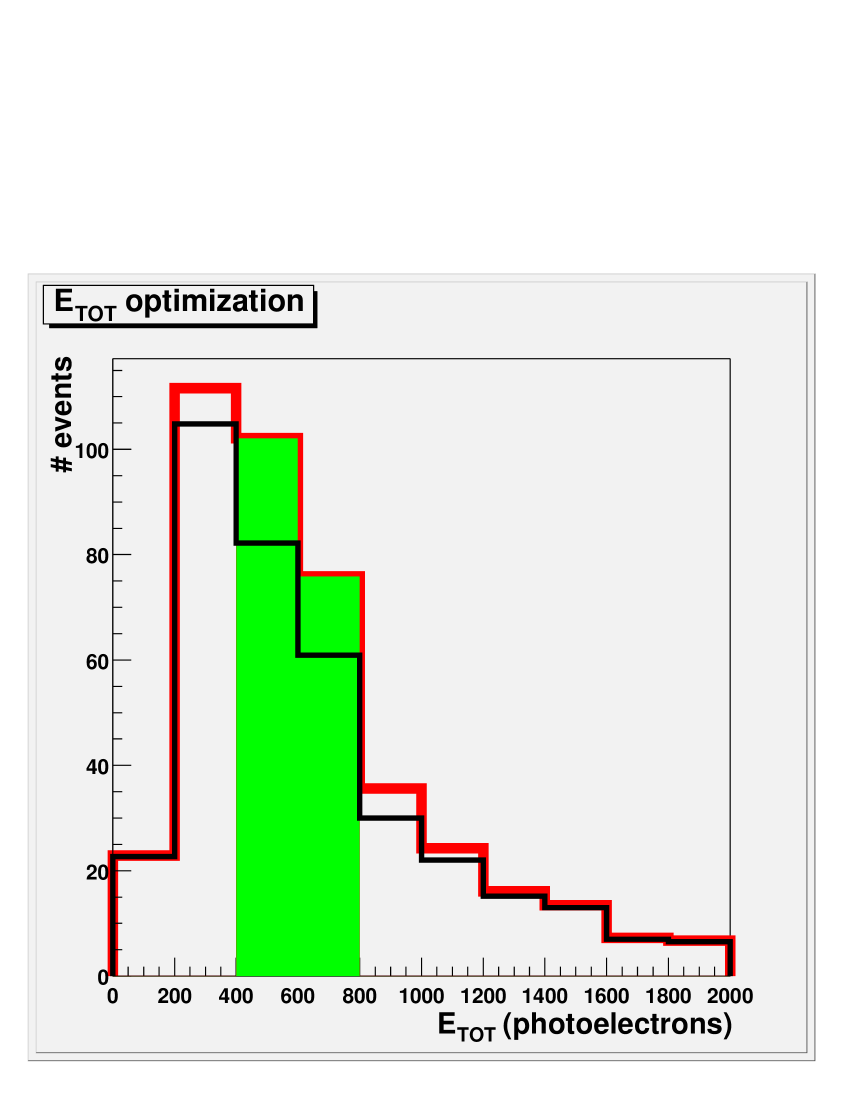
The MINOS-like detector analysis (taken from [7]) is based upon the full “official” GEANT simulation of the MINOS detector [8]. We use the case of PH2 medium to SLAC as an example. The basic strategy can be summarized as follows: 1) reject events with , 2) fraction of energy in the highest energy cluster (see figure 4), 3) number of strips in the highest energy cluster (see figure 5), 4) neural net estimator consistent with (see figure 6), and 5) reject events in which the total energy () does not fall within some energy range optimized to (see figures 7 and 8). The numbers of events after each sequential cut are tabulated in table 1.
3 HED data analysis
The HED data analysis [6] is based upon simple gaussian smearing of individual Monte Carlo particle truth information. Of course, the smearing is appropriate to the HED detector under consideration. The basis for the inputs to the smearing come from the OPERA proposal [9] (which has an =0.18 for each target plate), with the appropriate extrapolation to the thicker plates in the HED described in this report (=0.28). The resolution on electromagnetic showers from track counting in the OPERA proposal is 20%/sqrt(E), so we use a gaussian smearing of 25%/sqrt(E) for electrons and gammas in our calculation. The resolution on charged particle momentum using the multiple Coulomb scattering method in the OPERA proposal is 16%, so we use a gaussian smearing of 20% to (non-electron) charged particles in our calculation. We use a 1 milliradian angular resolution for charged particle direction (assuming that we use the emulsion film described in the OPERA proposal) and we add in quadrature the angular smearing due to multiple coulomb scattering in the target steel plate (using a randomly chosen scattering vertex position in the target plate).
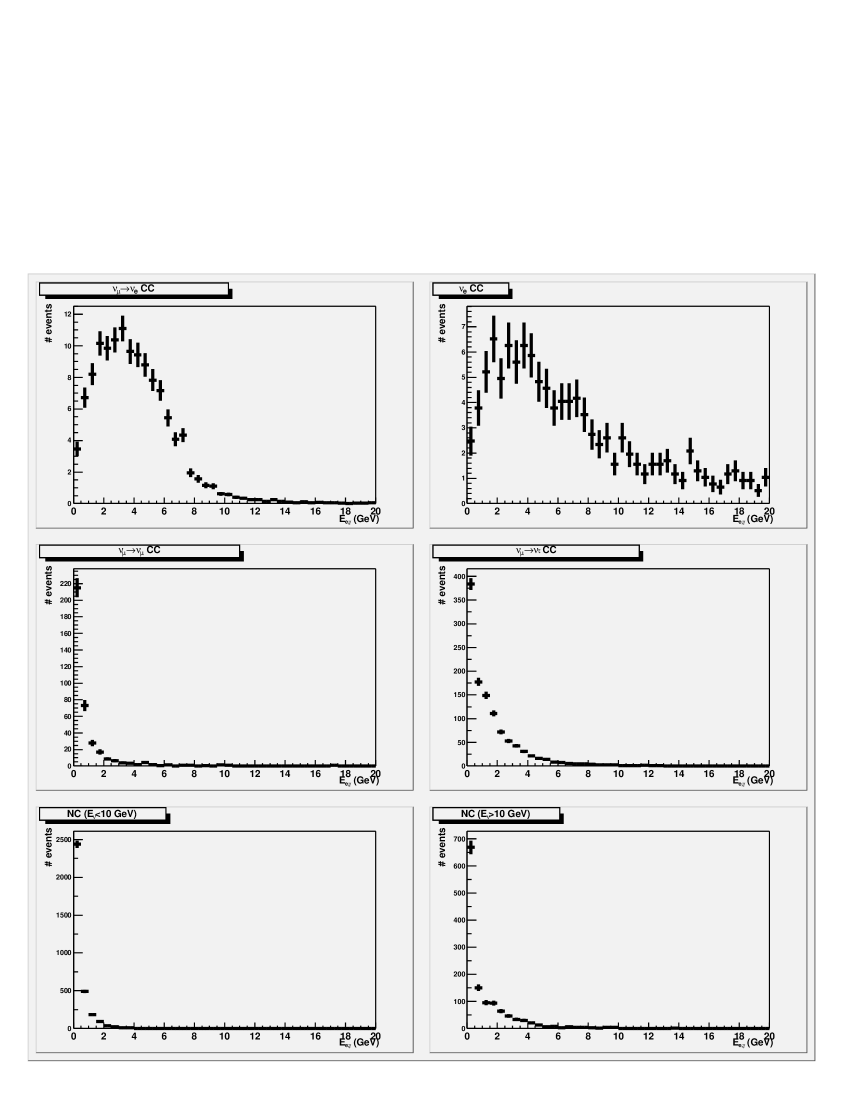
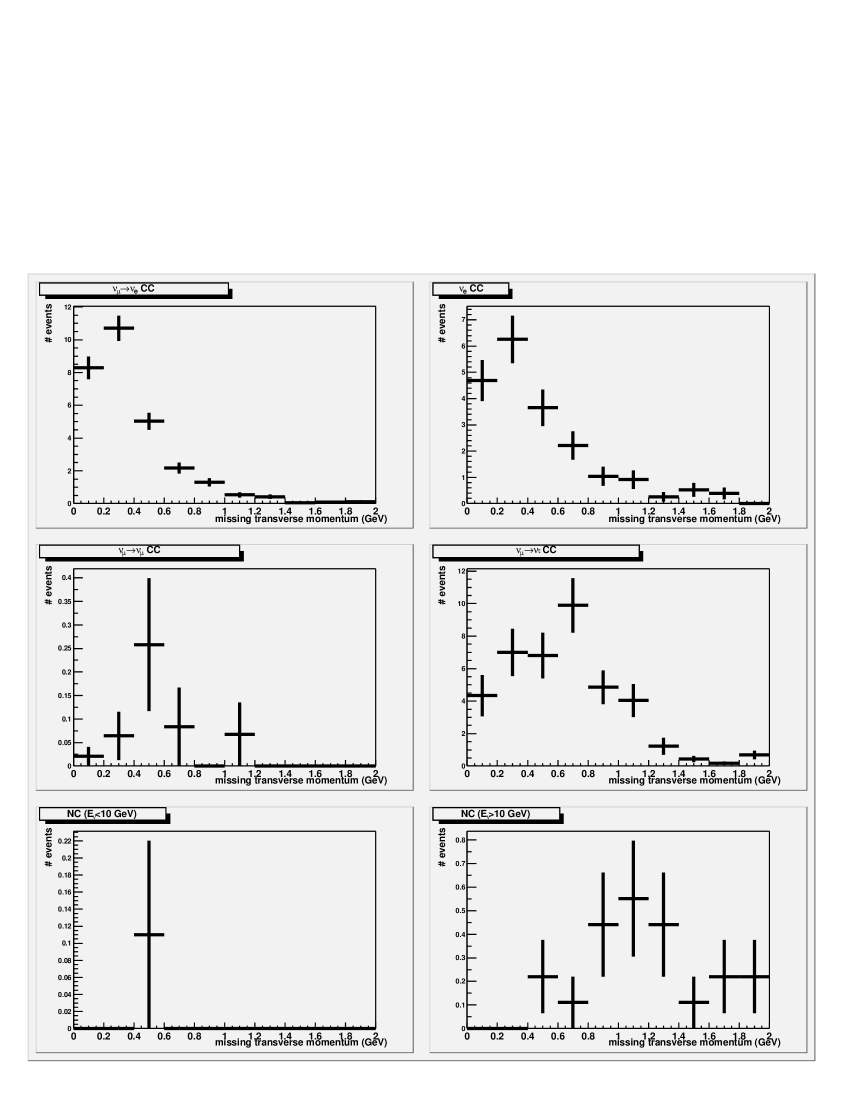
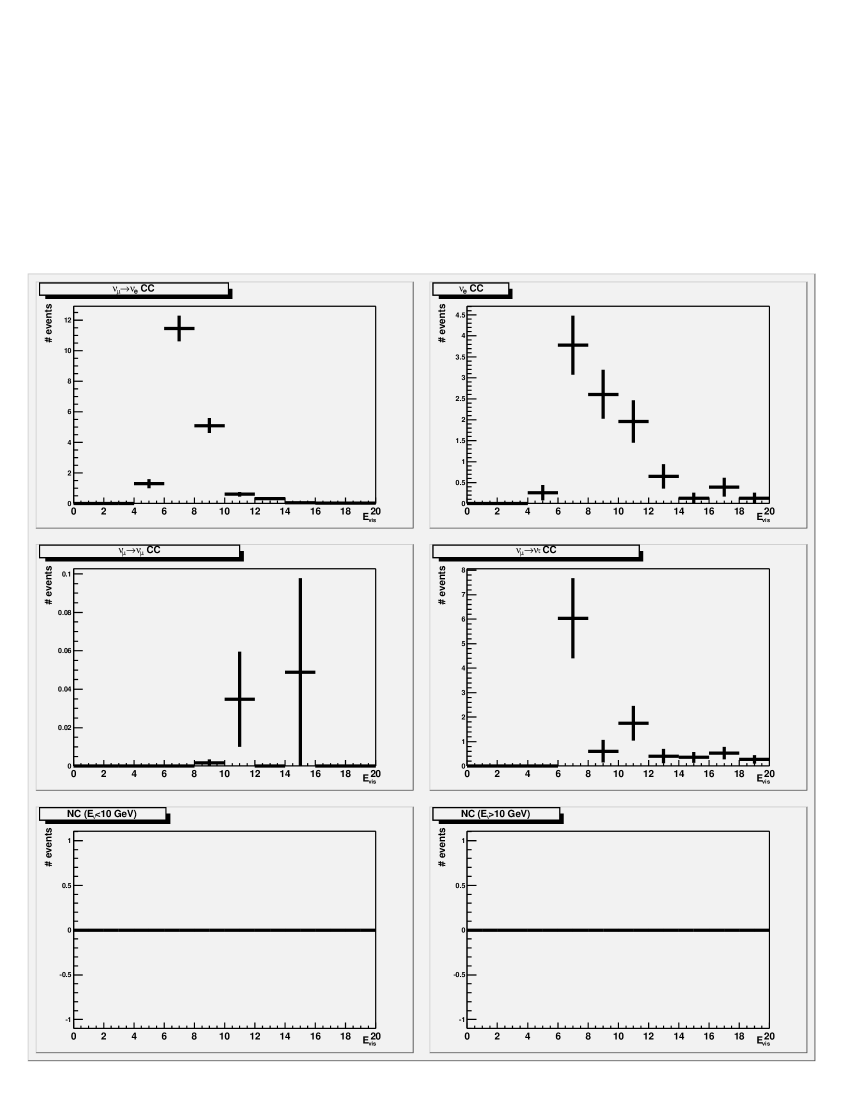
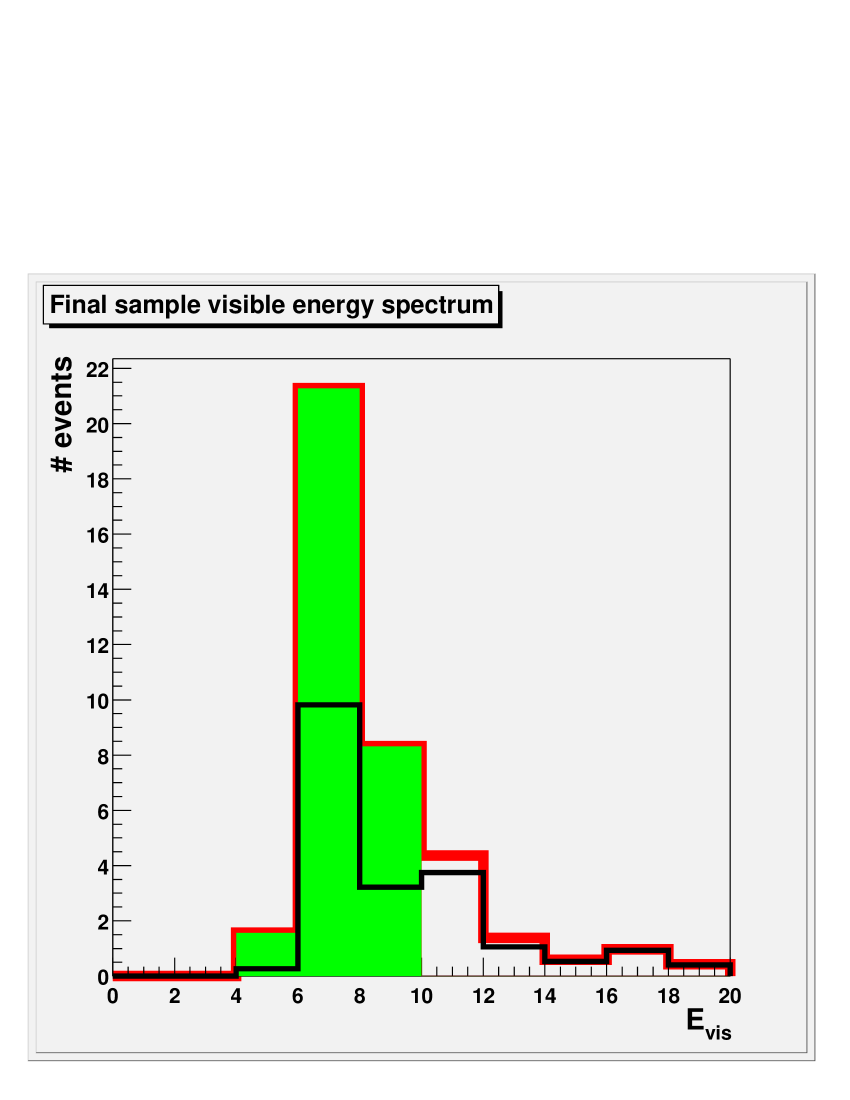
We use the case of PH2 medium to SLAC as an example. The data reduction can be summarized as follows: 1) reject events with , 2) require the highest energy electromagnetic shower (either from an electron or prompt gamma) to be greater than some optimized threshold (see figure 9), 3) reject prompt gammas which do not convert before passing through the first emulsion sheet after the primary interaction vertex (this rejects 88% of prompt gammas), 4) require missing transverse momentum111Note that in order to minimize the missing transverse momentum smearing due to multiple Coulomb scattering we only use charged particles with momentum greater than 400 MeV in the two independent transverse momentum sums. to be less than some optimized threshold (see figure 10), and 5) require the total visible energy to fall within an energy range optimized to (see figures 11 and 12). The numbers of events after each sequential cut are tabulated in table 2.
4 Results
We assume 40 kt-yr exposures of the detectors in Fermilab main injector beams whose fluxes have been upgraded by a factor of 4. We also assume that the systematic error is dominated by uncertainty in the number of background events, and that this error is 10%. With these assumptions, we may summarize the significance of the signal in units of and after all data reduction cuts in the following table:
| Significance of the signal after all cuts in units of () | ||||||
|---|---|---|---|---|---|---|
| regular hierarchy, , | ||||||
| MINOS-like detector | OPERA-like detector | |||||
| Soudan | BNL | SLAC | Soudan | BNL | SLAC | |
| PH2 low | 1.5 (0.8) | 2.3 (2.1) | 1.4 (2.2) | 2.6 (2.2) | 3.2 (4.3) | 2.0 (5.2) |
| PH2 medium | 1.1 (0.4) | 1.9 (1.3) | 3.1 (2.6) | 1.4 (1.3) | 2.5 (4.2) | 4.5 (10.0) |
| PH2 high | 0.4 (0.1) | 0.7 (0.4) | 1.7 (0.8) | 1.1 (0.8) | 1.9 (2.6) | 3.3 (7.5) |
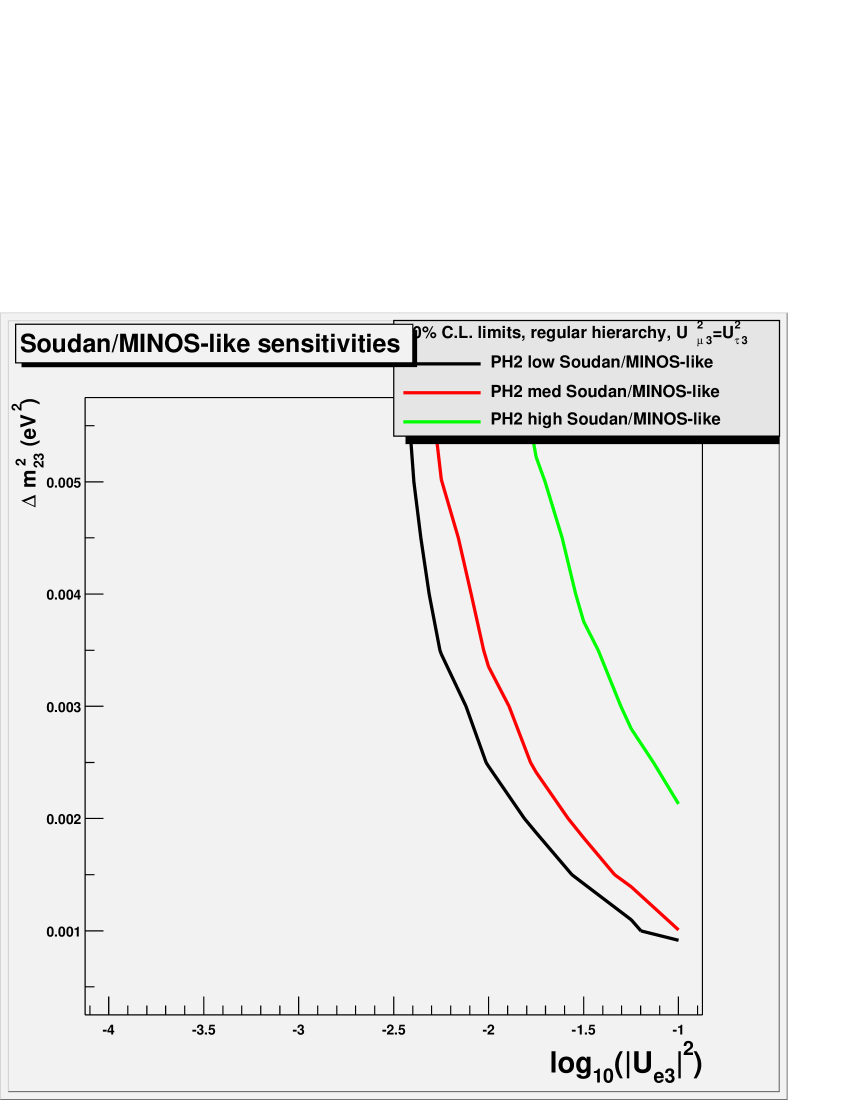
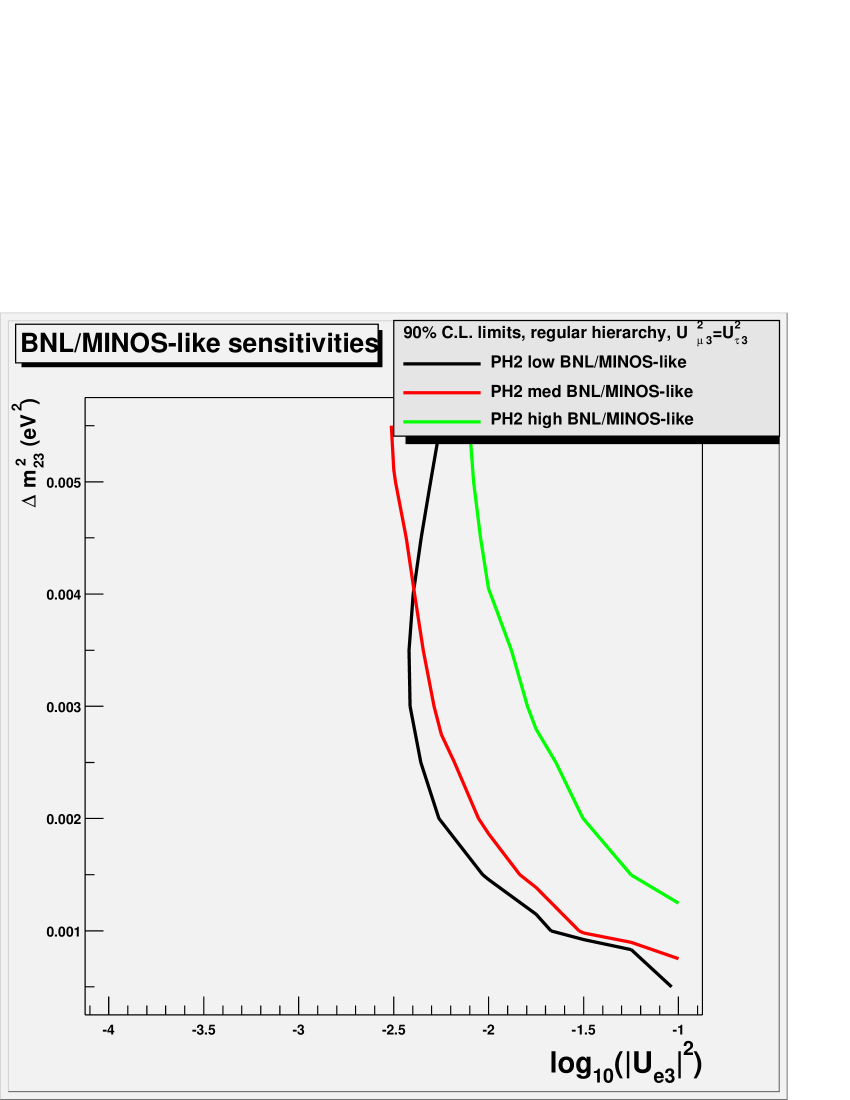
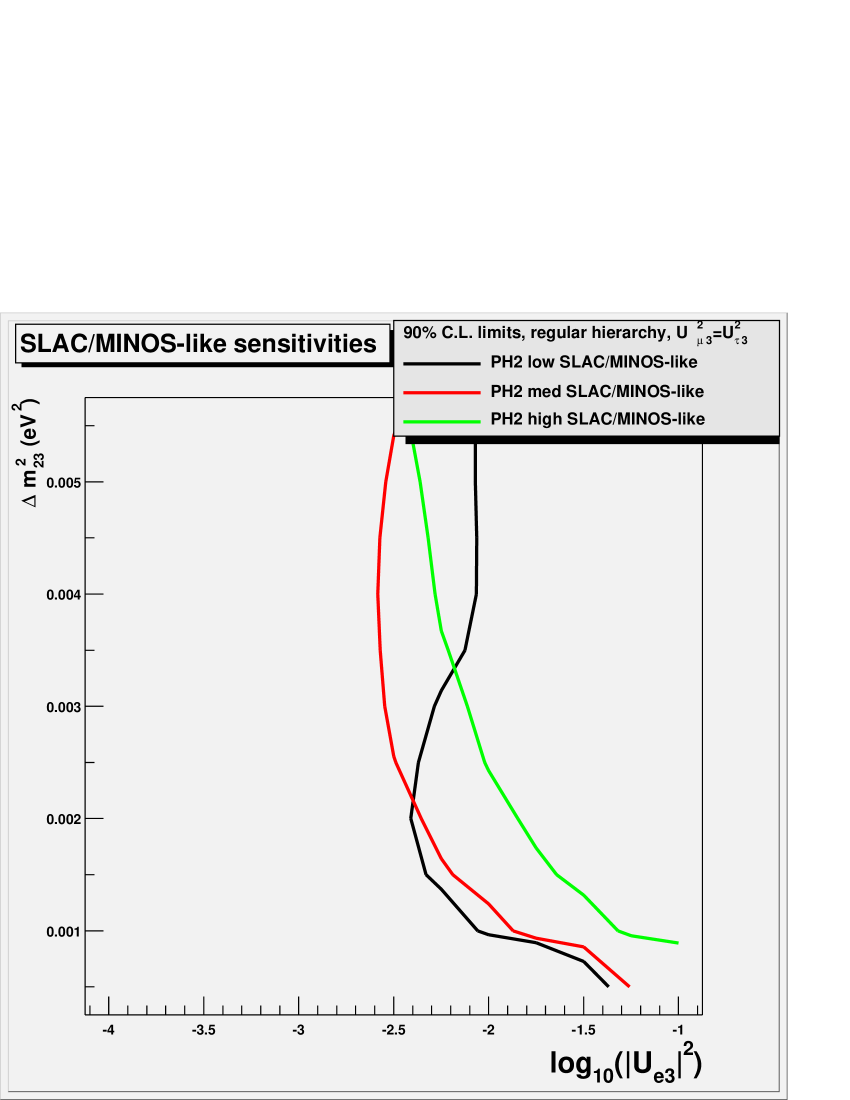
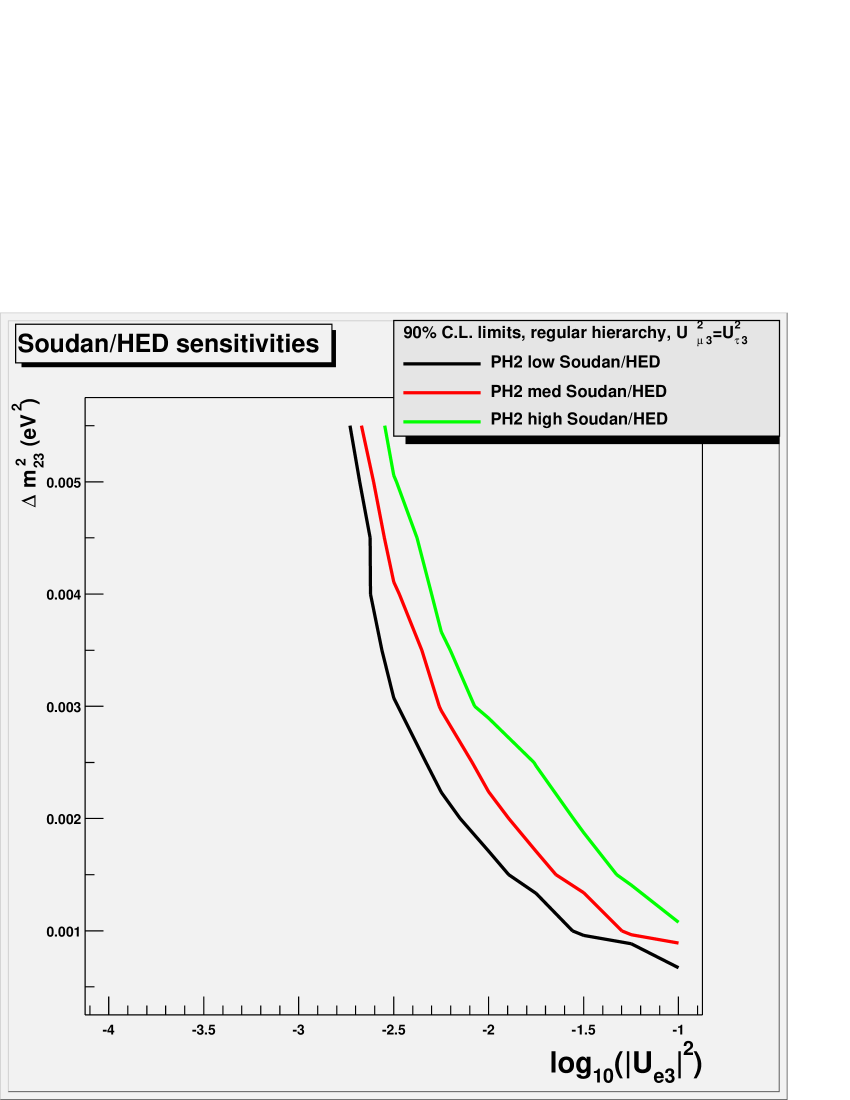
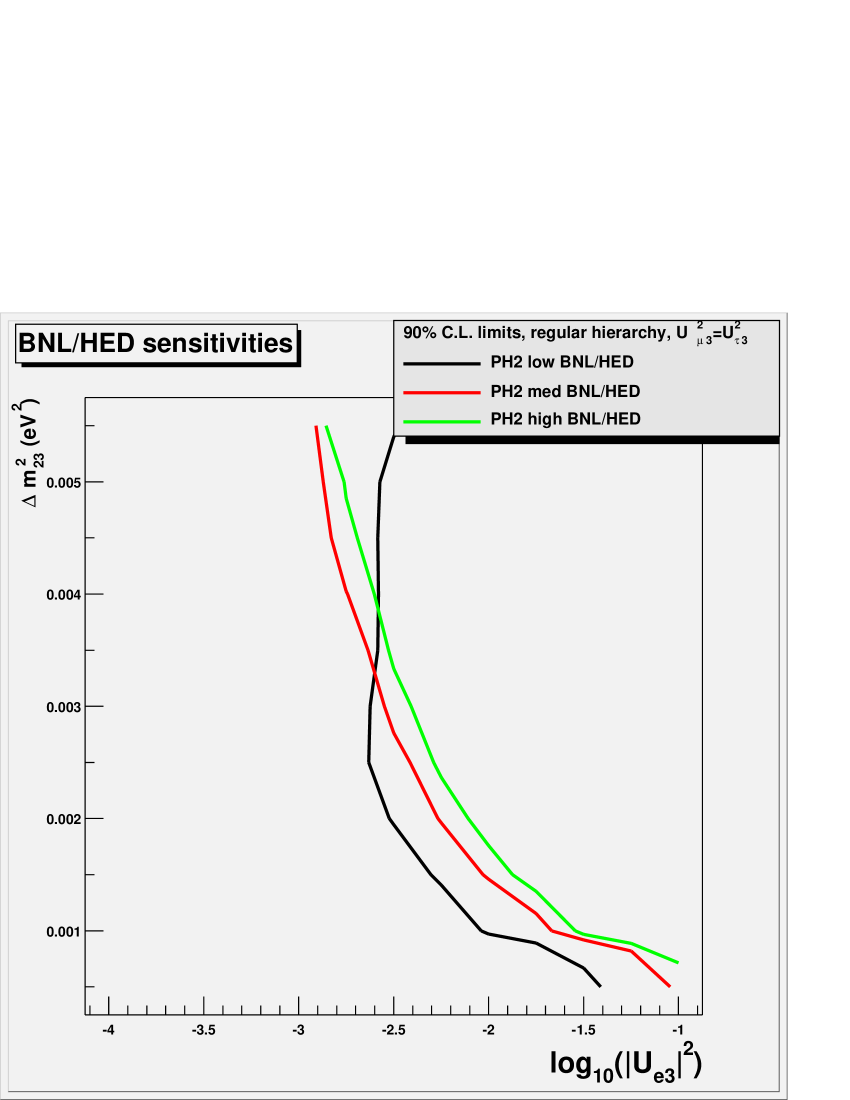
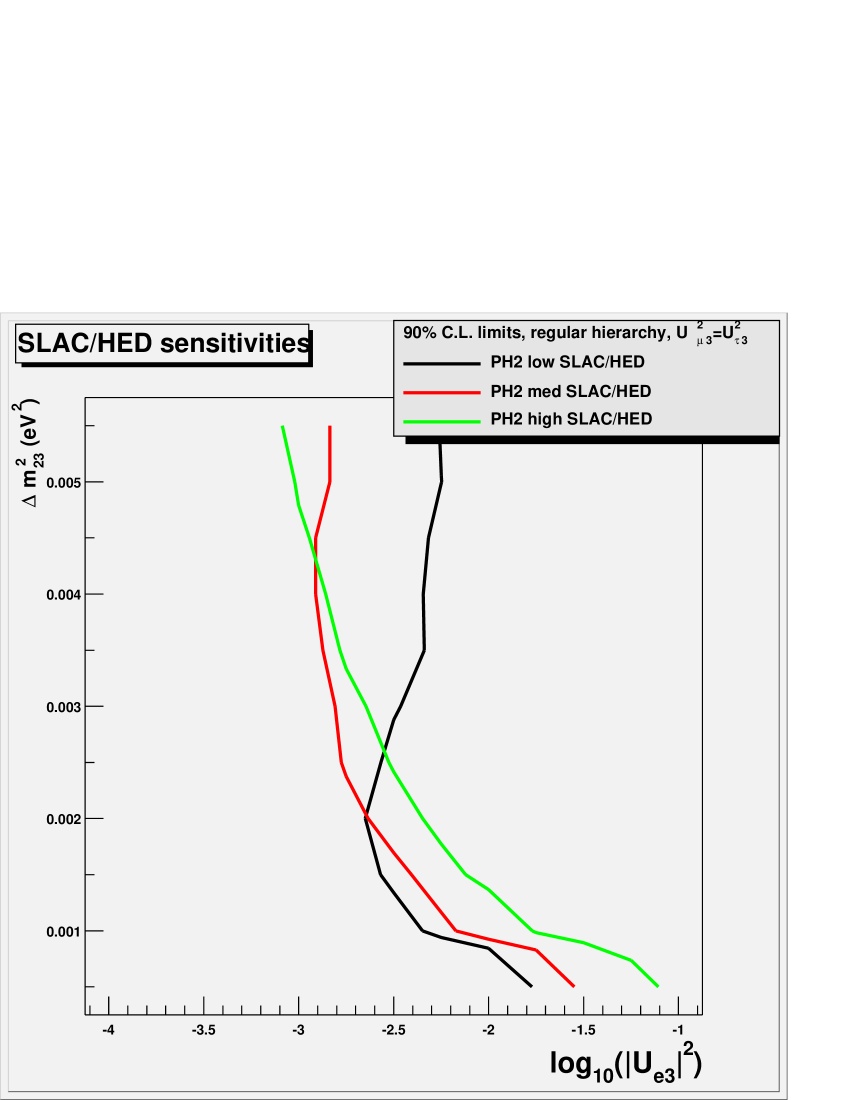
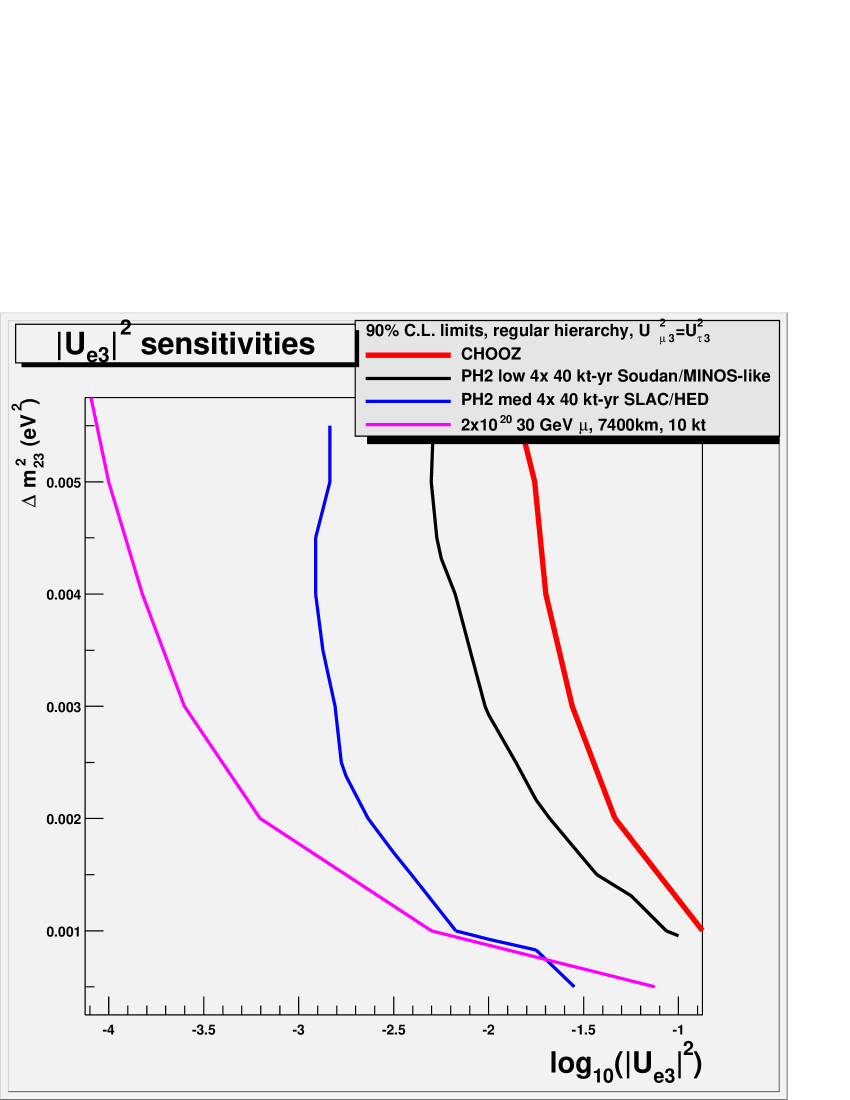
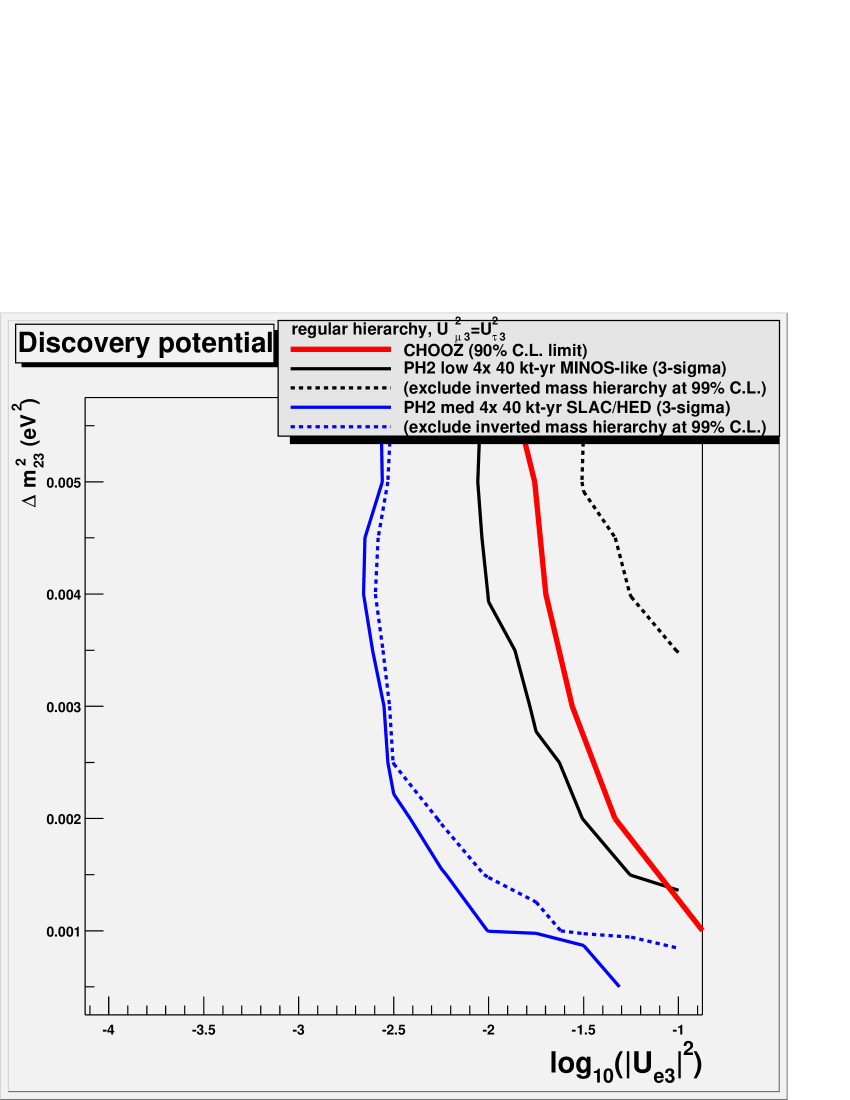
The predicted sensitivities to as a function of are shown in figures 13 through 18. Two general conclusions may be made: 1) OPERA-like is better than MINOS-like, and 2) running “on the highest energy oscillation peak” is best. If we take these calculations at face value, then the best beam/site/detector setup for appears to be the PH2 medium beam pointed at SLAC/HED. (If is slightly higher or lower, then a slightly higher or lower energy beam is optimal.) The predicted sensitivity to including statistical and systematic errors for a 40-kt exposure of HED at SLAC in PH2 medium (4x regular flux) is shown in figure 19. Similarly, the discovery potential for and sign() is shown in figure 20. Note that appearance signals and the sign of can be obtained at the 3-sigma level for 3 degrees.
We would like to thank Stanley Wojcicki, Vittorio Paolone, and Deborah Harris for several useful comments and discussions. Also, we would like to thank Mark Messier for providing a cross-check of our implementation of the Barger et.al. [1] method for calculating neutrino oscillations in matter.
This work was sponsored by the National Science Foundation.
References
- [1] Matter effects on three-neutrino oscillations. V.Barger, et.al. Phys.Rev.D22, pp.2718-2726 (1980).
- [2] Conceptual design for the techincal components of the neutrino beam for the main injector (NuMI). J.Hylen et.al. Fermilab-TM-2018. (Sept.1997)
- [3] New results on atmospheric neutrinos from Soudan 2. W.A.Mann for Soudan-2 Collaboration. PDK-752, TUHEP-00-05, (Jul 2000). Presented at 19th International Conference on Neutrino Physics and Astrophysics - Neutrino 2000, Sudbury, Ontario, Canada, 16-21 Jun 2000. hep-ex/0007031
- [4] The MINOS Detectors Technical Design Report. MINOS Collaboration. NuMI-L-337.
- [5] Optimization of a hybrid emulsion detector for MINOS. B.Bernevig et.al. NuMI-E-525 (Aug.1999)
- [6] Calculation of neutrino oscillation signals in a MINOS hybrid emulsion detector. L.Wai and S.Wojcicki. NuMI-E-547 (Oct.1999)
- [7] Study of sensitivity in MINOS. L.Wai et.al. NuMI-L-714. (Dec.2000)
- [8] MINOS detector GEANT simulation. R.Hatcher. See rhatcher@fnal.gov.
- [9] An appearance experiment to search for oscillations in the CNGS beam. OPERA collaboration. CERN/SPSC 2000-028 (July 2000)
- [10] Limits on Neutrino Oscillations from the CHOOZ Experiment. CHOOZ Collaboration. (19 July, 1999) hep-ex/9907037
- [11] Physics at a Neutrino Factory. FERMILAB-FN-692 (April 2000)
| FNAL-SLAC (2900 km) 40 kt-yr exposure of MINOS-like detector in PH2 medium (4x) | ||||||
|---|---|---|---|---|---|---|
| signal | background | |||||
| CC | CC | NC | ||||
| sequential cuts: | beam | |||||
| all events | 126.4 | 130.4 | 4589.8 | 1325.7 | 3312.7 | 1279.3 |
| 126.4 | 130.4 | 374.9 | 1127.6 | 3312.7 | 1279.3 | |
| 59.3 | 68.2 | 18.8 | 278.2 | 753.1 | 203.0 | |
| cluster | 57.9 | 67.4 | 16.5 | 230.2 | 135.9 | 94.6 |
| neural net | 52.0 | 60.7 | 8.8 | 173.6 | 86.3 | 71.6 |
| 34.9 | 12.3 | 3.0 | 82.8 | 29.4 | 15.6 | |
| efficiency, bkgd fraction | 0.28 | 0.094 | 0.0007 | 0.062 | 0.009 | 0.012 |
| FNAL-SLAC (2900 km) 40 kt-yr exposure of HED detector in PH2 medium (4x) | ||||||
|---|---|---|---|---|---|---|
| signal | background | |||||
| CC | CC | NC | ||||
| sequential cuts: | beam | |||||
| all events | 126.4 | 130.4 | 4589.8 | 1325.7 | 3312.7 | 1279.3 |
| 126.4 | 130.4 | 374.9 | 1127.6 | 3312.7 | 1279.3 | |
| 28.9 | 20.6 | 4.8 | 39.7 | 0.9 | 28.5 | |
| conversion | 28.9 | 20.6 | 0.6 | 39.7 | 0.1 | 3.4 |
| missing | 19.0 | 11.0 | 0.09 | 11.3 | 0 | 0 |
| 17.9 | 6.6 | 0.002 | 6.6 | 0 | 0 | |
| efficiency, bkgd fraction | 0.14 | 0.051 | 0 | 0.005 | 0 | 0 |