BUHE-00-09/
BUTP-2000/26
20. October, 2000
Mapping out the QCD phase transition
in multiparticle production
111We thank the Schweizerische Nationalfonds for his support.
Sonja Kabana
Laboratory for High Energy Physics
University of Bern
CH - 3012 Bern, Switzerland
E-mail: sonja.kabana@cern.ch
and
Peter Minkowski
Institute for Theoretical Physics
University of Bern
CH - 3012 Bern, Switzerland
E-mail: mink@itp.unibe.ch
We analyze multiparticle production in a thermal framework for 7 central nucleus nucleus collisions, + annihilation into hadrons on the Z resonance and 4 hadronic reactions (p+p and p+ with partial centrality selection), with center of mass energies ranging from = 2.6 GeV (per nucleon pair) to 1.8 TeV. Thermodynamic parameters at chemical freeze-out (temperature and baryon and strangeness fugacities) are obtained from appropriate fits, generally improving in quality for reactions subjected to centrality cuts. All systems with nonvanishing fugacities are extrapolated along trajectories of equal energy density, density and entropy density to zero fugacities. The so obtained temperatures extrapolated to zero fugacities as a function of initial energy density universally show a strong rise followed by a saturating limit of = 155 6 20 MeV. We interpret this behaviour as mapping out the boundary between quark gluon plasma and hadronic phases. The ratio of strange antiquarks to light ones as a function of the initial energy density shows the same behaviour as the temperature, saturating at a value of 0.365 0.033 0.07. No distinctive feature of ’strangeness enhancement’ is seen for heavy ion collisions relative to hadronic and leptonic reactions, when compared at the same initial energy density.
1 Introduction
Hadronic reactions involving copious production of secondary particles have been associated with an underlying thermodynamic behaviour since the earliest observations in cosmic rays [1]. The observable energy regime ranging up to 140 TeV per nucleon pair corresponding to incident cosmic ray nucleons of demands elaborate simulations of the observed extended air shower development , in order to extract definite multiplicity distributions of the elementary hadronic and nuclear reactions [2].
Thermodynamic models are widely and successfully used to describe identified particle ratios in hadronic and especially heavy ion collisions [3] , [4], [5], [6], [7], but were also extended to annihilation into hadronic final states [8] , [9]. In heavy ion collisions two main parameters - energy per nucleon pair and centrality - are varied and their influence on thermodynamic variables - temperature and chemical potentials - are studied.
We derive and discuss thermal properties in search of the phase boundary between quark gluon plasma and condensed hadrons. We consider as one characteristic signature of this boundary the critical dependence of kaon number densities on the initial energy density. The kaon multiplicities observed in Pb+Pb collisions at =17 GeV [10], and in other nucleus+nucleus and p+p collisions at 5-19 GeV [11, 12], serve as motivation for our thermal description extending the previous analysis of one of us (SK) [11, 12] (see figure 8).
In section 2 we discuss the dependence of the critical temperature on the vaccum pressure in QCD, limited to the case of vanishing chemical potentials, extending the work of reference [13]. In section 3 we seek to assign each thermodynamic state established at chemical freeze-out for any given reaction for which chemical potentials for baryon number and strangeness do not vanish, an equivalent state at zero fugacities. We do this extrapolating along curves of equal entropy density, energy density and number density. The extrapolation of the temperature of systems with finite fugacities to zero fugacities, and the investigation of their dependence on the initial energy density has been proposed in [12]. We find that a more universal parameter as a measure of positive and negative strangeness production is . This parameter is also extrapolated to the zero fugacity systems.
The details of this procedure are worked out in the first four subsections of section 3. The results at zero fugacities are contained in subsection 3.5 and represented in figures 2 - 8 in relation with the energy density initially achieved in each reaction. Despite large errors, the phase boundary between quark gluon plasma and hadronic phases is clearly mapped out.
We use in the hadronic phase the approximation of noninteracting hadron resonances to describe in this sense global ratios of hadrons produced in the following reactions :
2 Outline of basic points
We consider first the thermodynamic potential of a grand canonical ensemble of hadron resonances without further interactions among them. The thermodynamic variables are
| (1) |
i.e. volume, temperature, baryon and strangeness fugacity. The fugacity of the third component of isospin is set to zero, neglecting isospin asymmetries.
| (2) |
In eq. (2) the sum extends over hadron resonances denoted by , where we only include the pseudoscalar and vector u,d,s meson nonets as well as the spin 1/2 baryon octet and spin 3/2 decuplet and their antiparticles as well as the or , interpreted as scalar glueball [27] for simplicity.
takes into account the nonzero vacuum pressure characterizing the hadronic phase in QCD, which we restrict to the three light flavors.
| (3) |
Converting energy density units to the range of values for the (positive) vacuum pressure becomes
| (4) |
The temperature variation of the vacuum pressure is an approximation with .
The quantities in eq. (2) for noninteracting resonances are then given by
| (5) |
In eq. (5) denote isospin, spin, baryon number and strangeness of the hadron resonance . The -,+ signs apply to bosons and fermions respectively.
If we take into account the variation of the vacuum pressure with temperature then the masses of quasiexcitations become temperature dependent quantities.
In all subsequent calculations we neglect these temperature dependent effects, which however do set in dramatically, when the temperature deviates from the crirtical one by less than 10 %.
| (6) |
We state here, that a thermal description cannot account for any azimuthal ( - ) dependence of inclusive cross sections. Thus azimuthal anisotropies provide a measure for non-equilibration.
The potential in eq. (2) and the entropy denoted by give rise to the differentials
| (7) |
In eq. (7) denotes the entropy density, the energy density and the net baryon and strangeness (number) density respectively.
| (8) |
As is apparent from eq. (7) the entropy density obtains no contribution from vacuum energy density and pressure, as long as the vacuum pressure is taken as independent of temparature as indicated in eq. (6).
Energy density and total number density then take the form
| (9) |
The approximation of hadronic interactions by free hadron resonances is of course at best a consistent approximate thermodynamic description. We will use it here to describe in this sense global ratios of hadrons produced in the reactions listed in the introduction.
We will present a detailed analysis of these collisions, as seen at the time of chemical freeze-out in the next section. The key parameter characterizing not this freeze-out instance but the time of first onset of thermal conditions is the initial energy density . It determines the thermal parameters of the hadronic system as seen at chemical freeze-out and distinguishes those systems which have hadronized after transcurring the quark gluon plasma phase from those which remained throughout in the hadronic phase.
The phase boundary for vanishing fugacities
In the remainder of this section we analyze the equilibrium condition for both phases to coexist in the case of vanishing fugacities or equivalently chemical potentials. This latter choice is just for clarity of argument and also because for limiting center of mass energies and finite baryon number, strangeness and charge of the initial system this is the limiting case.
This condition corresponds to equating the Gibbs densities of the two phases
| (10) |
In the same approximative vein as applied to the hadronic phase (H) we approximate the various quasiexcitations in the quark gluon phase by free gluons, quarks and antiquarks analogous to the form of in eq. (5)
| (11) |
In eq. (11) the color/spin weights, masses and boson/fermion signs are specified. The quark masses represent a renormalization group invariant ’best’ choice. It turns out that near the critical temperature the (anti)quark contributions to the Gibbs density do not deviate substantially from the limit of vanishing quark masses including .
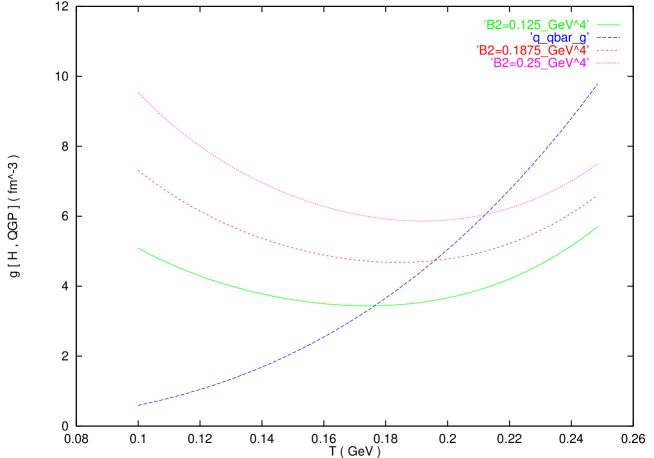
The crossings of and as displayed in figure 1 seem to suggest a first order phase transition with respect to energy density.
This is however due to the approximation of fixed masses for hadron excitations and of free quark and gluon flavors in the region of MeV. We note that the above estimate of the critical tempeature at zero fugacities confirms within the theoretical error the previous estimate of one of us [13].
Within the approximations and errors we obtain the critical temperature and critical hadronic energy density on the side of the hadronic phase for vanishing fugacities
| (12) |
Obviously the critical boundary curve could be extended to arbitrary chemical potentials, but again the ’melting’ of masses of hadronic quasiexcitations modifies the Gibbs density on the side of the hadronic phase, whereas the approximation of free quark and gluon modes does not warrant the extrapolation to arbitrary chemical potentials, especially for small temperature.
3 Reduction of chemical freeze-out parameters to zero fugacities in multiparticle production
In this section we apply the thermal model introduced in the last section (equation 5) to extract the intensive thermodynamic parameters defined in eq. 1. We then extrapolate these parameters to zero fugacities along states with equal entropy density, energy density or density. The goal of this analysis is to compare the temperature at zero fugacities with the initial energy density achieved in the collision in order to reveal a boundary reflecting the QCD phase transition.
One serious well known problem when comparing models to experimental data is due to decays of resonances. This effect is called ’feeding’. We compare calculated particle ratios to experimental data, taking all (strong, electromagnetic and weak) decays with a branching ratio not below 1% into account. We try to account for experimental acceptance for and , assuming a 50% feeding to pions, due to their long decay length. The other weak decays (e.g. , ) have a much shorter decay length and are assumed to fully feed into secondary particles. The decay is not considered.
Contrary to references [4, 5] we do not take all hadronic resonances below 2 GeV mass into account. The theoretical error inherent to the free resonance approximation allows in our opinion our reduced set. This is supported by the finding that we derive similar thermodyamic parameters with similar accuracy as e.g. the ones found in reference [16]. Though the high mass resonances are definitely produced at sufficiently high energy, it is not clear that the thermal description becomes more accurate by including them because the quasiexcitations may not correspond to them, especially if these are quark and gluon modes. All similar thermal descriptions suffer from replacing interactions by noninteracting resonances. Furthermore, the isotropic angular distributions characterizing the models are far from reality [30, 31] (e.g. flow phenomena, diffractive phenomena).
We enforce strangeness conservation, to obtain the best fit, exept in the case of p+p collisions at =17 GeV. We find the error on the fitted parameters, at 1 unit of the ratio of away from the best fitted value. Our quoted error reflects the inherent theoretical error, despite the difficulty to quantify it. Note that other analyses [4, 5] finding a smaller error seem to use as error the fitted parameters at 1 unit of the itself.
In the following sections we note if the data we use are taken with a minimum bias trigger (that means no trigger bias is imposed) or a central respectively a peripheral trigger. Central is here understood as the lowest impact parameter region. It is usually selected in the experiment by considering only collisions with the largest particle multiplicity (e.g. CERN-WA97, Fermilab-E735) or the largest transverse energy (e.g. CERN-NA52), or the smallest forward going energy (which reflects the spectator nucleon number) (e.g. CERN-NA49). Respectively, peripheral collisions are a selection of collisions with the largest impact parameters using the same means as described above (charged multiplicity, energy).
In the following analysis we also give the quantity: which we take as a measure of the strangeness suppression factor defined and used in the literature as [5]. We use antiquarks to consider in a simplified way only the newly produced valence antiquarks. We give also the equivalent at zero fugacities. From quark counting rules one expects to be in the range 0.3-0.5 [32]. In principle one should include in any definition of the newly produced sea quarks however the relevant proportion of the latter inside hadrons, is still subject of experimental and theoretical investigations.
Generally we find that thermal fits to minimum bias or peripheral nuclear and hadronic reactions are not satisfactory, in contrast to central collisions. We conjecture that this is due to the presence of at least two thermal sources which we attribute to diffractive versus pomeron induced subprocesses. Diffractive processes at finite feed back into the midrapidity region, whereas pomeron induced subprocesses result in particle production at midrapidity dominantly. Following this conjecture, we conclude that the relative importance of diffractive to pomeron induced subprocesses decreases with increasing centrality of the collision. In this respect it would be helpful firstly, to increase experimental coverage in the target and/or the projectile fragmentation regions. This study has been proposed by [33, 34]. Secondly, it is important that experiments apply centrality cuts, in nucleus+nucleus as well as in p+nucleus and in elementary particle collisions.
3.1 Nucleus nucleus reactions
In the following 4 subsections we analyse data from nucleus nucleus collisions at 1. RHIC, 2. SPS, 3. AGS and 4. SIS energies.
3.1.1 Central Au+Au collisions at =130 GeV
We used 3 measured ratios at midrapidity
from [14, 15] :
, and / Ncharged
and imposed strangeness conservation.
We exclude weak decay products as is done in the experiment
[14].
The data from reference [15] are preliminary.
The predicted
and the experimental ratios are shown in table 1.
The resulting is (1.41/1) (CL 23%) for a temperature of
168 40 MeV.
When adding a systematic error of 15% linearly to account for the
experimental feeding uncertainties and the fact that the ratios are measured at
midrapidity only,
the resulting is 0.27/1 (CL 60%).
The errors on the temperature and
are not well estimated in this analysis due to the
insensitivity of the ratios used, to the temperature at fixed fugacities.
We estimate the error on the temperature searching for
a variation of the by 1, while changing the fugacities
and fixing each time the T by imposing strangeness conservation.
In order to improve the fit quality the addition of other ratios
more sensitive to temperature variations is needed,
like etc., which will soon be measured by the experiments at RHIC.
After defining the (T, , ) values describing the particle
ratios produced in central Au+Au collisions at
=130 GeV at the chemical freeze-out
we extrapolate to the T at zero fugacities (table 2).
Because of the very small value of the fugacities, the extrapolated
values do not differ much from the ones at finite fugacitites.
The of all reactions are shown in table 21.
| ratio | model | data |
|---|---|---|
| 0.718 | 0.70 0.25 | |
| 0.662 | 0.650 0.090 | |
| 0.491 | 0.432 0.0504 |
Predicted versus experimental particle ratios for the best fit of our model.
| T | ||||||
|---|---|---|---|---|---|---|
| GeV | GeV | GeV | GeV/fm3 | GeV | ||
| 0.0390 | 0.0084 | 0.168 | 0.443 | 0.401 | 0.169 | 0.422 |
| 0.040 | 0.040 | +0.105 -0.156 | ||||
| 1/fm3 | GeV | |||||
| 0.453 | 0.168 | 0.443 | ||||
| 0.040 | +0.11 - 0.164 | |||||
| 1/fm3 | GeV | |||||
| 2.83 | 0.168 | 0.443 | ||||
| 0.040 | +0.11 - 0.164 |
Thermodynamic parameters for the best fit and temperatures and extrapolated to zero fugacities.
3.1.2 Central nucleus nucleus collisions at 200 A GeV
Here we show results from central Pb+Pb collisions at 158 A GeV, and from S+S and S+A collisions at 200 A GeV.
Central Pb+Pb collisions at 158 A GeV
For central Pb+Pb collisions at 158 A GeV, we use the particle ratios from table I in [16] to compare with our model predictions. We don’t consider a chemical potential for isospin [16], therefore we don’t consider e.g. the ratio. We did not use the ratios in [16] for which feeding correction is included. We did not use the ratio, since there is strong experimental evidence that and are formed in the thermal hadronic freeze-out through coalescence [10, 35]. Furthermore, the may not freeze out in the chemical hadronic freeze-out due to the high cross section for annihilation to e.g. as noted in [36].
We introduce a systematic error of 14% (quadratically added) in the ratios including WA97 data, because they are measured at midrapidity only. We add also quadratically) a 10% systematic error to ratios including due to uncertainty in the feeding correction. The predicted ratios are shown in table 3 together with the experimental data.
The at which strangeness is conserved is 16.1 over 12 degrees of freedom (CL=20 % =1.34) and corresponds to T=162 +10 -28 MeV. The asymmetry of the error (defined as the T deviation 1 unit of away) is due to the fact that the 16.1 is not at the minimum. The minimum of the is 11.9 over 11 DOF (CL=50%, =1.08) at T=154 +14 -16 MeV. There is a probable physics process which may induce an imbalance of strangeness in experiment, if the measurements do not include the target and beam fragmentation regions: in particular particles with negative especially hyperons may be produced near beam rapidity. In ref. [37] it is conjectured that strangeness is not balanced (with missing particles with negative). However we will demand in the following exact strangeness conservation.
After defining the (T, , ) values describing the particle ratios produced in central Pb+Pb collisions at 158 A GeV at the chemical freeze-out we extrapolate to T at zero fugacities. The resulting equivalent temperatures for equal entropy density (), energy density (), and number density () are shown in table 4.
| ratio | model | data |
|---|---|---|
| 0.165 | 0.228 4.31E-2 | |
| 7.35E-2 | 8.10E-2 1.30E-2 | |
| 0.142 | 0.125 1.90E-2 | |
| 0.124 | 0.123 2.64E-2 | |
| 1.04E-1 | 7.70E-2 1.54E-2 | |
| 0.835 | 0.630 1.02E-1 | |
| 1.78 | 1.85 9.00E-2 | |
| 1.78 | 1.80 1.00E-1 | |
| 0.170 | 0.188 3.90E-2 | |
| 0.115 | 0.130 3.00E-2 | |
| 0.193 | 0.232 3.30E-2 | |
| 0.193 | 0.247 4.30E-2 | |
| 0.357 | 0.383 8.10E-2 | |
| 0.153 | 0.219 5.00E-2 |
Predicted versus experimental particle ratios for the best fit of our model.
| T | ||||||
|---|---|---|---|---|---|---|
| GeV | GeV | GeV | GeV/fm3 | GeV | ||
| 0.239 | 0.0517 | 0.162 | 0.565 | 0.408 | 0.169 | 0.422 |
| +0.010 | +0.008 | +0.025 | ||||
| -0.028 | -0.030 | -0.118 | ||||
| 1/fm3 | GeV | |||||
| 0.444 | 0.167 | 0.418 | ||||
| +0.008 | +0.025 | |||||
| -0.030 | -0.117 | |||||
| 1/fm3 | GeV | |||||
| 2.8049 | 0.168 | 0.420 | ||||
| +0.009 | +0.026 | |||||
| -0.031 | -0.116 |
Thermodynamic parameters for the best fit and temperatures and extrapolated to zero fugacities.
Central S+A collisions at 200 A GeV
In table 5 we give the same quantities for central S+A collisions at 200 A GeV with A=Au,W,Pb. The data used are taken from reference [17]. Here we mainly used the and ratios to find (T, , ) while we also suppose exact strangeness conservation. The resulted predicted ratios are = 0.131 and = 1.59 to be compared with the experimental data = 0.12 0.02 and = 1.59 0.15. The resulting temperature is T=166 +10 -28 MeV. The errors are taken to be percentually the same as in the Pb+Pb system. We do not perform a full fit, as the resulting temperature is within the errors in agreement with reference [17] where a full fit to many ratios is performed. The calculated values in [17] are T=165 5 MeV, =175 5 MeV, =42.5 4.5 MeV.
| T | ||||||
| GeV | GeV | GeV | GeV/fm3 | GeV | ||
| 0.191 | 0.0426 | 0.166 | 0.544 | 0.424 | 0.169 | 0.422 |
| +0.010 | +0.08 -0.030 | +0.025 -0.118 | ||||
| -0.028 | +0.08 -0.030 | +0.025 -0.118 | ||||
| 1/fm3 | GeV | |||||
| 0.464 | 0.169 | 0.422 | ||||
| +0.08 -0.030 | +0.025 -0.118 | |||||
| 1/fm3 | GeV | |||||
| 2.92 | 0.169 | 0.422 | ||||
| +0.08 -0.030 | +0.025 -0.118 |
Thermodynamic parameters for the best fit and temperatures and extrapolated to zero fugacities.
Central S+S collisions at 200 A GeV
In table 6 the results for the central S+S collisions at 200 A GeV are shown, data are taken from references [18]. We use , , , and as well as strangeness conservation. The resulting /DOF =1.95/3=0.65 (CL 57%) imposing strangeness conservation is at T=182 +19 -8 MeV. The minimum of (=1.6/3=0.53 CL 66%) is at T=186 12 MeV.
| T | ||||||
| GeV | GeV | GeV | GeV/fm3 | GeV | ||
| 0.218 | 0.058 | 0.182 | 0.654 | 0.182 | 0.187 | 0.473 |
| +0.019 | +0.065 | +0.021 | +0.047 | |||
| -0.008 | -0.003 | -0.009 | -0.023 | |||
| 1/fm3 | GeV | |||||
| 0.803 | 0.186 | 0.470 | ||||
| +0.009 | +0.047 | |||||
| -0.020 | -0.023 | |||||
| 1/fm3 | GeV | |||||
| 4.98 | 0.187 | 0.473 | ||||
| +0.021 | +0.048 | |||||
| -0.009 | -0.023 |
Thermodynamic parameters for the best fit and temperatures and extrapolated to zero fugacities.
3.1.3 Central nucleus nucleus collisions at 10 A GeV
Here we show results from central Si+Au collisions at 14.6 A GeV, and from Au+Au collisions at 11.6 A GeV.
Central Si+Au collisions at 14.6 A GeV
In table 7 the results for central Si+Au collisions
at 14.6 A GeV are shown.
We use the ratios , , and
from [5]
as well as strangeness conservation.
We did not use
in view of the large annihilation
expected at low energy.
The resulting =6.8/2=3.4 (CL 3.3%)
imposing strangeness conservation is at T=120 +8 -35 MeV.
We note however that the best ignoring strangeness conservation
(=0.092/2 with CL 63%) is at =4.05, =0.9
and T=102 MeV.
| T | ||||||
|---|---|---|---|---|---|---|
| GeV | GeV | GeV | GeV/fm3 | GeV | ||
| 0.540 | 0.107 | 0.120 | 0.548 | 0.170 | 147.4 | 0.347 |
| +0.008 | +0.013 | +0.052 | ||||
| -0.035 | -0.056 | -0.250 | ||||
| T | ||||||
| 1/fm3 | GeV | |||||
| 0.182 | 0.141 | 0.322 | ||||
| +0.013 | +0.048 | |||||
| -0.053 | -0.23 | |||||
| T | ||||||
| 1/fm3 | GeV | |||||
| 1.161 | 0.143 | 0.330 | ||||
| +0.013 | +0.049 | |||||
| -0.054 | -0.237 |
Thermodynamic parameters for the best fit and temperatures and extrapolated to zero fugacities.
Central Au+Au collisions at 11.6 A GeV
The results for central Au+Au collisions at 11.6 A GeV are shown in tables 8, 9. We used , , and ratios from [5]. The resulting =0.99/2=0.496 (CL 60%) imposing strangeness conservation is at T=96 +4 -5 MeV. The minimum of (=0.92/2=0.46 CL 63%) is at T=95 MeV.
| ratio | model | data |
|---|---|---|
| 0.562 | 0.675 0.144 | |
| 5.65 | 6.303 2.55 | |
| 1.088 | 1.098 0.127 | |
| 7.299E-2 | 8.080E-2 1.420E-2 |
Predicted versus experimental particle ratios for the best fit of our model.
| T | ||||||
|---|---|---|---|---|---|---|
| GeV | GeV | GeV | GeV/fm3 | GeV | ||
| 0.563 | 0.084 | 0.096 | 0.281 | 0.484E-01 | 0.121 | 0.233 |
| 0.005 | 0.08 | 0.037 | ||||
| 1/fm3 | GeV | |||||
| 0.602E-01 | 0.113 | 0.196 | ||||
| 0.079 | 0.037 | |||||
| 1/fm3 | GeV | |||||
| 0.387 | 0.116 | 0.210 | ||||
| 0.08 | 0.037 |
Thermodynamic parameters for the best fit and temperatures and extrapolated to zero fugacities.
3.1.4 Central nucleus nucleus collisions at 2 A GeV
Central Ni+Ni collisions at 1.9 A GeV
The results for central Ni+Ni collisions at 1.8 A GeV are shown in tables 10, 11. We used the measured and ratios from [21, 22] (figure 4.4) and used additionally the ratio deduced as and imposed strangeness conservation. We add a systematic error of 15% for the feeding experimental uncertainty linearly. The resulting =2.16/1 (CL 10%) imposing strangeness conservation is at T=0.044 +0.0023 -0.0002 GeV. The minimum of (=0.025/1 with CL better than 90%) is at T=0.0448 GeV.
| ratio | model | data |
|---|---|---|
| 0.373 | 0.275 6.72E-2 | |
| 20.90 | 20.86 6.88 | |
| 3.16E-3 | 3.20E-3 9.10E-4 |
Predicted versus experimental particle ratios for the best fit of our model.
| T | ||||||
|---|---|---|---|---|---|---|
| GeV | GeV | GeV | GeV/fm3 | GeV | ||
| 0.678 | 0.102 | 0.044 | 8.93E-3 | 0.987E-03 | 0.602E-01 | 1.55E-02 |
| 0.0023 | 0.00335 | 0.0114 | +0.0435 | |||
| -5.55E-3 | ||||||
| 1/fm3 | GeV | |||||
| 0.161E-02 | 0.504E-01 | 5.16E-03 | ||||
| 0.0096 | +0.0144 | |||||
| -1.84E-3 | ||||||
| 1/fm3 | GeV | |||||
| 1.18E-02 | 5.32E-2 | 7.38E-03 | ||||
| 0.0104 | +0.0207 | |||||
| -2.64E-3 |
Thermodynamic parameters for the best fit and temperatures and extrapolated to zero fugacities.
3.2 Electron positron reactions
The primary production in collisions is not thermal due to the hard nature of the primary , couplings. However as long as the final particle multiplicity is much higher than 2, it is conceivable that this fact does not matter and the subsequent fragmentation of quark-antiquark jets into hadrons is thermal. We used the , , and ratios.
Our results for collisions at =91 GeV are shown in table 12. We used the data from reference [9] in particular the initially produced particles from the Pei model (table 1 in [9]). We used as systematic error of the feeding correction performed in this model, the difference between the Pei and the Jetset model (also in table 1 in [9]). The resulting minimum =2.52/3=0.84 (CL 47%) is at T=145 +39 -45 MeV and is 0.338 +0.127 -0.2.
In reference [38] a temperature of 160.6 1.7 3.1 is given for collisions at 91 GeV, however with a not acceptable of 60.8/21, having a CL of . In this reference strangeness has been weigted by a factor which is a free parameter of the fit. In reference [9] a temperature of T=142.4 0.018 MeV and =0.295 0.006 are extracted in collisions at 91 GeV. Within our large errors we agree with both reference [38] and [9]. Our best value of the temperature is however nearer to the results of reference [9].
| T | ||||||
|---|---|---|---|---|---|---|
| GeV | GeV | GeV | GeV/fm3 | 1/fm3 | 1/fm3 | |
| 0. | 0. | 0.145 | 0.338 | 0.152 | 0.208 | 1.25 |
| +0.039 -0.045 | +0.127 -0.20 |
Thermodynamic parameters for the best fit and temperatures and extrapolated to zero fugacities.
3.3 Hadronic reactions
3.3.1 Proton proton reactions
Here we show results from p+p collisions at =17 and 27 GeV.
Proton proton reactions at =27 GeV
For p+p collisions at =27 GeV we used 9 measured ratios from reference [38] namely , , , , , , , , and imposed strangeness conservation. We add a systematic error of 15% linearly to account for the experimental feeding uncertainties. The predicted and the experimental ratios are shown in table 13. We find a temperature of 128 +5 -9 MeV, with a =71/5=14.2, which has a CL of the order , therefore the fit is not acceptable (table 14).
In reference [23] the authors discuss p+p collisions at 4 different . For =27 GeV considered here, the obtained is 136.4/27 with a CL much less than . The obtained temperature in [23] is 169 2.1 3.4.
The bad quality of the fits of p+p collisions at =27 GeV renders the resulting temperatures questionable. Nevertheless we point out that the two analyses yield incompatible temperature values within the errors. The analysis of [23] does not introduce systematic errors as we do. However, it allows for an arbitrary weighting factor (called ) acting only on strange particles. This factor is similar to an increase of the systematic experimental errors of strange particle multiplicities only.
| ratio | model | data |
|---|---|---|
| 0.120 | 7.35E-2 1.80E-2 | |
| 2.65E-2 | 5.25E-2 1.36E-2 | |
| 5.51 | 3.14 0.846 | |
| 6.89E-2 | 7.75E-2 3.15E-2 | |
| 0.533 | 0.539 0.158 | |
| 1.52 | 1.48 0.364 | |
| 3.88E-2 | 0.160 6.75E-2 | |
| 1.07E-2 | 5.034E-3 1.34E-3 | |
| 0.148 | 0.182 4.97E-2 |
Predicted versus experimental particle ratios for the best fit of our model. The of this fit is not acceptable.
| (GeV) | (GeV) | T (GeV) | ||||
|---|---|---|---|---|---|---|
| GeV | GeV | GeV | GeV/fm3 | GeV | ||
| 0.243 | 0.0282 | 0.128 | 0.329 | 0.830E-1 | 0.132 | 0.283 |
| +0.005 | +0.005 | +0.0218 | ||||
| -0.009 | -0.010 | -0.045 | ||||
| 1/fm3 | GeV | |||||
| 0.123 | 0.131 | 0.279 | ||||
| +0.005 | +0.0215 | |||||
| -0.010 | -0.044 | |||||
| 1/fm3 | GeV | |||||
| 0.744 | 0.132 | 0.283 | ||||
| +0.005 | +0.0218 | |||||
| -0.010 | -0.045 |
Thermodynamic parameters for the best fit and temperatures and extrapolated to zero fugacities. The of this fit is not acceptable.
Proton proton reactions at =17 GeV
We used 6 measured ratios from references [24, 25] namely , , , , , and imposed strangeness conservation. We add a systematic error of 15% linearly to account for the experimental feeding uncertainties. The resulting is (322/4)=80.6 (CL of the order !) for a temperature of 144 MeV, is completely unacceptable.
The predicted ratios in table 15 are overestimating , and yields, therefore suggesting that if thermal conditions prevail, then at least two thermal reservoires are present. This may be due to the influence of diffractive processes in minimum bias triggers.
We therefore repeat the fit with only ratios which are not much influenced by diffractive processes namely , , and . Note that the temperature at the minimum of does not satisfy strangeness conservation. This is combatible with the hypothesis of the importance of diffractive processes showing up in leading baryons (e.g. p, ). Imposing strangeness conservation the fit results in a temperature of 144 MeV with a bad =169/1 (CL ). At the minimum of the the temperatures is 96 +8 -9 MeV with a better =5.13/1 (CL 2%). These results are shown in tables 16, 17. The very small errors resulting for p+p collisions at =17 and 27 GeV should not be trusted because of the bad CL of the fit.
| ratio | model | data |
|---|---|---|
| 0.136 | 5.97E-2 9.90E-3 | |
| 5.97E-2 | 4.68E-2 8.06E-3 | |
| 4.261 | 3.59 0.558 | |
| 1.55 | 1.61 0.277 | |
| 1.83 | 4.25E-3 1.17E-3 | |
| 0.578 | 0.214 3.56E-2 |
Predicted versus experimental particle ratios for the worst fit of our model.
| ratio | model | data |
|---|---|---|
| 0.0723 | 5.97E-2 9.90E-3 | |
| 5.36E-2 | 4.68E-2 8.06E-3 | |
| 47.7 | 3.59 0.558 | |
| 1.60 | 1.61 0.277 | |
| 2.06E-3 | 4.25E-3 1.17E-3 | |
| 3.44 | 0.214 3.56E-2 |
Predicted versus experimental particle ratios for the best fit of our model. Only three ratios are fitted (, , ).
| T | ||||||
| GeV | GeV | GeV | GeV/fm3 | GeV | ||
| 0.222 | 0.0277 | 0.096 | 0.151 | 0.0124 | 0.096 | 0.121 |
| +.008 | +0.008 | +0.034 | ||||
| -.009 | -0.010 | -0.039 | ||||
| 1/fm3 | GeV | |||||
| 0.0293 | 0.096 | 0.121 | ||||
| +0.008 -0.010 | +0.034 -0.039 | |||||
| 1/fm3 | GeV | |||||
| 0.157 | 0.097 | 0.125 | ||||
| +0.008 -0.010 | +0.035 -0.04 |
Thermodynamic parameters for the best fit and temperatures and extrapolated to zero fugacities. Only three ratios are fitted (, , ).
3.3.2 Proton antiproton reactions
Here we show results from collisions at =900 GeV and central and peripheral collisions at =1.8 TeV .
Central proton antiproton reactions at =900 GeV
For collisions at =900 GeV we used 5 measured ratios out of the multiplicities from reference [23]. in particular and , , , . The predicted and the experimental ratios are shown in table 18. The temperature from the fit is:
T( =900 GeV) = 143 +21 -37 MeV
with a of 4.48/4 having a CL of 34%, while is
( =900 GeV) = 0.330 +0.077 -0.166.
We add linearly a systematic error of 15% to account for experimental feeding uncertainties. The experimental errors are very large (e.g. 57% for ) therefore the resulting temperature has also a large error.
| ratio | model | data |
|---|---|---|
| 5.73E-2 | 3.85E-2 1.06E-2 | |
| 2.17E-2 | 2.81E-2 1.25E-2 | |
| 0.181 | 0.277 0.114 | |
| 7.96 | 10.86 8.344 | |
| 1.305E-3 | 9.83E-4 7.12E-4 |
Predicted versus experimental particle ratios for the best fit of our model.
Peripheral proton antiproton reactions at =1.8 GeV
For the most peripheral collisions at =1.8 TeV we used 2 measured ratios from reference [26] namely and (table 19). We use the only 2 available ratios from experiment, which with zero fugacities and temperature as the only parameter leaves one degree of freedom. The most peripheral collisions are defined as the ones with the lowest measured charge multiplicity. The temperature from the fit is
T(peripheral =1.8 Te)= 140 8 MeV
with a of 18.04/1 having a CL of 2.0E-4, therefore the fit is very bad. We add a systematic error of 0.004 linearly to account for the experimental feeding uncertainties. This error has been estimated from deviations between the ratios found in different experimental runs with collisions at =1.8 TeV [39]. The predicted and the experimental ratios are shown in table 19. Then the resulting temperature is 154 9 MeV and the is 6.36/1 having a CL of 1.1%. The quality of the fit is low as in the minimum bias p+p data at lower energies. is
(peripheral =1.8 Te)= 0.372 +0.031 -0.034.
| ratio | model | data |
|---|---|---|
| 0.144 | 0.115 1.20E-2 | |
| 6.87E-2 | 7.40E-2 9.00E-3 |
Predicted versus experimental particle ratios for the best fit of our model.
Central proton antiproton reactions at =1.8 TeV
The results for the most central collisions at =1.8 TeV are shown in table 20. The most central collisions are defined as the ones with the highest measured charge multiplicity. For the most central collisions at =1.8 TeV we used again the 2 measured ratios from reference [26] namely and . The predicted and the experimental ratios are shown in table 20. The temperature from the fit is
T(central =1.8 TeV)= 150 9 MeV
with a of 2.28E-3/1 having a CL of 96%. is
(central =1.8 TeV)= 0.357 +0.035 -0.033.
We did not add a systematic error.
| ratio | model | data |
|---|---|---|
| 0.1424 | 0.1420 2.00e-2 | |
| 6.24e-2 | 6.20e-2 9.00E-3 |
Predicted versus experimental particle ratios for the best fit of our model.
We think that the dramatic change in the quality of the fit between peripheral and central collisions can not be explained by overestimated experimental errors in the central collisions respectively by underestimated experimental errors in the peripheral collisions alone. Barring the obvious possibility that peripheral collisions are non thermal the situation supports our previous conjecture on the important role of diffractive processes in peripheral and minimum bias hadronic collisions.
| collision | (CL) | (CL) no SC |
| Au+Au =130 GeV | 1.41/1 (CL 23%) | |
| with syst. error 15% | 0.27/1 (CL 60%) | |
| Pb+Pb =17 GeV | 16.1/12=1.34 (CL 20%) | 11.9/11=1.08 (CL 50%) |
| S+A =19 GeV | no fit performed | |
| S+S =19 GeV | 1.95/3=0.65 (CL 57%) | 1.6/3=0.53 (CL 66%) |
| Si+Au =5.4 GeV | 6.8/2=3.4 (CL 3.3%) | 0.092/2=0.046 |
| (CL 63%) | ||
| Au+Au =4.9 GeV | 0.99/2=0.50 (CL 60%) | 0.92/2=0.46 (CL 63%) |
| Ni+Ni =2.6 GeV | 2.16/1 (CL 10%) | 0.025/1 (CL 90%) |
| p+p =17 GeV | 169/1 (CL ) | 5.13/1 (CL 2%) |
| min. bias (3 ratios) | ||
| p+p =27 GeV | 71/5=14.2 (CL ) | 68.6/5=13.7 (CL ) |
| min. bias | ||
| =900 GeV | 4.48/4 (CL 34%) | |
| min. bias | ||
| =1.8 TeV | 2.3E-3/1 (CL 96%) | |
| =1.8 TeV | ||
| peripheral | 18/1 (CL 2E-4) | |
| no syst. error | ||
| periph. | 6.36/1 (CL 1.1%) | |
| with syst. error | ||
| =91 GeV | 2.52/3=0.84 (CL 47%) | |
| minimum bias |
3.4 The initial energy density estimation
To estimate the initial energy density achieved in each collision we use several methods. The first method is based on Bjorken’s formula [40]:
| (13) |
where is the transverse energy () per unit rapidity at midrapidity, is the transverse radius of the particle source after a formation time taken to be 1 fm/c.
We estimate the when not available from experiment, as follows. We first estimate the total as
| (14) |
(Method ())
where the sum runs over particles of type with multiplicity per rapidity unit at midrapidity (ycm) , mean transverse momentum and mass . The mean transverse momentum is also taken at midrapidity, when available. We take three types of particles: , and nucleons, as well as antinucleons when available. To calculate the differencial , when not available, we first find the mean , dividing the total particle multiplicity by the total rapidity interval and then we use an extrapolation factor A to extract the value at midrapidity. This factor is found from measured rapidity distributions of particles at or as near as possible to the considered. This may vary from nuclear to hadronic reaction and with . In the cases where the of the particles are measured at midrapidty we use these values.
The formation time is taken in the literature usually in all reactions 1 fm/c, and this is what we use. In the following we give some examples of our estimation with method ().
1. For the collisions at =91 GeV we used the multiplicities from [9]. For two jet events in collisions the jet axis is the longitudinal axis defining rapidity and refers to it. We used the at midrapidity of , , in quark jets produced in collisions at =91 GeV by the DELPHI collaboration [42].
We used the mean transverse momenta from hadron hadron collisions at high . In particular we use the mean transverse momenta from collisions at 1.8 TeV from [26] at charged multiplicity N (to represent minimum bias values) namely
= 0.34 GeV,
= 0.5 GeV and
= 0.59 GeV.
In hadron collisions the mean transverse momenta do not change much with above 10 GeV (see e.g. figure 2.7 in [22]). The transverse size of the initial hadronic system of quarks and antiquarks produced, is given by the uncertainty principle, as 1 over the average . For the transverse radius of collisions we take therefore the inverse mean of 0.34 GeV, giving =0.6 fm. The resulting initial energy density is:
( =91 GeV)=1.84 GeV/.
The systematic error (which in this case is dominated by the uncertainty in the determination) is about 50%.
2. at =1.8 TeV For we use the same method, while we use as transverse radius the radius of the nucleon of 0.8 fm. We use again pions, kaons, nucleons and antinucleons, and the mean transverse momenta measured in [26]. We derive the from the measured charged total multiplicity per unit rapidity at midrapidity, using the ratios and mean transverse momenta measured as a function of charged multiplicity in [26]. No extrapolation factor to midrapidity is needed here. We find
| = | 7.61 GeV/, | |
| = | 5.82 GeV/, | |
| = | 4.31 GeV/, | |
| = | 2.03 GeV/, | |
| = | 0.772 GeV/. |
In reference [26] the for of 3 GeV/fm3 is calculated using pions only, and therefore is lower than our estimate222We find the same as reference [26], when we use only pions..
3. =900 GeV For at =900 GeV we use the multiplicities from [38] and the mean transverse momenta for at =1.8 TeV from [26]. We took the mean multiplicity per unit rapidity without extrapolation factor A to midrapidity since we don’t know the shape of the rapidity distributions. We find
( =900 GeV)= 1.23 GeV/
The pseudorapidity distribution of charged particles produced in collisions at =1.8 TeV is relatively flat over 6 rapidity units as measured by CDF [49]. However this may differ at the lower of 900 GeV. We use the extrapolation factor A=1.49 (=) from the measured distribution in [41]. The resulting has an uncertainty of about 50%.
4. Au+Au =130 GeV For Au+Au at =130 GeV we used the mean from collisions at =1.8 TeV and the particle multiplicities at midrapidity (negative hadrons, total charged multiplicity, nucleons estimated from , as well as antinucleons using the ratio) from [14, 15].
With the above method () (equations 13 , 14) we calculated the for several reactions. We summarize the results here:
(Au+Au =4.9 GeV) = 0.86 GeV/, with instead of for nucleons
(Si+Au =5.4 GeV) = 0.53 GeV/, with instead of for nucleons
In the following we used for nucleons too
(Au+Au =4.9 GeV) = 1.70 GeV/,
(Si+Au =5.4 GeV) = 1.53 GeV/,
(S+S =19 GeV) = 1.21 GeV/,
(Pb+Pb =17 GeV) = 2.4 GeV/,
(Au+Au =130 GeV) = 6.34 GeV/,
( =900 GeV) = 1.23 GeV/,
( =1.8 TeV most central) = 7.61 GeV/,
( =1.8 TeV most peripheral) = 0.77 GeV/,
(p+p =17 GeV) = 0.42 GeV/,
( =91 GeV) = 1.84 GeV/,
The initial energy density has been estimated by experimenters for some reactions shown here, using an other method (), namely the Bjorken formula (equation 13) and the measured transverse energy :
| (15) |
(method ())
where E is the total energy measured with e.g. calorimeters and is the angle to the incident beam direction. The resulting values, (used in figures 1, 2 and 5 in the following section), are:
(Pb+Pb =17 GeV) = 3.2 GeV/ [43]333The first three values here are valid for head-on collisions [43].,
(Au+Au =4.9 GeV) = 1.3 GeV/ [45],
(Si+Au =5.4 GeV) = 0.9 GeV/ (see [12] and references therein).
We estimate the maximal initial energy density with a third method (), taking the nuclear energy density of two overlapping nuclei 2 times the factor of the colliding particles in the center of mass minus one:
| (16) |
(method ())
with , and =0.179 GeV/fm3 for small nuclei and =0.138 GeV/fm3 for large nuclei is the normal nuclear matter density. The value in equation 16 multiplied by the stopping power gives an estimate of the initial energy density.
We apply this method to the Si+Au and Au+Au collisions at 5 GeV, Ni+Ni collisions at =2.6 GeV, and Pb+Pb collisions at =17 GeV, to calculate the maximal achieved initial energy density, yielding:
(Au+Au =4.9 GeV) = 0.44 GeV/,
(Si+Au =5.4 GeV) = 0.67 GeV/,
(Ni+Ni =2.6 GeV) = 0.276 GeV/,
(Pb+Pb =17 GeV) = 2.25 GeV/.
Few comments:
-
1.
A problem with method () is, that in general it underestimates slightly the , since not all particles are taken into account.
-
2.
A general problem is with equation 15 of method (): For particles produced near midrapidity is approximately not , for , whereas is approximately for particles moving nonrelativistically in the lab frame.
-
3.
A problem with method () is, that it assumes geometrical and not dynamical compression, possibly slightly underestimating the .
-
4.
The methods () and ) should in principle give similar results. Our (method ()) agrees well with the calorimetric estimation of NA35 for S+S at =19 GeV and of NA49 for Pb+Pb at =17 GeV [44, 43], for the 5% centrality trigger. We compare to (Pb+Pb) 0.77 3.2 GeV/= 2.46 GeV/, with 0.77 = (head on collisions) from [43]. This correction is needed because the =3.2 GeV/ is estimated for head on collisions, while our calculation uses and d/dy’s taken with the 5% centrality trigger.
Additionally, also method (), - and therefore all three methods (), () and ()-, give similar results for Pb+Pb collisions at =17 GeV. -
5.
We find however different values for the low reactions Si+Au and Au+Au at 5.4 and 4.9 GeV, for each one of the above methods with a scatter of a factor of two or more. Also the maximal estimated with method () is lower than the results from methods () and (). We therefore conclude that the Bjorken estimate may not be adequate for low energy reactions. This estimate was not meant to be used in the nonrelativistic regime. The method () seems more adequate for these systems. Nevertheless we show two distinct cases in the following figures.
Using method () the is slightly higher for Si+Au at 5.4 GeV than for Au+Au at 4.9 GeV , unlike the results of methods () and (). The stopping power which is missing in the equation 16, can however hardly be very different for these two reactions, but may have an influence on the ordering of the in the above two reactions.
Systematic error estimation summary Comparing results from methods () and () we estimate the systematic error in Si+Au and Au+Au collisions at =5.4 and 4.9 GeV to be about 50%, mainly resulting from the difficulty in applying the Bjorken formula. For the higher energy nucleus+nucleus collisions the systematic error is smaller 30% [11] resulting from the estimation of . The systematic error for is about 50%, resulting from uncertainties in the transverse area definition. The systematic error for colllisions at =900 GeV results from the definition and the extrapolation to midrapidity and is estimated to be about 50% . For collisions at the Tevatron, the uncertainty comes mainly from not taking all particles into account with method () and is about 30%. The systematic error on the estimate for Ni+Ni at =2.6 GeV is 50%, resulting from comparison of our value to model calculations [46].
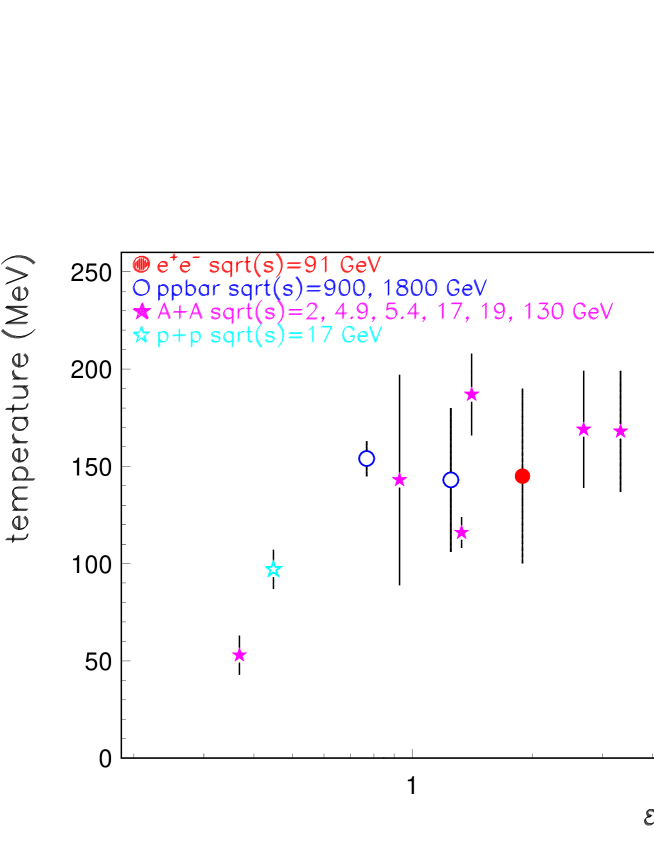
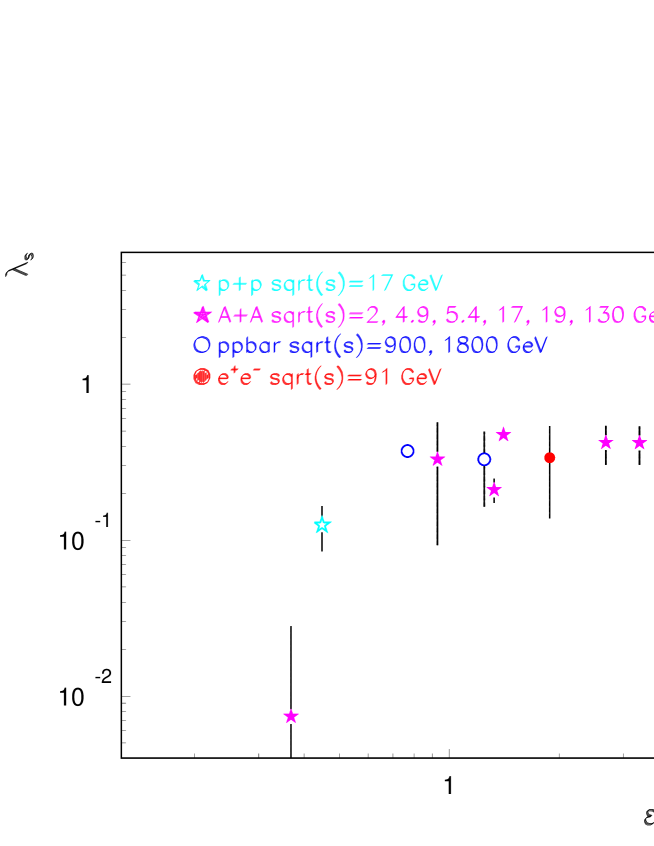
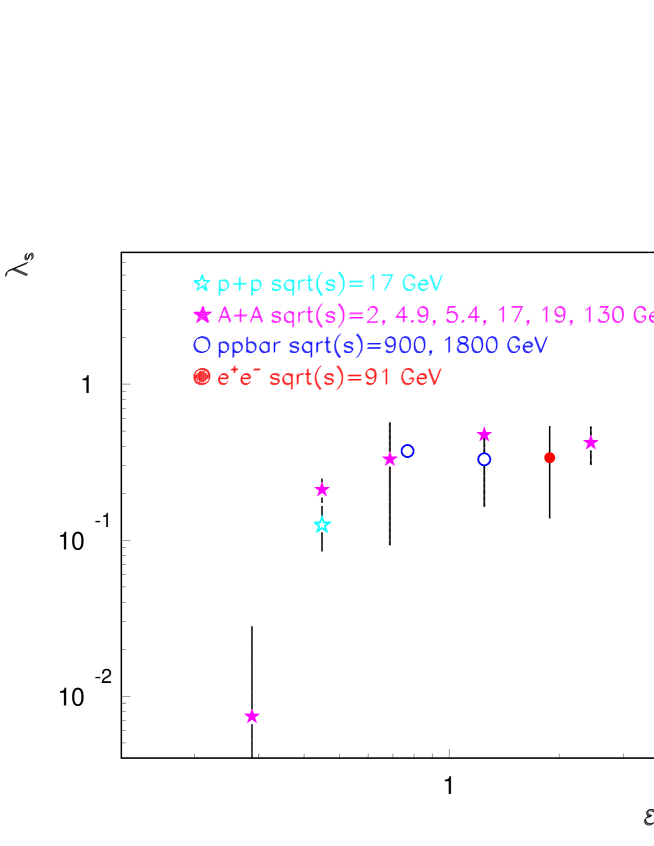
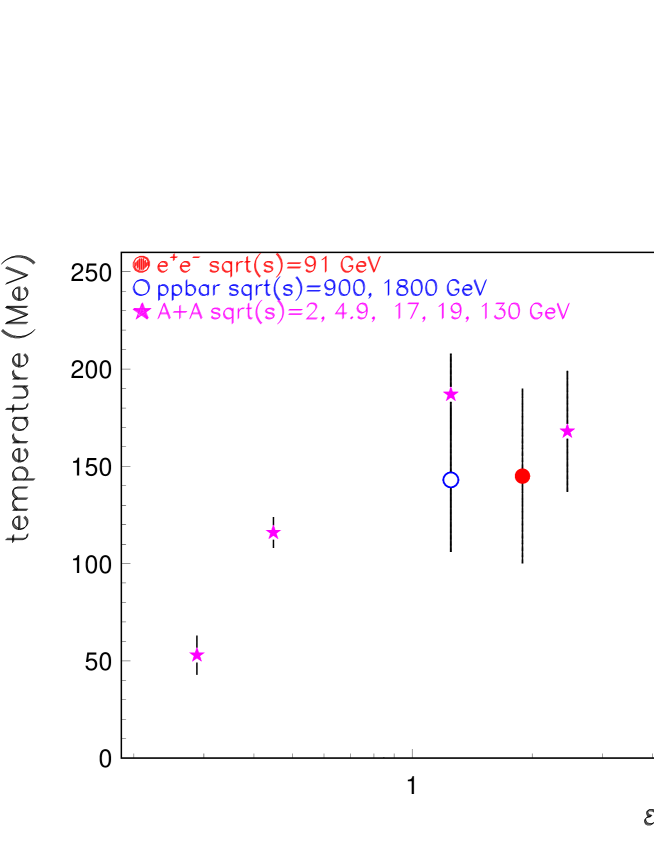
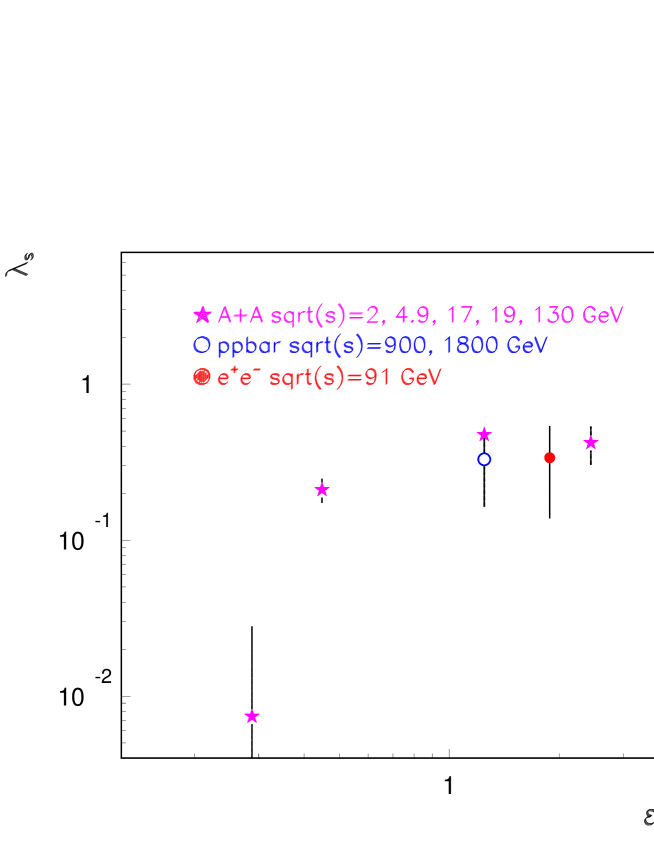
3.5 The combined results: T, at zero fugacities
Figures 2 and 3 show the resulting temperature and the factor extrapolated to zero fugacities along isentropic paths, as a function of the initial energy density. The latter is taken from the experimentally measured transverse energy, when available, that is, for Si+Au =5.4 GeV, Au+Au =4.9 GeV, S+S =19 GeV, S+A =19 GeV and Pb+Pb =17 GeV. For the remaining colliding systems, where no initial energy density estimation is available, we use our method () based on equation 14, exept for the Ni+Ni system where we use the method (). The fact that the initial energy density estimation in figures 2 and 3, was not done with the same method, introduces an additional systematic error on the scale. To reduce this uncertainty and show the systematic error of the initial energy density estimation we use in the following the estimated for 1.) high (10 GeV) by equations 13 and 14, and for 2.) low (10 GeV) by equation 16.
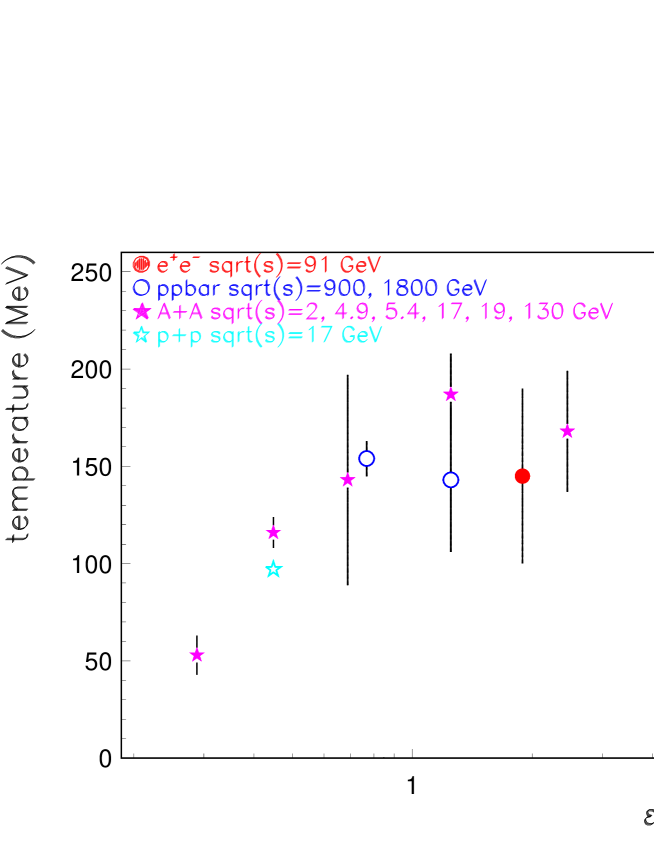
Figures 4 and 5 show therefore the temperature and the factor again, extrapolated to zero fugacities along isentropic paths, as a function of the initial energy density, with a different estimation of the latter. In particular, the initial energy density is not taken from the experimentally measured transverse energy, but is estimated using our method () based on equation 14, with the exeption of the data at low ( GeV), that is, for Ni+Ni at =2.6 GeV, Si+Au at =5.4 GeV and Au+Au at =4.9 GeV, where we used equation 16, which as discussed in the previous section, seems more adequate for the low energies as the Bjorken estimate.
Figure 8 (a) shows the number density of kaons as a function of the initial energy density from reference [12], while in figure 8 (b) the temperature extrapolated to zero fugacities along isentropic paths, is shown as a function of the initial energy density. In figure 8 (a), the collision systems p+p at =17 GeV, S+S at =19 GeV, Pb+Pb at =17 GeV, Au+Au at =4.9 GeV and Si+Au at =5.4 GeV are shown. In figure 8 (b) all the above reactions are shown and additionally the remaining analysed heavy ion collisions in the last section, namely S+A at =19 GeV, Au+Au at =130 GeV and Ni+Ni at =2.6 GeV. The initial energy density of the common reactions displayed in figures 8 (a) and (b), -that is, of all reactions shown in 8 (a)-, is defined in the same way, to allow their direct comparison. In particular, the initial energy densities for all heavy ion systems is taken from the experimental calorimetric measurements (method above) when these are available. For Au+Au at =130 GeV we use our estimate with method (). For p+p at =17 GeV we used the estimate from reference [12] of
(p+p at =17 GeV) from [12]=0.85 GeV/fm3
This is found in [12] by a) estimating the dependence of the for Pb+Pb collisions at =17 GeV on the number of participant nucleons N and b) extrapolating this function to N=2.
The rise and subsequent saturation seen in the kaon number density below and above =1.3 GeV/fm3 (figure 8 (a)), shows a clear relation to the same behaviour seen in the temperature (figure 8 (b)) as a function of the initial energy density.
It is apparent from figures 2, 3, 4, 5, 8 and the present discussion, that a precise calculation of the critical energy density affecting all figures (2-8), needs more experimental data in the region around 1 GeV/fm3. The errors on the temperature (figures 2, 4) are large around this region. An other uncertainty arises from the determination of the initial energy density especially at low where the Bjorken estimate may not be adequate. Our best estimate of the initial energy density, is shown in figures 4, 5, 6, 7. In figures 2, 3, 4, 5,8 we show results demanding a confidence level greater than 1%. In figures 6 and 7 we show the results demanding a confidence level greater than 10%.

4 Conclusions
We have discussed in section 2 the dependence of the critical temperature in the QCD phase transition on the vacuum pressure including in addition modes of noninteracting hadron resonances for u,d,s flavors of light quarks as defining the hadronic phase. Equating the pressure of this hadronic phase to the pressure of the plasma phase, represented by noninteracting u,d,s quarks and antiquarks and gluons as shown in figure 1, we obtain for zero fugacities .
We have performed a thermal analysis of yields in multiparticle production for 13 reactions summarized in table 21 and discussed in detail in section 3. The intensive thermal parameters ( temperature and baryon as well as strangeness fugacity ) together with an error estimate are used to extrapolate the state associated with the chemical freeze-out of each reaction, studied along curves of equal entropy- , energy- and number-density, to zero fugacities.
We represent the so obtained states by two intensive parameters
and ,
i.e. temperature and the ratio of antistrange to nonstrange (valence) antiquark abundances. These two quantities as functions of the initial hadronic energy density achieved in each reactions are displayed in figures 2 - 5. The initial energy densities are estimated in subsection 3.4. The resulting error (horizontal error in figures 2 - 8) is of the order of 50% around , for the collisions at =91 GeV and for collisions at =900 GeV, and approximately 30% at higher .
The reactions with an estimated confidence level above 10% were retained, which fall within the errors into two groups :
-
group I with
-
1.
central Au+Au collisions at RHIC
-
2.
central Pb+Pb collisions at
-
3.
central S+A (A=Pb,Au,W) collisions
-
4.
central S+S collisions at
-
5.
+ collisions at LEP
-
6.
collisions at
-
7.
central collisions at
-
1.
-
group II with
-
8.
central Au+Au collisions at
-
9.
Ni+Ni collisions at GSI
-
8.
Both quantities T and saturate to constant values
| (17) |
above the dividing energy density . Within the errors this is compatible with the critical energy density obtained in lattice QCD [47] as well as with the results on the critical parameters obtained in section 2 ( eq. 12 ). This latter agreement and the extension of the work in [13] to include excited hadronic degrees of freedom is a new result.
This limiting temperature is expected to be somewhat below the critical one, because hadronization is not an instantaneous process. The mean values show a difference in temperature of 40 MeV but the errors mainly due to the approximations of free quasiexcitations and experimental errors are large adding linearly also amount to 40 MeV.
We estimate the systematic error on the limiting , values, fitting the high region of the figures 4, 5 using once a line fit and once a horizontal line fit, varying in both cases the number of bins taken, and estimating the deviations of the mean values resulting from each of the two fits. The error is 20 MeV for the temperature and 0.07 for the .
We interpret this saturation as characteristic for all reactions which before chemical freeze-out have passed through the quark gluon plasma phase, as opposed to those which remained throughout in the hadronic phase.
We note that due to the large errors the dividing line as drawn at is subject to a corresponding uncertainty.
The saturation phenomenon observed here is in our interpretation confirmed by the same phenomenon derived for the kaon number density as a function of the initial energy density by one of us [11, 12] (figure 8).
The agreement of the theoretical thermodynamic model with experimental ratios of identified particle multiplicities is quantified in the errors as discussed in section 3. We emphasize that agreement cannot be perfect due to several obvious and less obvious facts :
-
a ) The rapidity and transverse momentum distributions do not agree with the spherically symmetric distributions in the thermodynamic description.
-
b ) There may well exist kinematically distinct thermal systems, as is indicated by the phenomenon of longitudinal and transverse flow [31].
-
c) The target and projectile diffractive regions may form distinct further thermal subsystems characterized by a different temperature than the particles produced near midrapidity [48].
The results derived here do indicate in our interpretation a high degree of thermalization of the systems studied. This implies the clear indication, that the quark gluon plasma phase is part of the hadronization process characteristic for hadronic, leptonic and nuclear reactions above the critical energy density.
The universal excitation of the quark gluon plasma phase in nuclear and hadronic as well as leptonic multiparticle production is a new result.
The behaviour of strangeness production as reflected by the parameter also reveals a new aspect: the saturation phenomenon corresponds to a strangeness enhancement relative to states with low initial energy density. No ’strangeness enhancement’ is seen for heavy ion collisions relative to hadronic and leptonic reactions, when compared at the same initial energy density and zero fugacities. This enhancement arises only if systems with very different thermal properties in particular different fugacities are compared to one another at the same , therefore at different energy density when nucleus nucleus collisions are compared to elementary particle collisions.
LHC results for central p+p and Au+Au collisions at = 14, 5.5 TeV
will be important for the confirmation of the above picture.
We conclude by proposing further experimentation in the following areas :
-
i ) study of p+ collisions at the Tevatron, with centrality selection on transverse energy, similar to nuclear collisions, and possibly with an improved particle identification option including the fragmentation regions.
-
ii ) in conjunction with i) an extension to compare open and closed c+ production.
-
iii) within the program of heavy ion collisions at RHIC and at the SPS, allready under way, a dedicated study in the neighborhood of = 1 GeV/fm3, e.g. for =(0.6-1.5) GeV/fm3, in nucleus+nucleus, p+A and p+p collisions, using centrality selection.
Acknowledgements
We thank K. Pretzl, W. Ochs, F. Niedermeyer and H. Balsiger for stimulating and fruitfull discussions and critical comments. We thank W. Ochs for very helpful informations concerning jet physics. We thank the members of the theory division of CERN, where part of this work was done, for their hospitality.
References
- [1] Y. Fujimoto and S. Hayakawa, in Encylopedia of physics, vol. 46, no. 2, S. Flügge edt., pp. 115-180, 1967, and references cited therein.
- [2] N. Capdevielle, C. Le Gall, Kh.N. Sanosian, Astropart.Phys. 13 (2000) 259.
- [3] P. Gerber, H. Leutwyler, Nucl.Phys. B321 (1989) 387.
- [4] P. Braun-Munzinger and J. Stachel, Nucl.Phys. A606 (1996) 320-328, nucl-th/9606017.
- [5] F. Becattini, J. Cleymans, A. Keränen, E. Suhonen and K. Redlich, hep-ph/0002267.
- [6] J. Letessier, J. Rafelski, nucl-th/0003014.
- [7] T.S. Biro, P. Levai, J. Zimanyi, hep-ph/9807303.
- [8] F. Becattini, A. Giovannini and S. Lupia, Z.Phys. C72 (1996) 491, hep-ph/9511203.
- [9] P. V. Chliapnikov, Phys.Lett. B462 (1999) 341, Phys. Lett. B470 (1999) 263.
-
[10]
R. Arsenescu et al. (NA52 collaboration), hep-ex/0010045,
Proc. of the V. Int. Conf. on Strangeness in Quark Matter, Berkeley 2
000 (J. of Phys. G),
G. Ambrosini et al. (NA52 collaboration), New J. of Phys. 1 (1999) 22,
S. Kabana et al. (NA52 collaboration), Nucl. Phys. A 661 (1999) 370c. - [11] S. Kabana, hep-ph/0004138.
-
[12]
S. Kabana, Proc. of the V. Int. Conf. on Strangeness in Quark Matter, Berkeley 2000, hep-ph/0010228,
S. Kabana, Proc. of the XXX. Int. Conf. on High Energy Physics, Osaka 2000, hep-ph/0010246. - [13] P. Minkowski, Czech J. Phys. B40 (1990) 1003.
- [14] B.B. Back et al., Phobos coll., hep-ex/0007036.
- [15] T. Ullrich et al., STAR coll., talk given in the Annual Fall Meeting of the Division of Nuclear Physics, Williamsburg, Virginia, Oct 4-7, 2000.
- [16] P. Braun-Munzinger and J. Stachel, nucl-th/9903010.
- [17] P. Braun-Munzinger, J. Stachel, J. P. Wessels and N. Xu, Phys.Lett. B365 (1996) 1, nucl-th/9508020.
-
[18]
J. Bartke et al., Z. Phys. C48 (1990) 191,
J. Bächler et al., Z. Phys. C58 (1993) 367,
T. Alber et al. Z. Phys. C64 (1994) 195. - [19] P. Braun-Munzinger, J. Stachel, J. P. Wessels and N. Xu, Phys.Lett. B344 (1995) 43.
- [20] J. Cleymans and K. Redlich, Phys.Rev. C60 (1999) 054908, nucl-th/9903063.
- [21] D. Pelte et al (FOPI coll.), nucl-ex/9704009.
- [22] P. Senger and H. Ströbele, J.Phys. G25 (1999) R59, nucl-ex/9810007.
- [23] F. Becattini and U. Heinz, Z.Phys. C76 (1997) 269, hep-ph/9702274.
- [24] F. Sikler et al., Na49 coll., Nucl. Phys. A661 (1999) 45.
- [25] H. Bialkowka and W. Retyk, Proc. of the V. Int. Conf. on Strangeness in Quark Matter, Berkeley 2000.
- [26] T. Alexopoulos et al., Phys. Rev. Lett. 64 (1990) 991.
-
[27]
S. Kabana and P. Minkowski,
Phys. Lett. B472 (2000) 155, hep-ph/9907570,
S. Kabana and P. Minkowski, Proceedings of the International Europhysics Conference on High Energy Physics (HEP’99), 15-21 July 1999, Tampere, Finland, (IoP publishing), page 862, hep-ph/9909351. - [28] M. Shifman, A. Vainshtain and V. Zakharov, Nucl. Phys. B147 (1979) 385.
- [29] S. Narison, Nucl. Phys. B509 (1998) 312.
- [30] Proceedings of Quark Matter conferences.
- [31] U. Heinz and B. Jacek, Ann.Rev.Nucl.Part.Sci. 49 (1999) 529, nucl-th/9902020.
- [32] P. Minkowski and W. Ochs, Eur.Phys.J. C9 (1999) 283, hep-ph/9811518.
- [33] J. D. Bjorken, ’Intersections 2000: What’s New in Hadron Physics’, hep-ph/0008048.
- [34] S. Erhan and P. Schlein, Phys.Lett. B481 (2000) 177, hep-ex/9909035.
- [35] U. Heinz and R. Scheibl, Phys.Rev. C59 (1999) 1585, nucl-th/98092.
- [36] R. Rapp and E. Shuryak, hep-ph/0008326.
- [37] J. Letessier and J. Rafelski, Int.J.Mod.Phys. E9 (2000) 107, nucl-th/0003014.
- [38] F. Becattini, Proc. XXXIII Eloisatron Workshop ”Universality features in multihadron production and the leading effect”, October 19-25 1996, Erice (Italy), A. Zichichi edt., hep-ph/9701275.
- [39] Y. Zhan, ’Particle production in high multiplicity events in collisions at = 1.8 TeV’, University of Notre Dame thesis, 1991, unpublished.
- [40] J. D. Bjorken, Phys, Rev. D27 (1983) 140.
- [41] M. Althoff et al., Tasso coll., Z. Phys. C22 (1984) 307.
- [42] P. Abreu et al., (DELPHI coll.), CERN-EP-2000-007.
- [43] S. Margetis et al., (NA49 collaboration), Phys. Rev. Lett. 75 (1995) 3814.
- [44] J. Bächler et al, ( NA35 Collaboration), Z. Phys. C 52 (1991) 239.
- [45] P. Braun-Munzinger, J. Stachel, Nucl. Phys. A 638 (1998) 3, nucl-ex/9803015.
- [46] Ch. Hartnack, PhD. Thesis, University of Frankfurt, GSI-93-05 report, January 1993.
-
[47]
A. Ali Khan et al., CP-PACS collaboration, hep-lat/0008011,
F. Karsch, E. Laermann, A. Peikert, Ch. Schmidt, S. Stickan, hep-lat/0010027. - [48] K. Pretzl et al., (NA52 collaboration), contribution to the ’Symposium on Fundamental Issues in Elementary Matter’, 25 - 29 September 2000, Bad Honnef, Germany.
- [49] F. Abe et al., (CDF coll.), Phys. Rev. D 41 (1990) 2330.