Quest for the dynamics of conversion
Abstract
We perform a quantitative analysis of the capability of K2K, MINOS, OPERA and a neutrino factory in a muon collider to discriminate the standard mass induced vacuum oscillation from the pure decoherence solution to the atmospheric neutrino problem and thereby contribute to unravel the dynamics that governs the observed disappearance.
pacs:
PACS numbers:I Introduction
Two years ago, the Super-Kamiokande (SuperK) atmospheric neutrino data astonished the world giving the first compelling evidence in favor of oscillation [1]. This incredible result has since been confirmed by other atmospheric neutrino experiments [2, 3], as well as by the preliminary K2K disappearance experiment result [4], making unquestionable the fact that neutrinos suffer flavor conversion.
Naively, one may think that proves neutrinos have non-zero mass and that the next challenge for experimentalists is simply to determine the neutrino mass squared differences and the texture of the neutrino mixing matrix. Indeed, if the dynamics of neutrino flavor change is mass induced in the standard way [5], this is obviously the next logical step. Unfortunately, this is not an established fact.
Although the atmospheric neutrino data collected up to now allow one to definite exclude some energy dependencies for the conversion probability [6], some interesting possibilities, such as neutrino decay [7] and pure quantum decoherence [8] are capable of explaining the data comparably well to the standard mass induced oscillation mechanism. This in spite of the fact that the dynamics behind neutrino decay and pure decoherence give rise to a survival probability monotonically decreasing with the neutrino energy while the mass induced mechanism leads to a harmonic probability of oscillation. We therefore believe that another important experimental task should be to unravel the nature of the flavor changing mechanism. We have to point out that the neutrino decay scenario is also mass induced, but throughout this paper when we allude to the mass induced mechanism, we will be referring to the standard neutrino flavor oscillation scenario.
Many, if not all, of the proposed future neutrino long baseline experiments were designed to measure oscillations in order to pin down the oscillation parameters having in mind the standard mass induced oscillation mechanism. It is important to verify their real capabilities to discriminate among different flavor changing dynamics.
The purpose of this paper is to investigate to what extent K2K and the next generation neutrino oscillation experiments will be able to discriminate the mass induced oscillation solution [9] to the atmospheric neutrino problem (ANP), from the recently proposed pure decoherence one [8]. We do not investigate in this paper the decay mechanism, since it implies in the existence of sterile neutrinos, giving rise to a richer phenomenology, this study will be reported elsewhere [10].
The outline of the paper is as follows. In Sec. II, we briefly review the mass induced and the pure decoherence mechanisms of flavor conversion. In Sec. III, we define the statistical significance tests we will use in order to quantify the separation between the two ANP solutions. In Sec. IV, we discuss the power of discrimination of the mass induced oscillation solution to the ANP from the dissipative one at K2K [11], MINOS [12], OPERA [13] and a possible neutrino factory in a muon collider [14]. Finally, in Sec. V, we present our conclusions.
II Review of the Formalism
The time evolution of neutrinos created at a given flavor by weak interactions, as of any quantum state, can be described using the density matrix formalism by the Liouville equation [15]. If we add an extra term to the Liouville equation, quantum states can develop dissipation and irreversibility [15, 16]. The generalized Liouville equation for can then be written as [15]
| (1) |
where the effective hamiltonian is, in vacuum, given by
| (2) |
where , we have already considered ultra-relativistic neutrinos of energy and the irrelevant global phase has been subtracted out. We assume here oscillation only between and in a two generation scheme.
The most general parametrization for contains six real parameters which are not independent if one assumes the complete positivity condition [15]. In one of the simplest situation, which in fact physically arises when the weak coupling limit condition is satisfied, only one of the parameter, , has to be considered. In this limit, Eq. (1) can be solved to calculate the [15]
| (3) |
the probability of finding the neutrino produced in the flavor state in the flavor state after traveling a distance under the influence of quantum dissipation driven by the parameter .
When , we get the usual mass induced oscillation (MIO) probability in two generation. The survival probability, in this case, is the standard one
| (4) |
On the other hand, if neutrinos are massless or degenerate () and weak interaction eigenstates are equal to mass eigenstates, even though standard oscillations cannot occur, flavor conversion can still take place through the pure decoherence mechanism (PDM) [17]. Explicitly, the neutrino flavor change probability, in the simplest case where a single decoherence parameter is considered, becomes
| (5) |
We will assume here for PDM that , where is a constant given in GeV. This Ansatz may be motivated by the assumption that the exponent in Eq. (5) behaves like a scalar under Lorentz transformations [8].
Note that here we will be studying both MIO and PDM in a two generation framework since this is enough to explain well the atmospheric neutrino data. Notwithstanding, one may wonder about the contribution from electron neutrinos. If PDM really takes place in nature, it should in fact involve all three neutrino flavors. We can have some insight on what can happen in this case. From the results of Refs. [17, 18] on the limits on PDM from SN 1987A data, and with the Ansatz above, we expect the decoherence parameter that accompany the conversion to be smaller than GeV. This means that for the energies and distances of the long baseline experiments we will study here, this effect should be completely negligible. Nevertheless, a complete study of the PDM with three neutrino generations should in fact be performed to confirm this assumption.
III Statistical Significance Test
In order to define the capability of an experiment to discriminate mass induced oscillation from pure decoherence, we define the number of standard deviations of separation between MIO and PDM as where
| (6) | |||||
| (7) |
is the confidence level according to the procedure proposed by the Particle Data Book [19]. Here, is the total number of events theoretically expected if PDM is the solution to the ANP and is the total number of events that can be observed by the experiment as a function of the two parameters involved in the MIO mechanism.
For each experiment we have studied, we have computed two different types of contour level curves.
First, we fix , at the number corresponding to GeV, the best-fit point of the PDM solution to the ANP [8] and vary the MIO parameters in the interval eV2 and consistent with the atmospheric neutrino data. In this way, we obtain curves of fixed in the plane .
Second, we fix and vary the PDM parameter in the interval , as well as the MIO parameter in the interval eV2. The upper limit of the range in is the one allowed by the CHORUS/NOMAD data [8, 17], the lower limit was estimated by using GeV, with . Like this, we can get curves of fixed in the plane . This allows us to extend our conclusions beyond the best-fit value of the PDM solution to the ANP.
IV PDM versus MIO
We have investigated the capability of K2K [11, 20, 21] and the next generation neutrino oscillation experiments MINOS [12], OPERA [13, 22] and a neutrino factory in a muon collider [14], to discriminate the PDM solution to the ANP with GeV ***We remark that in our notation corresponds to of Ref. [8]., using the ansatz , given in Ref. [8], from the traditional one due to MIO in vacuum with eV2 and [9]. We recall that the best-fit point for the MIO solution to the ANP is at [9].
We would like to point out that the decoherence solution to the ANP is open to two different readings: either it can be viewed as an effect of pure decoherence or as a combination of quantum decoherence plus vacuum oscillation driven by eV2 with . In the first case, there is a single free parameter () and the flavor change probability is given by Eq. (5), in the second, there are two free parameters ( and ) since the probability will be given by Eq. (3) with .
We now present and discuss the results of our study.
A K2K
In Ref. [8], K2K was cited as a possible experiment to test the novel decoherence solution to the ANP. This possibility would be very appealing for K2K is an experiment which is currently taking data.
In order to verify this, we have calculated the expected number of events in K2K for the goal of the experiment, i.e. protons on target (POT) [4], for three hypotheses: no flavor conversion, mass induced oscillation with parameters consistent with SuperK atmospheric neutrino results [9] and the pure decoherence solution to the ANP [8].
K2K is a disappearance experiment, where the muon neutrinos that have an average energy of 1.4 GeV are produced by the KEK accelerator, first measured after traveling 300 m by the Near Detector, which is a 1 kton water Cherenkov detector, and finally measured by the Far Detector (FD), the SuperK 22.5 kton water Cherenkov detector localized at 250 km from the target. This experiment, which has started taking data last year and has currently accumulated POT, seems to be confirming disappearance as expected by the atmospheric neutrino results [9].
The expected number of events in the FD can be computed as follows
| (8) |
where is the ratio between the number of observed over the number of expected events in the Near Detector, we have used the fact that from Ref. [20], and is the theoretical expectation that can be calculated as
| (9) |
where is the neutrino energy, is the flux distribution at the Far Detector, is the total neutrino interaction cross section taken from Ref. [23] and is the number of active targets in the FD. Also, we have introduced a normalization factor which was fixed to 0.65 in order to get the same expected number of events as K2K for null oscillation. The shape of , was taken from Ref. [11], but the total flux has been renormalized to account for the number quoted in Table 1 of Ref. [20]. The survival probability in two generations, with either equal to zero (for no conversion), to the usual two generation MIO probability (Eq. (4)) or the PDM flavor conversion probability (Eq. (5)).
We first perform the calculation of the total number of expected events, , in the absence of any flavor change and for oscillation with and eV2, eV2 and eV2 for 2.29 POT. These results, which agree quite well with the K2K estimations presented in Ref. [4], are summarized in Table I. Thus we are confident that our numbers are reasonable and we can proceed to estimate the total number of events expected in the FD when K2K reaches POT for vacuum oscillation and decoherence. These numbers are also reported in Table I. From this, we can see that the mass induced oscillation and the decoherence effect at their best-fit values imply, for the goal of the K2K experiment, values for the total number of events which are statistically compatible, hence the two solutions will be indistinct at K2K.
One may wonder about the energy distribution of the K2K events, which, in principle, could be used to discriminate the solutions. We show, in Fig. 1, the Monte Carlo simulated reconstructed neutrino spectrum for one ring -like events at SuperK taken from Ref. [21] for and , as well as our estimation of the distortion expected for the best-fit point of the PDM solution to the ANP. The latter was done simply by multiplying the bin content for no oscillation by the average PDM survival probability in the bin.
From Fig. 1, we see that if one takes into account only the statistic error, completely disregarding the systematic one, the curves are already virtually indistinguishable so that one unfortunately can hardly hope to discriminate between these two solutions with the K2K data. It is important to remark that the actual spectrum is currently under study, so what we present here can be viewed as a tendency which indicates that, even if one compares only the shape for the best-fit values of the two solutions, this type of discrimination will be very difficult in K2K.
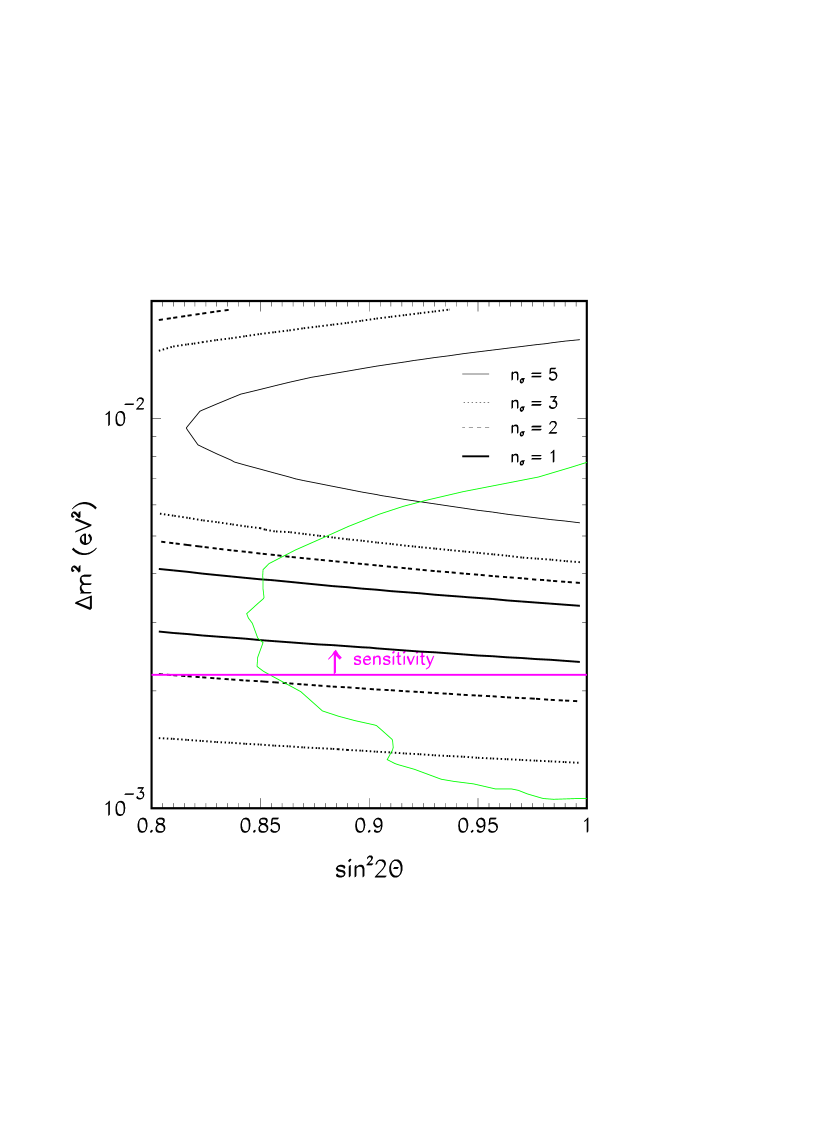
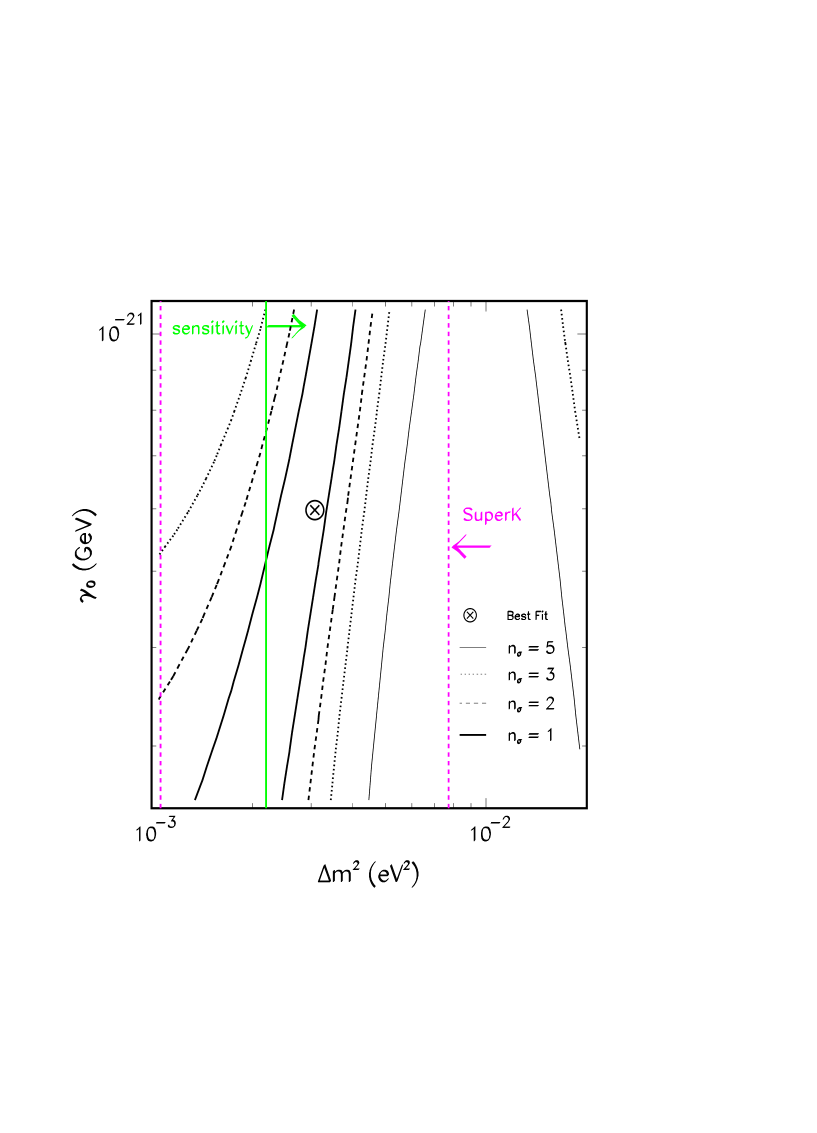
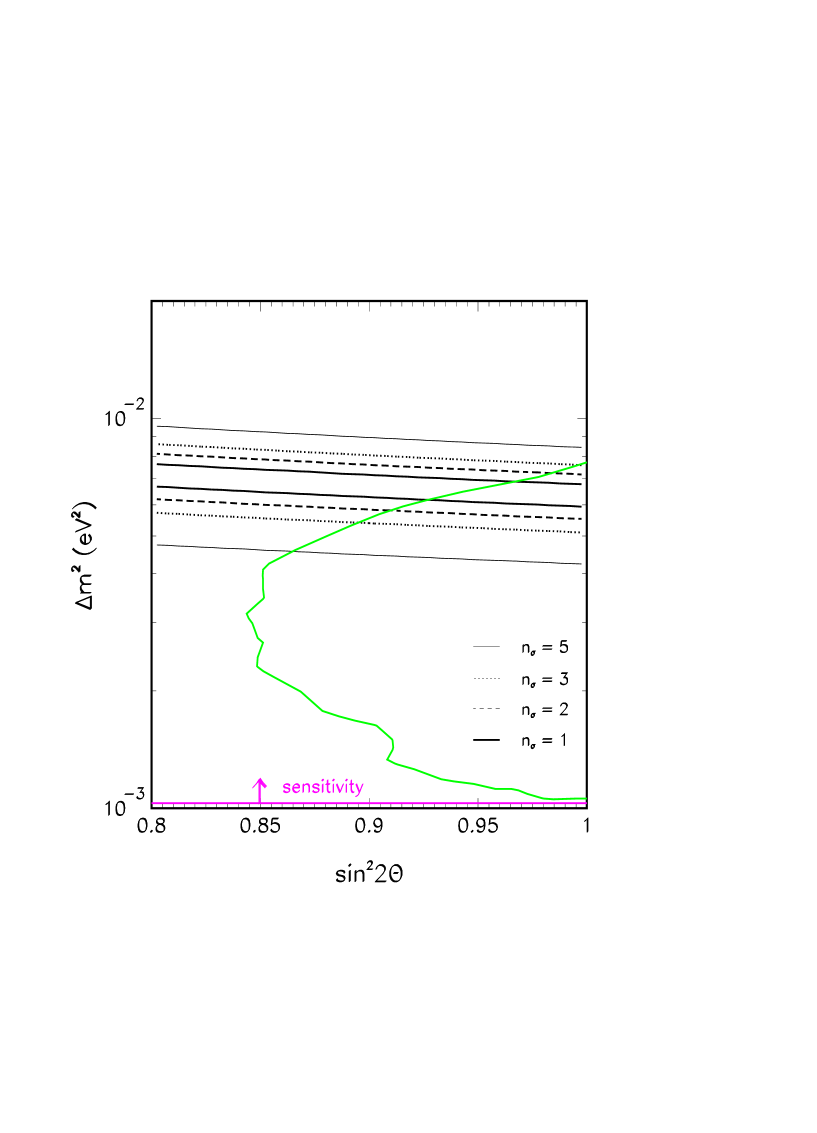
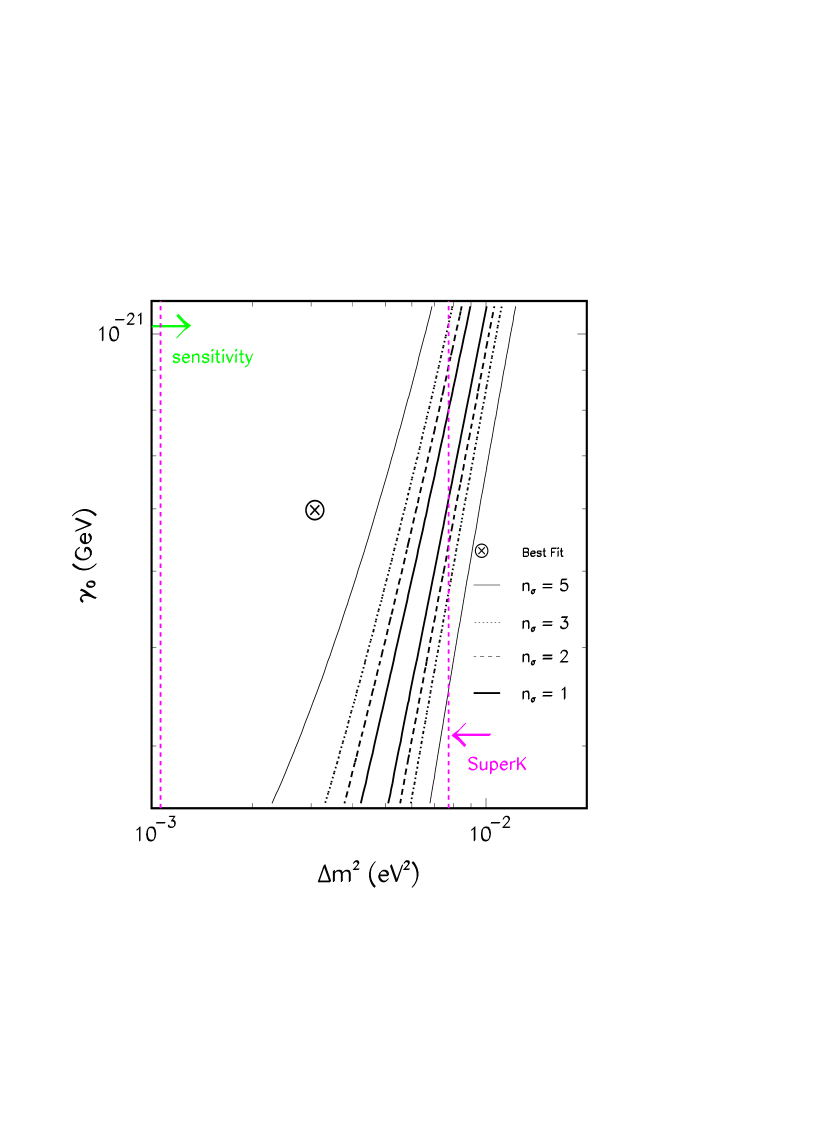
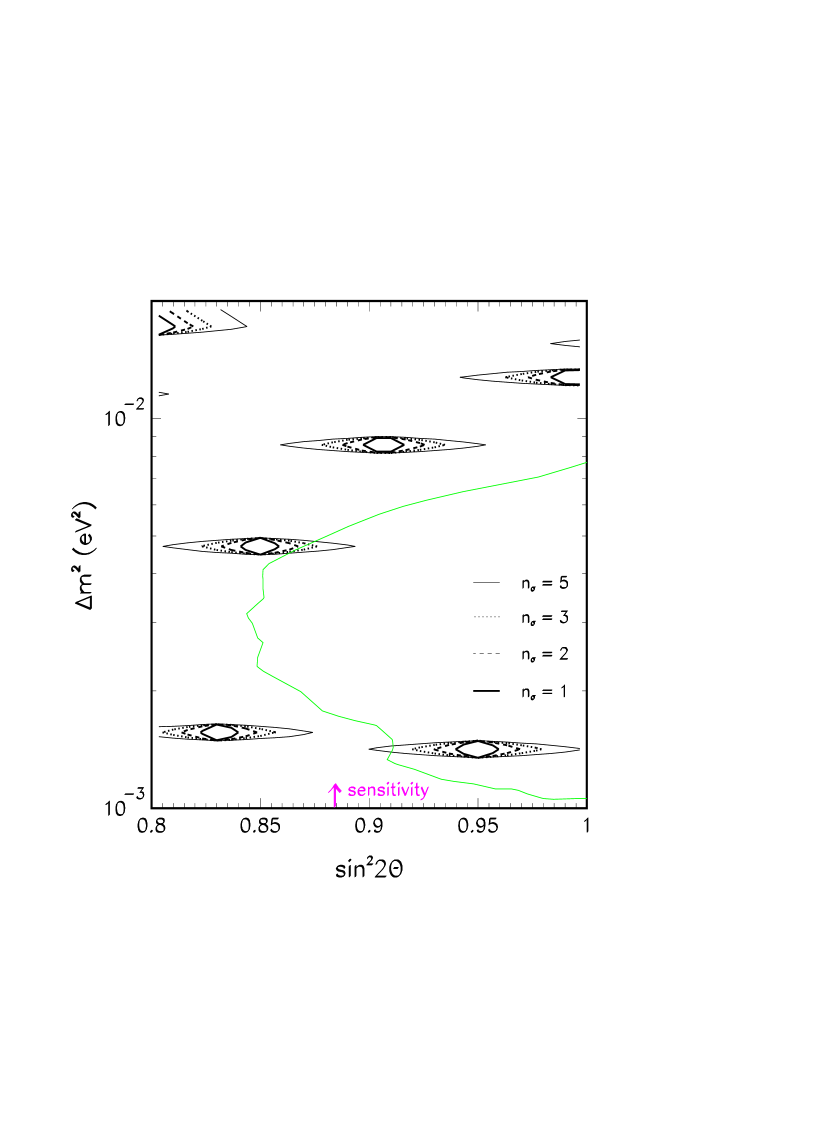
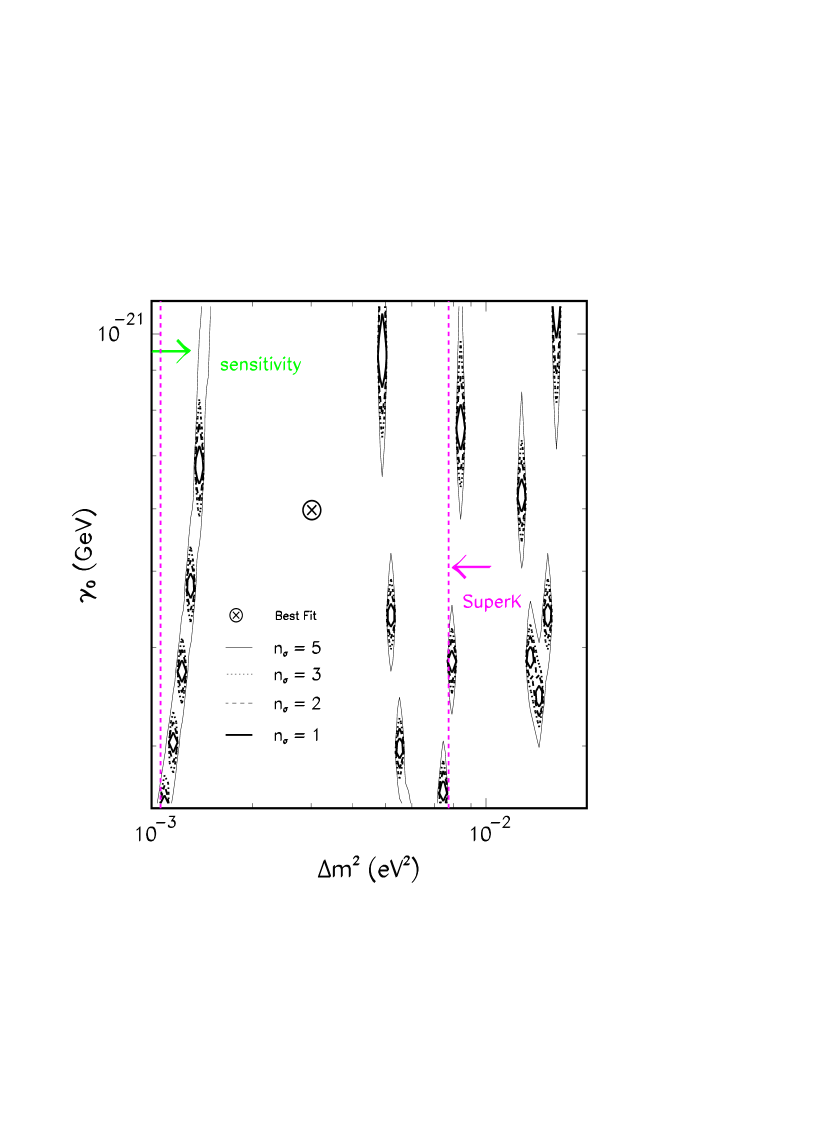
In Figs. 2 and 3, we show the result of the statistical significance tests for K2K, as proposed in Sec. III. These curves were calculated with the total number of events and, although this is not directly related to what is plotted in Fig. 1, it takes us basically to the same conclusion, i.e. for data compatible with the maximal separation between the two solutions cannot exceed 2 if . We see in Fig. 3 that for data consistent with the separation is always less than 3 , . A separation of 5 or more can only be achieved if the data is compatible with . We also see that the point which correspond to the best-fit of the MIO and the PDM solutions is inside the region. Therefore, we conclude that it will be rather difficult to disentangle the two ANP solutions before the arrival of the next generation neutrino experiments.
B MINOS
The MINOS experiment [12] is part of the Fermilab NuMI Project. The neutrinos which constitute the MINOS beam will be the result of the decay of pions and kaons that will be produced by the 120 GeV proton high intensity beam extracted from the Fermilab Main Injector. There will be two MINOS detectors, one located at Fermilab (the near detector) and another located in the Soudan mine in Minnesota, about 732 km away (the far detector of 5.4 kton).
According to Ref. [24], MINOS will be able to measure independently the rates and the energy spectra for muonless () and single muon () events, which are related to the neutral current (nc) and charged current (cc) reactions. Three different neutrino energy regions are possible: low ( GeV), medium ( GeV) and high ( GeV). For MINOS to operate as a appearance experiment either the high or medium energy beam is required, since one must be above the threshold of 3.1 GeV.
We have studied here two different observables that can be measured in MINOS : the -event energy spectrum and the / event ratio. The three different beam possibilities were investigated.
The expected number of -events in MINOS, , can be calculated using [25]
| (10) |
where , is the ratio of the cc-cross section for over the cc-cross section for , is the branching ratio of the tau leptonic decay to muon (18%), is the energy spectrum for cc-events in the MINOS far detector in the case of no flavor change [24] and is the probability of conversion.
There are two different ways a muon can be produced; either by the surviving which interact with the detector (first term of Eq. (10)) or by the contribution from taus generated by interactions in the detector, after conversion, followed by decay (second term of Eq. (10)). In both cases, the events must trigger the detector and be identified as muons to count as -events. Here, we have not considered the possible contamination from neutral current events and the trigger and identification efficiencies were supposed to be 100%.
In Fig. 4, we present the -event energy distribution expected at MINOS for no flavor change and the best-fit parameters of the MIO and of the PDM solutions to the ANP for 10 kton year ( 2 years of running). We can observe that if the final choice of beam is the low energy configuration, MINOS will be in the same footing of K2K, meaning that discrimination between solutions will be extremely disfavored due to low statistics. In the event of the choice fall on the medium or the high energy beam, discrimination will become more likely due to higher statistics.
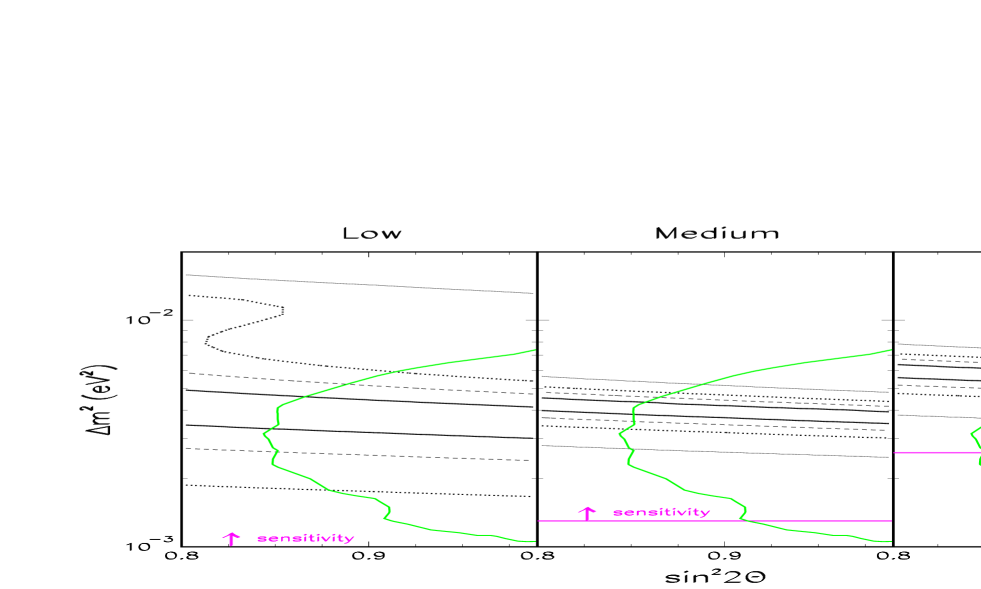
We show in Fig. 5 the result of the statistical significance test in the plane, for the three beam setups. We see that for eV2, PDM and MIO are separated by less than 2 (low), more than 3 (medium) and more than 5 (high), in the range compatible with SuperK atmospheric data, confirming our previous conclusions on Fig. 4.
We can further point out that, considering the 99 % C.L. region allowed by the SuperK data [9], the two solutions will be indistinguishable within 3 for in the low energy configuration, for in the medium energy configuration and for in the high energy configuration.
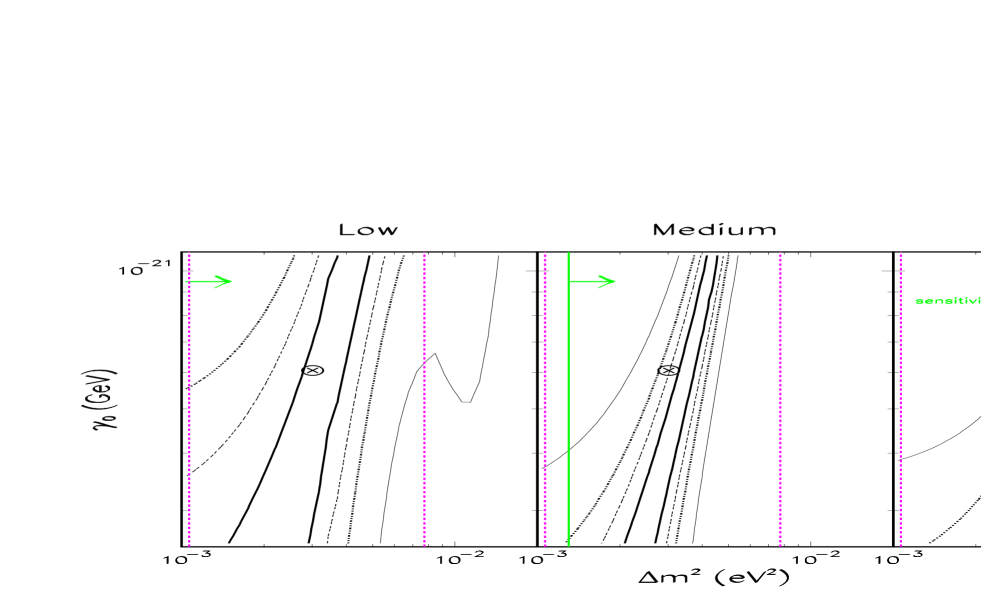
In Fig. 6, we show the statistical significance test in the plane for the three energy possibilities. The point which correspond to the best-fit of the MIO and the PDM solutions is inside the region for low, the region for medium and only for the high energy case it falls into the region. Here it is again demonstrated that the medium and high energy setups are preferable to the low one if the issue is to discriminate the two mechanisms.
We have also computed the ratio that should be expected in MINOS as a function of the free parameters of the flavor changing hypothesis. This ratio has the advantage that it does not require the understanding of the relative fluxes at the near and far detectors, it is also quite sensitive to neutrino flavor conversion since when they occur not only -events are depleted but -events are enhanced. This ratio can be written as [25]
| (11) |
The number of expected -events can be calculated as
| (12) |
where we again supposed no contamination and the trigger and identification efficiencies to be 100%. We can infer , the expected energy spectrum for nc-events in the MINOS far detector in the case of no flavor change, using the approximation
| (13) |
In Table II, we show our estimation of this ratio for no conversion, mass induced oscillation for several values of and PDM with for the medium and high energy beam. For the low energy beam this test is ineffective since, in this case, MINOS will work essentially like a disappearance experiment. For the medium and high energy beams, the ratio predicted for the best-fit values of the parameters of the two solutions seem to be well separated. Nevertheless one has to take these results carefully, in a real experimental situation, experimental efficiencies, event contamination, resolution and systematic errors can substancially affect -event observables.
C CERN-to-Gran Sasso Neutrino Oscillation Experiments
The new CERN neutrino beam to Gran Sasso is a facility that will direct a beam to the Gran Sasso Laboratory in Italy, at 732 km from CERN. Such a beam together with the massive detectors ICANOE/OPERA [22] in Gran Sasso will constitute a powerful tool for long baseline neutrino oscillation searches. The number of protons on target is expected to be 4.5 per year, the beam will have an average energy of 17 GeV, the fractions , and in the beam are expected to be as low as 0.8%, 2% and , respectively [27]. The number of charged current events per protons on target and kton, without neutrino oscillation, is calculated to be , for GeV GeV [27]. These experiments are supposed to start taking data around 2005 and may be used to try to distinguish the two ANP solutions.
We have investigated the capability of these detectors, in particular OPERA, working in the appearance mode, to elucidate which is the correct solution to the ANP. We have obtained the expected number of events, , that will be measured by OPERA, considering a pure beam, using the following expression
| (14) |
where is the flux of at the Gran Sasso detector and is the charged current cross section for , both taken from Ref. [26]. The number of active targets can be calculated as where is the detector mass in kton, is the number of nucleons per kton (where is the Avogadro’s number), is the number of years of data taking and is the number of protons on target per year and is normalization constant that we need to introduce in order to be able to reproduce the numbers presented in Table 27 of Ref. [13]. We have assumed that identification will be accomplished through its one-prong decays into leptons () and hadrons (). We have used the overall value %, admitting a total mass of 2 kton for 5 years of exposure, according to Ref. [13]. The probability is either supposed to be equal to zero (for no flavor transformation), to the MIO probability (Eq. (4)) or to the PDM probability (Eq. (5)).
In Table III, we show the number of events we have calculated, according to Eq. (14), for 5 year exposure, assuming and four different values of and the best-fit point of the decoherence solution to the ANP. We also quote in this table the total number of background events, which remains after all the kinematical cuts have been applied, normalized to an exposure of 5 years, taken from Ref. [13]. We observe that for the decoherence effect the rate of tau events is substantially higher than that of most of the hypotheses and than the number of background events.
We show in Fig. 7 the calculated energy spectrum for both flavor changing scenarios at OPERA for 5 years of exposure, this was calculated using Eq. (14). In spite of the fact that in some cases we observe that the ratio between the number of events coming from PDM and MIO is higher than four, in practice, it seems to be very difficult to observe this difference due to low statistics.
In Fig. 8, we show the result of the first statistical significance test. From this we see that discrimination between PDM and MIO can become difficult if eV2 ().
It is worth mentioning that if we vary the decoherence parameter in the range , the number of expected events also varies from 31 to 114. This suggests that there might be some situations, even if the measured number of events is consistent with eV2, where it might be difficult to disentangle the two ANP solutions in OPERA. This becomes clearer in Fig. 9, where we see that for data compatible with a separation of more than 3 can be achieved for GeV, but data consistent with values of eV2 can only be separated from the PDM solution if GeV ().
D Neutrino Factory in Muon Collider
Many authors [14, 28, 29] have emphasized the advantages of using the straight section of a high intensity muon storage ring to make a neutrino factory. The muons (anti-muons) accelerated to an energy () constitute a pure source of both () and () through their decay () with well known initial flux and energy distribution.
In the many propositions for this type of long baseline neutrino factory one can find in the literature, the stored muon (anti-muon) energy () ranges from 10 GeV to 250 GeV and the neutrino beam is directed towards a faraway detector at a distance corresponding to an oscillation baseline varying from 730 km to 10 000 km.
Here we have explored the neutrino factory as a disappearance experiment. We will explicitly discuss the case when negative muons are stored in the ring, a similar calculation can be performed when positive muons are the ones which decay producing neutrinos. The relevant observable is the total number of that can be detected when is the produced charged lepton in the beam, i.e. the number of “same sign muons” that we will denote here by . We define , for unpolarized muons (see Appendix), as
| (15) | |||||
| (16) |
where is the muon source energy, , is the detector mass in ktons, number of useful decays, is the number of nucleons in a kton and is the mass of the muon. The function contain the energy spectrum normalized to 1 explicitly given in the Appendix. The charged current interaction cross sections per nucleon and can be found in Ref. [26]. This number has two contributions, one from the produced in the decay that survive and arrive at the detector interacting with it producing a final , another from the that is produced by the flavor conversion mechanism and interact in the detector via charge current producing , which subsequently decays to with a branching ratio . We have calculated the above integral from GeV to ensure good detection efficiency [31], so that we can consider the detection efficiency to be 100 %, independent of energy.
The muon beam is expected to have an average angular divergence of the . It was pointed out in Ref. [29] that this effect is about 10 % so we have multiplied our calculated number of events by 0.9 to account for this. The contribution of the background to the number of muons observed in the detector, that includes muons from charm decays produced by charged current and neutral current interactions in the detector, has been neglected on account that this would be a small global contribution.
Since the final configuration of such a facility is still not defined, we have tried to estimate the optimum configuration in order to maximize the difference between mass induced survival probability and pure decoherence. As observed in Ref. [8], at the best-fit point of the MIO and PDM solutions, the argument of the cosine, in the MIO case, and the argument of the exponential, in the PDM case, can be viewed to be approximately the same. Explicitly,
| (17) |
| (18) |
where
| (19) |
with , given in eV2, in GeV and in GeV/km. So that we can maximize the difference between the probabilities simply by finding the values of , which maximize the function
| (20) |
This means that one has to numerically solve for the transcendental equation
| (21) |
with the condition .
Once we find the spectrum of solutions we can apply Eq. (19) to find the optimal distance by choosing a value for and fixing at the average value of the observable neutrino energy, i.e. [30], with GeV/km, the best-fit value of Ref. [8]. We have calculated the maximal difference between the two survival probabilities for GeV and 50 GeV as a function of , but only kept the cases where this difference reaches about 50 %. This was obtained for 3096 km, 6192 km, 9289 km and , 20 GeV and 30 GeV, respectively.
Note that using this criteria, we are looking for a maximum in the absolute difference between the survival probabilities (), which is a very strong condition that we impose in order to detect and distinguish the signal of disappearance. Since this depends on the number of muon decays, which is big, this ensures that the signal will be quite sizable experimentally. We have seen before (see for instance Fig.7), that there are cases of where the absolute difference in the survival probabilities is small while the ratio (PDM)/(MIO) is big, but since the statistics is poor this ratio is an ambiguous observable to establish the difference between PDM and MIO.
Using Eq. (16) we have estimated the neutrino event rate, for the three different hypotheses: no flavor conversion, MIO and PDM.
We addressed a few optimal configurations so that our conclusions may be useful in planning real experimental setups. For each optimal situation, we have performed our calculation for two possible scenarios: (1) a total of decays per year with a detector of 10 kton; (2) a total of decays per year with a detector of 40 kton. Since the event rate is proportional to (see Eq. (16)), the most conservative configuration is the one with km and GeV. Our results are summarized in Table IV. It is clear that one can distinguish among all the studied hypotheses, even in the most modest scenario (1).
An even more conclusive result can be obtained by looking at the energy distribution (see Eq. (31)) for charged current events. We show, in Fig. 10, our predictions, for five years of data taking, assuming 2.0 decays per year, GeV, km for null oscillation, the best-fit point of the PDM solution to the ANP and four different values of which are consistent with the MIO solution to the ANP. We see that in the majority of cases a distinct signal will be observed, making it possible to establish which of the flavor changing hypotheses is the correct one.
Although we have optimized the setup parameters in order to maximize the separation between the two ANP solutions at their best-fit point, we also have checked that even if we allow to vary around the best-fit value, i.e. , we will get an energy spectrum which will always increase monotonically with the neutrino energy, in this range these curves will all coinciding up to 4 GeV, after that if the growth will be slightly slower than what is shown in Fig. 10, for and if the curves will be steeper approaching the one for no flavor change.
In Fig. 11, we show the statistical significance test for 5 years of data taking in the plane assuming the most conservative of the optimal configurations. From this figure, we see that for most of the MIO parameter space the two solutions can be well discriminated. This conclusion is further confirmed by Fig. 12, where the statistical significance test was performed letting vary. Here we note that for data compatible with eV2 a very clear separation is possible . It seems that unless the data prefers lower values of eV2 or a few isolated islands in the plane , in which case a clear separation between the two solutions might be compromised, decoherence and mass induced oscillation will present a very distinct signature of their dynamics. Fortunately, for eV2 and for eV2 a clear cut between the two solutions can be accomplished respectively by the OPERA and the MINOS (medium) experiments, as we have discussed in Sec. IV C and IV B.
V Conclusions
We have discussed the perspectives of future experiments of distinguishing the MIO solution to the ANP from the PDM one. This is specially important since it will be very difficult for NOMAD and CHORUS to achieve a sensitivity in the mode to directly exclude/confirm the latter solution [17].
Our study on discriminating these two ANP solutions permitted us to arrive at the following general conclusions: K2K and probably MINOS will not be able to shed much light on the dynamics which promotes conversion, OPERA and a neutrino factory in a muon collider are more suitable for this job.
From the statistical significance tests we have performed, considering positive discrimination only if , we can say the following. K2K cannot discriminate PDM from MIO if the data is compatible with , . In fact, this almost covers the entire parameter space allowed by the SuperK atmospheric data at 99% C.L., as can be seen in Fig. 2. MINOS, in the low energy beam configuration, cannot separate the two solutions if the data is compatible with , ; in the medium energy beam configuration if , ; in the high energy beam configuration if , . Running with the low energy setup, MINOS will be very similar to K2K, and certainly will not be able do discriminate the solutions, see Figs. 5 and 6. For the high energy setup MINOS will be more selective and similar to OPERA. OPERA, after 5 years, will only not disentangle PDM from MIO if the data is compatible with , . This corresponds to the upper corner of the SuperK 99% C.L. region, see Fig. 8. A neutrino factory with GeV, km and 1.6 decays per year, with a detector of 10 kton after 5 years of data taking will still not be able to discriminate the two solutions if the data prefers a small island in the plane , at eV2 and , see Fig. 11. On the other hand, if the data is compatible with the separation between PDM and MIO will be extremely clear, . This type of facility, it seems, will be the only one able to measure spectral distortions and, thereby, directly test if neutrino flavor change is indeed an oscillation phenomenon.
In any case, the combination of the results of all these proposed experiments will most certainly unravel the dynamics of neutrino conversion in mode, if only active neutrinos exist in nature.
There is a proposed atmospheric neutrino experiment, MONOLITH [32], which, in principle, could distinguish PDM from MIO through the observation of the first oscillation minimum. Here we have only investigated the capabilities of accelerator neutrino experiments which we believe have to be performed in order to completely ratify the mechanism behind neutrino flavor change.
Acknowledgements.
We thank GEFAN for valuable discussions and useful comments. This work was supported by Conselho Nacional de Desenvolvimento Científico e Tecnológico (CNPq) and by Fundação de Amparo à Pesquisa do Estado de São Paulo (FAPESP).REFERENCES
- [1] Super-Kamiokande Collab., Y. Fukuda et al. Phys. Rev. Lett. 81, 1562 (1998).
- [2] W. Anthony Mann for the Soudan-2 Collaboration, hep-ex/0007031.
- [3] F. Ronga for the MACRO Collaboration, Nucl. Phys. B (Proc. Suppl.) 87, 135 (2000).
- [4] M. Sakuda for the K2K Collaboration, talk given at the XXX International Conference on High Energy Physics (ICHEP 2000), Osaka, Japan, July 27-August 2, 2000, transparencies available at http://ichep2000.hep.sci.osaka-u.ac.jp/scan/0728/pa08/sakuda/index.html.
- [5] Z. Maki, M. Nakagawa, and S. Sakata, Prog. Theor. Phys. 28, 870 (1962).
- [6] G. L. Fogli, E. Lisi, A. Marrone, G. Scioscia, Phys. Rev. D 60, 053006 (1999).
- [7] V. Barger, J. G. Learned, S. Pakvasa, T. J. Weiler, Phys. Rev. Lett. 82, 2640 (1999); V. Barger, J. G. Learned, P. Lipari, M. Lusignoli, S. Pakvasa, T. J. Weiler, Phys. Lett. B 462,109 (1999).
- [8] E. Lisi, A. Marrone, and D. Montanino, Phys. Rev. Lett. 85, 1166 (2000).
- [9] H. Sobel for the Super-Kamiokande Collaboration, talk given at the XIX International Conference on Neutrino Physics and Astrophysics (Neutrino 2000), Sudbury, Canada, June 16-21, 2000, transparencies available at http://nu2000.sno.laurentian.ca/H.Sobel/index.html.
- [10] A. M. Gago, O. L. G. Peres, W. J. C. Teves and R. Zukanovich Funchal, work in preparation.
- [11] Y. Oyama for the K2K Collaboration, talk given at the YITP workshop on flavor physics, Kyoto, Japan, January 28-30, 1998, hep-ex/9803014.
- [12] The Minos Collaboration, “Neutrino Oscillation Physics at Fermilab: The NuMI-MINOS Project”, Fermilab Report No. NuMI-L-375 (1998).
- [13] OPERA Collaboration, An appearance experiment to search for oscillation in the CNGS beam, CERN/SPSC 2000-028, SPSC/P318, LNGS P25/2000, July, 2000.
- [14] S. Geer, Phys. Rev. D 57, 6989 (1998); Phys. Rev. D 59, 039903 (1999).
- [15] F. Benatti and R. Floreanini, JHEP 0002, 32 (2000).
- [16] J. Ellis, J. S. Hagelin, D. V. Nanopoulos and M. Srednicki, Nucl. Phys. B 241, 381 (1984).
- [17] A. M. Gago, E. M. Santos, W. J. C. Teves and R. Zukanovich Funchal, Phys. Rev. D 63, 073001 (2001).
- [18] H. V. Klapdor-Kleingrothaus, H. Päs, and U. Sarkar, Eur. Phys. J. A 8, 577 (2000).
- [19] D. E. Groom et al., European Physical Journal C 15, 1 (2000).
- [20] Y. Oyama for the K2K Collaboration, talk given at the XXXVth Rencontres de Moriond “Electroweak interactions and unified theories”, Les Arc, France, March 11-18, 2000, hep-ex/0004015.
- [21] T. Ishida for the K2K Collaboration, hep-ex/0008047.
- [22] A. Rubbia for the ICANOE/OPERA Collaboration, talk given at the XIX International Conference on Neutrino Physics and Astrophysics (Neutrino 2000), Sudbury, Canada, June 16-21, 2000, transparencies available at http://nu2000.sno.laurentian.ca/A.Rubbia/index.html; hep-ex/0008071.
- [23] The charged and neutral current cross sections were taken from M. D. Messier, Ph. D. thesis, Boston University, 1999, available at http://hep.bu.edu/messier/thesis.
- [24] The MINOS Collaboration, P. Adamson et al., Fermilab Report No. NuMI-L-337 (1998).
- [25] The Minos Collaboration, K. R. Langenbach and M. C. Goodman, Fermilab Report No. NuMI-L-75 (1995).
- [26] The charged current cross sections for and can be obtained in form of a table from http://www.cern.ch/NGS.
- [27] ICANOE Collaboration, ICANOE, A proposal for a CERN-GS long baseline and atmospheric neutrino oscillation experiment, INFN/AE-99-17, CERN/SPSC 99-25, SPSC/P314, August, 1999, see http://pcnometh4.cern.ch/publications.html.
- [28] A. De Rujula, M. B. Gavela, and P. Hernandez, Nucl. Phys. B 547, 21 (1999).
- [29] V. Barger, S. Geer, and K. Whisnant, Phys. Rev. D 61, 053004 (2000).
- [30] V. Barger, S. Geer, R. Raja, and K. Whisnant, Phys. Rev. D 62, 013004 (2000).
- [31] M. Freund, M. Lindner, S. T. Petcov, A. Romanino, Nucl. Phys. B 578, 27 (2000).
- [32] K. Hoepfner for the MONOLITH Collaboration, Nucl. Phys. B (Proc. Suppl.) 87, 192 (2000).
| Hypothesis | Number of POT | |
| No Flavor Change | 40.3 | |
| eV2 | 28.3 | |
| eV2 | 18.9 | |
| eV2 | 13.3 | |
| eV2 | 123 | |
| GeV | 122 |
| Medium Energy Beam | |
|---|---|
| Hypothesis | |
| No Flavor Change | |
| eV2 | |
| eV2 | |
| eV2 | |
| eV2 | |
| GeV | |
| High Energy Beam | |
| Hypothesis | |
| No Flavor Change | |
| eV2 | |
| eV2 | |
| eV2 | |
| eV2 | |
| GeV | |
| Hypothesis | |
|---|---|
| eV2 | |
| eV2 | |
| eV2 | |
| eV2 | |
| GeV | |
| Total Background 0.6 events [13] | |
| Hypothesis | (1) | (2) | ||||
|---|---|---|---|---|---|---|
| (km) | ||||||
| (GeV) | ||||||
| No Flavor Change | ||||||
| eV2 | ||||||
| GeV | ||||||


The distribution of in the decay in the muon rest-frame (cm) is given by [14]
| (22) |
, where denotes the neutrino energy, is the angle between the neutrino momentum vector and the muon spin direction, and is the average muon polarization along the beam directions. The functions and are given in Table V.
On applying a Lorentz transformation to boost into the laboratory frame (lab), it is found that the neutrino energy distribution at any polar angle is just scaled by a relativistic boost factor depending on the angle
| (23) |
and
| (24) |
where and are the usual relativistic factors and we have used .
Because in the long-baseline experiments only emitted in the forward direction are relevant to the computed flux, one can make the following approximation: , . Also at high energy . Hence Eq. (23) leads to . Then, we can rewrite in terms of as
| (25) |
Substituting Eq. (25) into Eq. (22), we obtain as a function of the lab variables
| (26) |
which for unpolarized muons simplify to
| (27) |
The number of expected events from interactions with the detector is given by
| (28) |
The flux can be written as
| (29) |
Finally, after t-years
| (31) |