MAXIMUM ENTROPY METHOD AND OSCILLATIONS
IN THE DIFFRACTION CONE
O. Dumbrajs1†, J. Kontros2‡, A. Lengyel2∘
1 Department of Engineering Physics and Mathematics,
Helsinki University of Technology, Rakentajanaukio 2,
FIN-02150 Espoo, Finland
2 Institute of Electron Physics, Universitetska 21,
88000 Uzhgorod, Ukraine
The maximum entropy method has been applied to investigate the oscillating structure in the and elastic scattering differential cross-section at high energy and small momentum transfer. Oscillations satisfying quite realistic reliability criteria have been found.
1 Introduction
The presence of anomalous structure in the differential cross sections was always indicative of some important physical feature typical of the particles and their interactions. Such are the dip-bump structure and ”fine structure” in the differential cross sections related to small and large values of the impact parameter. The first phenomenon is connected with absorption at small impact parameters, while the second one to the mesonic (or quark-antiquark) ”cloud” (or ”tail”) of the colliding particles. In addition to this, localized fluctuations have been observed [1, 2] in the differential cross-section at fixed . The oscillating structure of the diffraction peak in the differential and elastic cross sections has been observed for the first time in [1] in the ISR data [3] and later [2] in UA4/2 [4] experiment by normalizing the differential cross-section to the smoothly varying background in the impact parameter representation. In [5] an attempt was made to relate the observed structure near with the variation of the opacity in space, probably reflecting the density oscillation in matter. The possible existence of oscillations with even smaller periods was discussed by several authors [6, 7, 8]. As pointed out in [2], the Coulomb interference region is essential for the clarification of the presence of these oscillations in and elastic scattering cross sections. The anomalous behaviour observed in the experimental data may be a manifestation of the presence of coherent states in the hadronic matter. In ref. [3] this anomalous behaviour was described by a phenomenological formula and interpreted as an unusual phenomenon giving rise to new physics in hadron diffraction.
The smallness of the relevant periods of oscillations indicates the presence of the long-range forces. Recently in [8] it was suggested that the long-range forces at give a significant contribution to the scattering amplitude and may be responsible for the structure observed in at small . It has been conjectured in [7] that the oscillations of the differential cross-section observed in [4] at are periodic in with the period of which is compatible with the Auberson-Kinoshita-Martin type of oscillations [9].
In ref. [10] we proposed an entirely different method of identifying oscillations in the and elastic scattering. Our method was based on the use of overlapping bins of local slopes and we indicated some characteristic oscillation periods. It is quite obvious that, in order to determine the nature and periods of oscillations, one has first of all to increase the reliability of initial information contained in experimental data by suppressing the influence of statistical fluctuations. This problem can be settled by means of the well known method of maximum entropy [11], used in many branches of physics. For example, recently it has been applied [12] to the electron density profile reconstruction from multichannel microwave interferometer data at the W7-AS fusion experiment.
2 The method of maximum entropy
Consider the mathematical essence of the maximum entropy method. The task is formulated as follows. Provided there are measured data points with errors and no theory available, the question arises of how to choose the most plausible function among all possible functions describing this data set. The philosophy is to choose the solution which contains the least amount of information in order to avoid false features. Mathematically this means that one has to choose such a function that the functional is minimized:
| (1) |
Here is the least squares term which provides the consistency of the function with the data set , is a regularization functional which helps to choose the correct function containing the least amount of information, and is the weighting factor between the least squares term and the regularization functional. The value of has to be chosen such that the data is neither under- nor overestimated, i.e., should be equal to the number of data points . The is calculated by means of the standard formula
| (2) |
It is very important to use realistic error values with methods based on regularization functional, in order to get realistic results. In the maximum entropy method the regularization functional is the configurational entropy of the distribution:
| (3) |
where
| (4) |
- is the -th value of the discretised a priori distribution. The basic principle of the maximum entropy method is that out of all probability distributions which satisfy given constraints, i.e., fits to the data, one should choose the distribution which is closest to the given a priori probability distribution , and, if this is not specified, one should choose the distribution that is closest to the uniform distribution. Here should be pointed out that unknowns are assumed to be independent of each other which means that the distribution does not have to be continuous.
3 Application of the maximum entropy method to the differential cross-section
The question of the role of statistical errors in measured differential cross-section for and scattering at fixed within a broad -interval is of substantial importance, because these errors for each data point may be of the same order of magnitude as the ”fine” anomalies of observed in experiments [3, 4, 13]. The second problem is related to ambiguous use of different models and theoretical predictions [1, 2, 6] in fitting the experimental ”curves”. From the standpoint of the ”observed” oscillations, several methods are now being extensively used. One of the methods is based on theoretical description of smooth and subsequent extraction of oscillations (anomalies) by subtracting the slowly varying ”background” from the experimental differential cross sections. In our new approach we first process the experimental values according to the ”maximum entropy criterion” to obtain
| (5) |
For this purpose we minimize the functional (1), where:
| (6) |
and are experimental errors of . We use the parametrization of from [14] which well describes background to calculate the values needed in (3)
| (7) |
| (8) |
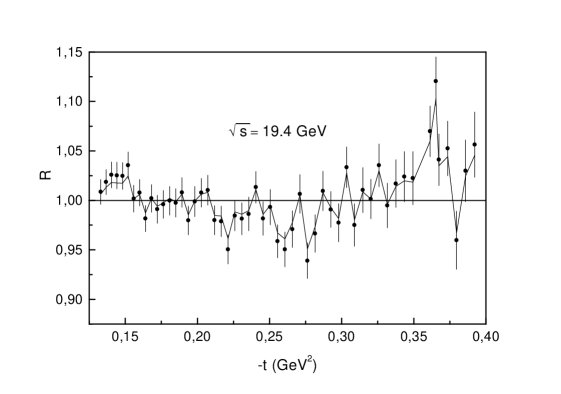
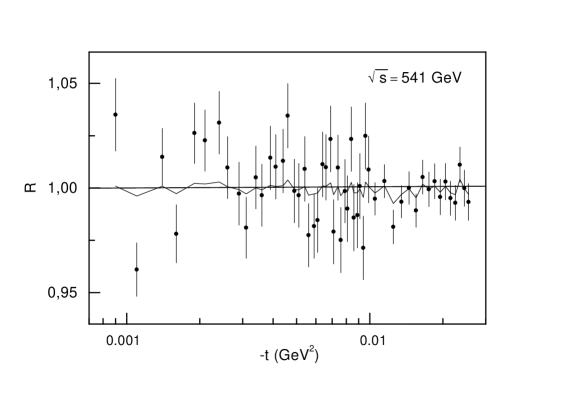
Here , , , and are fitted parameters and is the standard Coulomb amplitude which can be calculated from [15]. We investigate the experimental differential and scattering cross sections at different energies covering a broad interval of from [13] up to [4]. To minimize the functional (1), we used the least-square method described in [16]. The realistic result was obtained when was achieved. Before using the a priori choice of in accordance with (7), we set , assuming that nothing is known about . In this case the use of the maximum entropy method just reproduces the experimental behaviour of with slight changes of the slope. The results of the calculations with the a priori distribution described above are shown in Figures 1-3 for the ratios
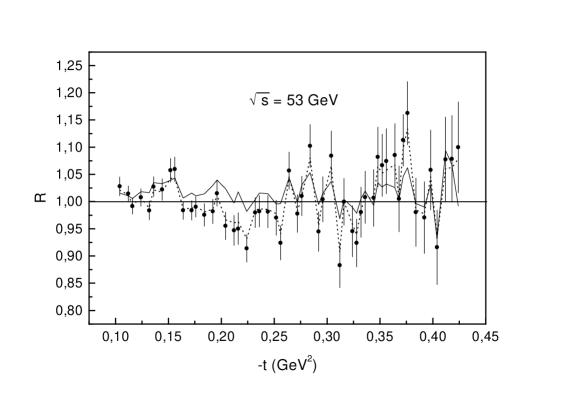
| (9) |
| (10) |
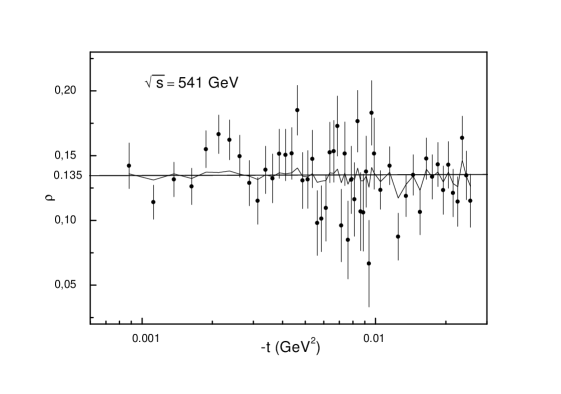
and the relevant errors. Note that in all cases considered (at , , and ) exhibit those non-regularities which are present in albeit with smaller amplitudes. At in spite of the decrease of the amplitude of oscillations, the structure is still visible, especially the local fluctuation at discussed in [5]. In contrast to the first two cases, the data on the differential cross-section at were taken from the region of interference of the Coulomb and nuclear amplitudes used to determine the ratio of the real part of the scattering amplitude to the imaginary part of the scattering amplitude . The maximum entropy method considerably reduces the amplitude of oscillations in . By means of Fourier analysis we find some characteristic periods which generally confirm the calculation of [7, 8]. However, the value of calculated on the basis of data processed by using the maximum entropy method leads to such a drastic decrease of the oscillation amplitude in (see Figure 4), that this gives one almost no chance to obtain the value of which noticeably differs from the experimental value of (compare Figure 3 in [7] and Figure 4 of the present paper).
Finally we made a numerical experiment by artificially reducing three times the experimental errors of the data of [3]. In this case the amplitude of oscillations increased almost by an order of magnitude (Figure 1) which stresses the importance of efforts towards decreasing experimental errors in real measurements.
4 Concluding remarks
We conclude that in all cases analysed the existing data reveal oscillations satisfying quite realistic reliability criteria. Further studies for the small-period structure in at RHIC [17] and LHC (see TOTEM project [18]) are highly desirable. To this end good statistics, including measurements within the entire diffraction cone with a large number points and small errors are necessary.
The authors are grateful to L. L. Jenkovszky for his constant interest in this work. Fruitful discussions with A. V. Snegursky are gratefully acknowledged.
References
- [1] J. N. White Nucl.Phys. B 51 (1973) 23.
- [2] C. Bourrely, J. Soffer, T. T. Wu Phys.Lett. B 313 (1993) 195.
- [3] B. Barbiellini et al Phys.Lett. B 39 (1972) 663.
- [4] C. Augier et al, UA4/2 Collaboration 1993 Phys. Lett. B 316 448.
- [5] A. Arnold, S. Barshay Nuovo Cim. 35A (1976) 457.
- [6] S. Barshay, P. Heiliger Z.Phys. C 64 (1994) 675 and references herein.
- [7] P. Gauron et al Phys. Lett. B 397 (1997) 305.
- [8] E. A. Kuraev, P. Ferro, L. P. Trentadue Possible manifestation of long range forces in high - energy hadron collisions 1997 JINR preprint E2-97-95, Dubna.
- [9] G. Auberson, T. Kinoshita, A. Martin Phys. Rev. D 3 (1971) 3185.
- [10] J. Kontros, A. Lengyel 1995 in Strong Interaction at Low Distances ed. L L Jenkovsky (Hadronic Press Palm Arbor) p. 67.
- [11] Maximum Entropy in Action 1991 (Oxford University Press).
- [12] J. P. T. Koponen, O. Dumbrajs Rev. Sci. Instr. 68 (1997) 4038.
- [13] A. Schiz et al Phys. Rev. D 24 (1981) 26.
- [14] P. Desgrolard Nuovo Cim. 110A (1997) 251.
- [15] G. B. West, D. R. Yenni Phys. Rev. 172 (1968) 1413.
- [16] CERN Computer Center Program Library, D506.
- [17] W. Guryn, R7 Collaboration 1996 in Frontiers in Strong Interactions, VII Blois Workshop on Elastic and Diffractive Scattering, Chateau de Blois, France -June 1995, ed P. Chappettea et al (Editions Frontiers) p. 419.
- [18] M. Buenard, TOTEM Collaboration 1996 in Frontiers in Strong Interactions, VII Blois Workshop on Elastic and Diffractive Scattering, Chateau de Blois, France -June 1995 ed P. Chappettea et al (Editions Frontieres) p. 437.