The interplay between Weak and Strong Phases and
Direct CP Violation
from the Charmless B-meson Decays
Y.F. Zhoua, Y.L. Wua,b, J.N. Ngb,c,
and C.Q. Gengd . Institute of Theoretical Physics, Chinese Academy of
Science, Beijing 100080, China
. National Center for Theoretical Sciences,
P.O. Box 2-131, Hsinchu, Taiwan 300
. TRIUMF, 4004 Wesbrook Mall, Vancouver, BC, Canada V6T 2A3
. Department of Physics, National Tsing Hua University,
Hsinchu, Taiwan 300
Abstract
We present a general analysis on charmless
B-meson decays and . It is noticed that the final
state interactions and inelastic rescattering effects must be significant
in order to understand the consistency of the current data.
By using general isospin decompositions, the isospin amplitudes
and the corresponding strong phases could be extracted from a global
fit of the experimental
data. We emphasize that in general there are two, rather than one, relative
strong phases in the decomposition. In the assumption of two equalstrong phases
as considered in the literature,
the current data , especially the ones concerning decays, will imply a
large isospin amplitude , which is larger by a factor of five
than the one from the naive factorization estimation. When two different strong phases are considered,
all the isospin amplitudes can become, within the -level, comparable with the theoretical
values. We also show that the difference between the two strong phases cannot be too large
and will be restricted by the most recent upper bound of decay.
In any case, the strong phases are found to be large and
the branching ratio of is likely to be enhanced by an order of magnitude
in comparison with the one obtained from the naive factorization approach.
Direct CP violations in all decay modes are also calculated and found to
be close to the sensitivity of the present experiments.
pacs:
PACS 11.30.Er, 12.60.Fr
I introduction
Recently the CLEO collaboration has reported measurements on
the branching ratios of rare hadronic B decays [1, 2].
The data have
attracted great interest from both theorists and experimentalists.
The study of these channels will provide us
important insights on understanding the effects of electroweak penguins
(EWP) in B-system[3],
and the final state interactions(FSI)[4, 5], as well as extracting
the weak CKM phase
[6, 7, 8, 10].
It may also open a window for probing new physics[11].
From the current data, it is noticed that the branching ratio
for is relatively small, (in units of ). The decays for have almost equal decay rates,
i.e., .
While an unexpectedly large branching
ratio for decay was also observed,
.
These measurements seem in conflict with the calculations
based on the naive factorization hypotheses.
For the first three decays, it was pointed out that the factorization
approach may still be valid
if one takes the weak phase to be greater than [8].
With such a large , i.e., , the interference between
tree and penguin diagrams has opposite sign in and decays.
Thus the negative will suppress the decay rate for and enhance that
for . As a consequence, the almost equal decay rates for
and decay modes indicate the dominance of strong penguin.
However, the large rate for
is not easily explained. Most recent analysis showed
that a large final state interaction (FSI) phase would be helpful to enhance the branching ratio
for the decay[4], but only considering the elastic-rescatterings remains
insufficient to obtain the large central value of the data.
To understand the measured data, besides some model-dependent
calculations, a model-independent approach using a single relative strong phase
has also been proposed for the study of
decays[4, 9, 8]. Since the ordinary
factorization approach suffers from the uncertainties due to hadronic
matrix elements, such as
the meson decay constants, B-meson form factors and so-called effective
color number .
The model-independent analyses may be more useful as more data become available.
The approach based on the isospin and approximate flavor
[12] symmetries
of the strong interactions has been proposed to
constrain [13, 14] and extract the weak phase
[7].
It has been noticed that the ratios between the CP-averaged decay rates,
such as may provide us
important information
on the weak phase . Most recently, it has been shown that the
weak phase may
be determined through three ratios among CP-averaged decay rates of , ,
and decays[10].
Where two solutions were obtained at the level,
one with positive and negative ,
i.e., relative small strong phase
and large weak phase , and another with negative and
positive .
The latter with positive seems to be favored by solutions
obtained from other constraints in
the standard model but appears not to be as favorable as the one with
negative studies of all the
existing charmless decays are taken in account. However,
there is still no complete analysis in the
literature.
In this paper, we shall give a general analysis for all 7 decay
modes of and . For that purpose, we will start from a
general model independent parameterization for all the
decay amplitudes by considering both the isospin
and simple diagrammatic decompositions.
We will show that there are in general 15 independent variables.
By assuming the SU(3) relations which appropriately account for
SU(3) symmetry breaking effects,
it allows us to reduce the 15 independent variables into 9.
They consist of 6 isospin amplitudes
and 2 relative strong phase as well as one weak phase .
Note that once the relative strong phase is zero,
only receives contributions from penguin-type diagram and the amplitudes of
the isospin and amplitudes from tree-type diagrams
cancel each other, which provides an additional constraint[8]. In fact,
one of the isospin amplitudes becomes almost irrelevant due to the suppression factor of
the CKM mixing element. With such a consideration, there are only 8 relevant unknown
quantities with 5 isospin amplitudes and 3 phases. We show that the current 6 measured
decay rates allow us to extract 6 unknown quantities as functions of two variable.
The upper bound of the decay rate also provides a bound for the
difference between the two strong phases. Once taking the numerical value of the weak phase
to be the one obtained from other constraints in the standard model and
fixing one of the strong phases, all the other parameters can be determined. With these
determined parameters, we are then able to predict the branching ratio of the
decay mode which is yet unmeasured due to the difficulty of its identification
by the current detector. In addition we also present predictions for direct CP violations
in all 7 decay channels of
. In our numerical fitting, we have adopted the
analysis for the CLEO data in order to have a systematic treatment on the experimental
errors.
In general, according to the Watson theorem, there are two independent relative
strong phases associating with the isospin amplitudes. They are often assumed
to be equal in the literatures[4, 8, 9].
In this work, we shall make a more general analysis with two relative strong phases.
It is shown that the equal phase assumption will result
in large enhancement of isospin amplitude which will be 5 times larger
than the one calculated from the factorization approach. The value of the strong phase is
found to be . These large values may imply large
inelastic FSI or indicate the possible new physics effects. However, if the two strong phases
are different, the value of can be lower and is comparable with the
usual factorization calculations.
It is remarkable to observe that within all the 6 decay rates can be
consistently fitted for a large range of the weak phase for the above two cases. It is also of interest to note that one of isospin amplitudes
and the strong phases have a weak dependence on
the weak phase . Three isospin amplitudes show a moderate dependence
on the weak phase . Only one isospin amplitude is sensitive to
. In particular, the fitting values for the 4 usual isospin amplitudes
considered in most of the literature could still be comparable with the ones obtained
by using naive factorization approach. The resulting large strong phases
may be regarded as a strong indication of large FSI in decays.
II The general framework
We begin with writing the decay amplitude of in the following general form:
(1)
where and
are the products of CKM matrix elements.
The term proportional to has been absorbed into
the above two terms by using the unitarity relation,
.
we also find it useful to adopt the isospin decomposition for the decay amplitudes
(2)
(3)
(4)
(5)
(6)
(7)
with
(8)
Where and are the isospin amplitudes and
and are the strong
phases due to final state interactions. In some literatures the strong phase of isospin amplitude
is assumed to be equal to the one of for simplicity[4, 8, 9].
However, in the most general case, these strong phases are not necessarily the same, since
they arise from the effective Hamiltonian with different isospin.
The subscript denote the isospins of the amplitudes.
The advantage of the isospin decomposition allows one to use relations
including leading order breaking effects. In other words, the isospin amplitudes are assumed to
satisfy the following relations:
(9)
(10)
where and are the meson decay constants with
. For convenience, we define two phase differences as follows:
(11)
(12)
Practically, the decay amplitudes are evaluated by calculating various Feynman diagrams.
In order to see how those isospin amplitudes receive contributions from diagrams,
we also present a simple diagrammatic decomposition. The diagrams can in general be classified
into 6 types denoted by (tree), (color suppressed tree)
(QCD penguin), (electroweak penguin) and (
color suppressed electroweak penguin) [15]:
(13)
(14)
(15)
(16)
(17)
where the primed and unprimed quantities are the amplitudes in
and decays. They roughly differ by a factor
when the flavor symmetry breaking effects are considered.
Combining the two decompositions, it is straight forward to get the following relations:
(18)
(19)
From the above equations, one may easily see the relative magnitudes among those
invariant amplitudes. If the inelastic rescattering effects are small,
will only contribute to the term proportional to . Therefore
one may expect that . This will lead to
. Since receives contributions
from QCD penguins, while only gets contributions from EWPs, one may conclude that
.
To obtain relations for the isospin amplitude , one needs to be careful in adopting the
diagrammatic decomposition implied by the naive factorization ansatz. This is because
the resulting relative strong phase is zero in the factorization approach , i.e.,
and . As a consequence,
(20)
(21)
The amplitudes with isospin and from tree-type graphs cancel each other
in Eq.(21).
Thus the total amplitude only receives contributions from penguin diagrams in this case, namely
(22)
If assuming the -quark dominance in the
penguin loops, one finds from eq.(22) that :
(23)
which may be assumed for simplicity to be approximately valid after considering final
state interactions with nonzero strong phases. In the numerical calculations,
we have check that the amplitude
is less important due to the strong suppression of the CKM factor (for instance,
even if taking , the results remain almost unchanged).
With the above analyses, let us provide an intuitive discussion on
how to yield a large branching
ratio for decay by
appropriately choosing the isospin amplitudes. Note the fact that
,
one may roughly estimate the ratio between and
by
neglecting the terms containing the CKM factor
(24)
with . Once neglecting , the
ratio may be
simply given by , which is much smaller than the
central value of the data
. It indicates that to enhance the decay rate of , the isospin
amplitude should not be neglected. Its small value may
provide a sizable contribution
for a large value of . This is because in this case there
exists a
constructive interference between and in
and a destructive interference in . The situation is
quite similar to
the case for a large , which is considered to enhance and
decrease decay rates. From eq.(24), it is easily
seen that
the value of satisfies
(25)
With the above considerations, there are only 8 relevant quantities:
,
which should be constrained by six measured decay rates and one upper bound.
When taking the weak phase as a free parameter, the
rest 6 variables can be determined from 6 equations of eqs.(2-7). As
the errors in the current data remain considerable large, one may not
take the central values
of the data to be too serious. Thus by only using the central values of
the data to determine the
6 variables may not be good enough. To take into account the experimental
errors in a systematic way,
we shall adopt a global ( least square) analysis for the present
data. This treatment allows us
to obtain not only the central value but also the errors for the fitting
amplitudes.
Our fitting will be carried out by using the standard analysis
program package
MINUIT[16].
III Results and discussions
In order to compare with the values estimated from the factorization, it is
necessary to explicitly see how large of the isospin amplitudes
and from the factorization calculations, we present the relevant formulae for
the decay amplitudes with the assumption of factorization[18]:
(26)
(28)
(30)
(31)
where and are the decay constants and -meson
form factors respectively, and . In the flavor limit, one has
.
The expressions of the isospin amplitudes can be rewritten as follows:
(32)
(34)
(35)
(37)
(38)
(39)
(40)
(41)
and
(42)
(43)
where and
.
In our numerical estimates, we will take MeV,
MeV, and
There remains a large uncertainty in strange quark mass
. For
MeV, we find that the numerical values of those
amplitudes
are given by
(44)
(45)
(46)
The results from the -fitting are shown in Fig.1-3,
where the six amplitudes as well as their errors at 1 level are obtained
as functions of the weak phase with fixed at respectively.
The relative magnitudes of the amplitudes are consistent with the previous discussions.
In our fit, the minimum value of is found to be extremly low
( typiclly ). This means that the -fits
are highly consistent and the 6 amplitudes are actually extracted as the solutions of Eqs.2-8.
It can be seen from the figures that the dependence of is
quite strong and the one of and is relatively weak. On the
other hand, it may be used to extract the angle once one of those amplitudes
can be determined or calculated in other independent ways. It is of interest to see that
the dependence of the amplitude and the strong phase
is weak, which shows that these two quantities are approximately fixed.
The possibility of large was also suggested in Ref.[4] to explain
the large branching ratio of the decay. Recently, perturbative QCD
calculations have also shown a large strong phase[17].
In Fig.1 where the phase difference is set to be zero as usual,
the -fitting shows that the values of and may be comparable
with the ones from the theoretical estimations. only when the weak phase is large.
Especially for , the fitting values could coincide with the ones from
factorization except for . For , the two amplitudes are smaller than
the ones from naive factorization calculations. It appears that the factorization approach may
become suitable for large weak phase . This phenomenon was observed
by most of the analyses in the literature which neglects the isospin amplitude .
As a consequence, the resulting large value of seems to be
conflict with the one obtained from other constraints in the standard model.
Before drawing the final conclusion, one also notice that in the factorization approach,
one yields a zero strong phase which actually contradicts with the general
fitting value . Therefore, the results of estimates
based on the naive factorization approach should be unreliable, and the
isospin amplitudes must receive additional large contributions. A large
value for the relative strong phase implies
that the final state interactions or inelastic rescattering effects must
be significant.
We would like to stress that the most outstanding feature of the
analysis with is that
the isospin amplitude is likely to be relatively larger than
the one estimated from the naive factorization calculations. The fitting central value
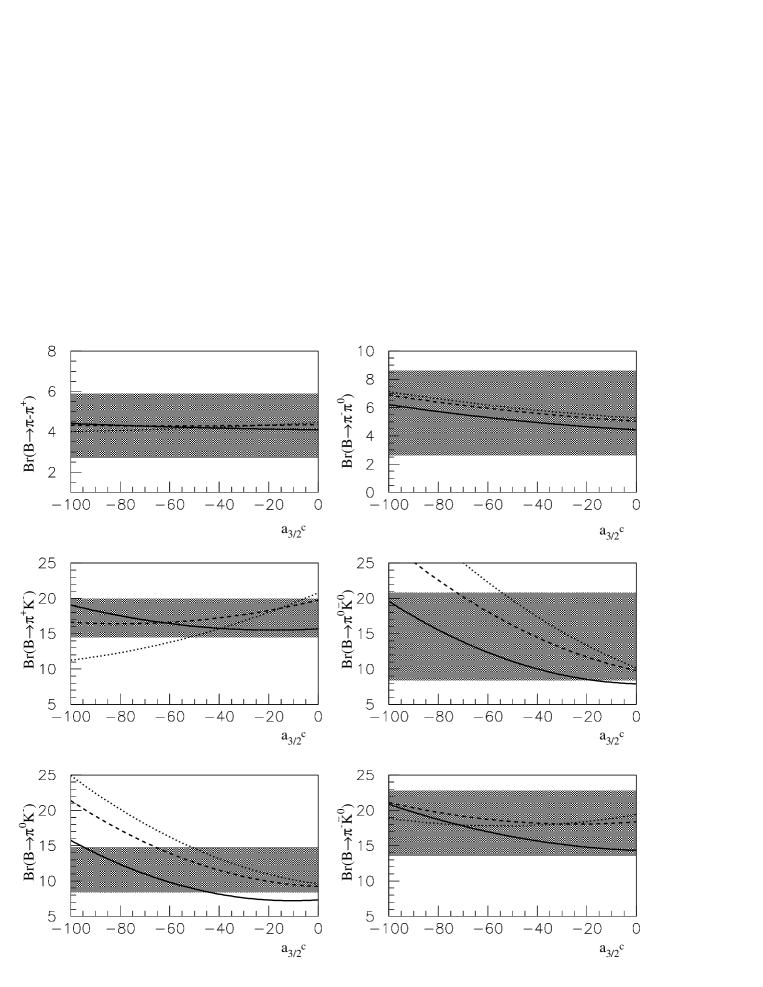
of may be larger by a factor of . To explicitly see how
the decay rates depend on the isospin amplitude , we plot
in Fig.4 the 6 branching ratios of decays
as functions of .
It can be clearly seen that if , a small value of
is not able to reproduce all the CLEO data within the
level, especially the data for the channels
of and . To consistently describe the whole data,
we need a relative large value for fitting the central value of the data
which is about of the largest one .
Within the standard model, it seems difficult to enhance the isospin
amplitude by an order of magnitude even the inelastic FSI is
involved, this is because the main inelastic channels such as ,
only contribute to isospin- part of the decay amplitude.
In the SM, it is known that
the ratio can be
determined without the hadronic uncertainties in the flavor limit, this is because
the ratio only depends on the short distance Wilson coefficients[19]. Thus
a large value of may indicate the existence of new
physics. While all models beyond the standard model must effectively provide large contributions to the
electroweak penguins in order to enhance the isospin amplitude ,
such models are: SUSY with R parity violation, -model and
-mediated FCNC models, et. al.
Let us now consider the case that is non-zero, the situation then becomes
quite different. In Fig.2 and Fig.3, it is seen
that decreases as the value of increases. When
reaches , will be consistent with the value yielded from
factorization approach. It is also noticed from the figures that a large leads to
large values of and . The enhancement of may
be easily understood than the enhancement of due to final state interactions.
Nevertheless, as will be discussed below, the values of cannot be too large
due to the constraint of the upper bound of the branching ratio of .
When all the isospin amplitudes and strong phases are determined, one is
able to predict the direct CP asymmetries for all the relevant decay
channels. The direct CP asymmetry in decays is defined in the
standard way
(47)
where denotes the final state mesons. In Fig.5 we plot
several ’s as functions of the weak phase with different value
of . When is near and one has
which is in a good agreement with the most recent CLEO data
[2]. At this point, we have a reliable prediction
for the direct CP violations in the following decay modes. The ’s with
read
(48)
(49)
(50)
for , and
(51)
(52)
(53)
for .
In spite of the large , the smallness of CP asymmetries in
decay is due to the absence
of the interference between tree and penguin diagrams.
There remains an unobserved decay mode in decays,
which is the decay mode ( the CLEO collaboration has already reported the
indication of ). As all the relevant isospin amplitudes have
been determined as functions of , it allows us to predict as a
function of . It is interesting to note that our -analysis shows that the
resulting branching ratio is almost independent of the weak phase .
Its value at is close to the one of decay
(54)
with increasing, the branching ratio becomes larger and can reach
when . Such a large branching ratio is about an order of magnitude larger
than the prediction based on factorization calculations. Most recently, the CLEO collaboration
reported an upper bound of [21],
this will impose a strong constraint on the value of (see Fig. 6). It is seen that
to be consistent with the data at the level, the upper bound of
the branching ratio limits to be less than .
IV conclusions
In summary, we have made a general less model-dependent
investigation on the charmless B-meson decays by using the analysis
based on the most recent CLEO data. We have used the most general isospin decomposition
with two independent strong phases. All the isospin amplitudes in rare hadronic
decays can be determined as functions of the weak phase
and one strong phase .
The effects of two equal and unequal strong phases are studied in detail.
It is found that
the isospin amplitude and the strong phase only slightly depend on
the phase .
An important observation under the equal strong phase assumption
is the relative large isospin amplitude ,
where the central value is about 5 times greater than the
one obtained from the factorization calculations. When the two strong phases are
not equal, the allowed values of decrease as their difference, i.e., ,
increases. For the most general case with two rather than one large FSI strong phases, the magnitude of
all the isospin amplitudes may be around the one estimated from the factorization approach.
Nevertheless, one needs to find out the mechanism of producing large strong phases. This could directly
be tested by measuring the branching ratio .
The direct CP asymmetries for all the relevant decay channels
have also been given as functions of . The resulting numerical value for
is consistent with the most recent data. When taking to be
in a reasonable range , we are led to the results
given in eqs.(35) and (36), which can be directly tested by experiments in the near future.
A resulting large branching ratio which is comparable with
the one will also provide an important and consistent test.
From the most general analysis presented in this paper, the data appears to
strongly suggest that final state interactions and inelastic rescattering
effects must be significant and play an important rule in the charmless
decays. Otherwise, our general analyses may be interpreted as hinting
at the existence of
new physics. For a more definite conclusion, one needs more precise data.
The two B-factories BaBaR and BELLE are expected to provide us with more information from the charmless
decays.
Acknowledgments:
The author (C.Q.G.) was supported by the NSC under contract
number NSC 89-2112-M-007-013. J.N.N. is partially supported by the Natural Science
and Engineering Council of Canada.
Two of us (Y.L.W. and Y.F.Z.) were supported in part by NSF of China under grant
No. 19625514. Y.L.W acknowledges the CTS for the support during his visit and
he would also like to thank H.Y. Cheng, X.G. He, W.S. Hou and H.N. Li for useful discussions.
REFERENCES
[1] CLEO Collab. hep-ex/0001010.
[2] CLEO Collab. hep-ex/0001009.
[3]G. Kramer, W.F.Palmer Phys. Rev. D52 (1995) 6411.
N. G. Deshpande and X. G. He, Phys. Rev. Lett. 74 (1995) 26.
[4] W. S. Hou and K. C. Yang hep-ph/9911528, to appear in
[5] R. Fleischer, Eur. Phys. J.C6(1999)451.
[6]M. Gronau and J. L. Rosner Phys. Rev. Lett. 73 (1994) 21
M. Gronau and J. L. Rosner Phys. Rev. Lett. 76 (1996) 1200 .
[7] M. Neubert and J. L. Rosner Phys. Rev. Lett. 81 (1998) 5076.
[8] N. G. Deshpande, X. G. He, W. S. Hou and S. Pavaska
Phys. Rev. Lett. 82 (1999) 2240;
X. G. He, W. S. Hou and K. C. Yang Phys. Rev. Lett. 83 (1999) 1100;
W. S. Hou and K. C. Yang hep-ph/9908202 .
[9]T. N. Pham, hep-ph/0009142,
C. Isola, T. N. Pham, hep-ph/9911534.
[10] Y. L. Wu and Y. F. Zhou, Phys. Rev. D62 036007 (2000).
[11] X. G. He, C. L. Hsueh and J. Q. Shi Phys. Rev. Lett. 2000 (84) 18;
Y.L. Wu and Y.F. Zhou, Phys. Rev. D61 096001 (2000).
[12]D. Zppenfeld, Zeit. für Physik C8 (1981) 77;
M. Savage and M. Wise, Phys. Rev. D39 (1989) 3346;
M. Savage and M. Wise, Phys. Rev. D40 (1989) 3127(E);
M. Gronau, O. F. Hernandez, D. London and J. L. Rosner , Phys. Rev. D52 (1995) 6374;
M. Gronau, O. F. Hernandez, D. London and J. L. Rosner , Phys. Rev. D52 (1995) 6356;
X.G. He, Eur. Phys. J. C9 (1999) 443;
M. Gronau and J. L. Rosner Phys. Rev. D61 (2000) 073008.
[13]R. Fleischer and T. Mannel, Phys. Rev. D57 (1998) 2752.
[14]A.J. Buras and R. Fleischer hep-ph/0003323.
[15] M. Gronau and J. L. Rosner Phys. Rev. D61 (2000) 073008.
[16]F.James and M.Roos, 10,343(1975)
CERNLIB-writeup, http://wwwinfo.cern.ch/asdoc/shortwrupsdir/d506/top.html
[17] Y.Y. Keum, H.-N. Li and A.I. Sanda,
Talk given at 28th Intern. Workshop on Gross Properties of Nuclei and Nuclear Excitation:
Hadrons in Dense Matter (HIRSCHEGG 2000), Hirschegg, Austria, 16-22 Jan 2000, hep-ph/0004173.
[18] A. Ali, G. Kramer and C.D. L, Phys. Rev. D58 (1998) 094009.
[19]M.Neubert, J.Rosner, Phys. Lett. B441 (1998) 094009.
[20]D.Hitlin, et al, BaBar collaboration,
plenary talk in ICHeP 2000( Osaka, Japen,July 21,2000), SLAC-PUB-8540.
H.Aihara, Belle collaboration, plenary talk in IC
HeP 2000( Osaka, Japen,July 21,2000),
FIG. 1.: The isospin amplitude fitted as a function of weak
phase from a analysis of the recent CLEO data.
The vertical bars indicate the errors at 1 level. the strong phase
is set to be zero.
FIG. 4.: The dependence of the 6 branching ratios( in units
of , for . The other parameters are at their
central values. The three curves in each plot
correspond to 0(solid), (dashed), (dot-dashed)
The hashed bands indicate the errors(at 1)
of the data.
FIG. 5.: The values of CP asymmetries vs
weak phase with different ( from up to down)
The cures corresponding s for
,,,,
and are indicated in the plot.
FIG. 6.: the branching ratio of (in units of predicted as
function of (in degree). the solid line indicate the
upper bound observed reported by CLEO collaboration.