Anisotropic transverse flow and the quark-hadron phase transition
Abstract
We use (3+1)-dimensional hydrodynamics with exact longitudinal boost-invariance to study the influence of collision centrality and initial energy density on the transverse flow pattern and the angular distributions of particles emitted near midrapidity in ultrarelativistic heavy-ion collisions. We concentrate on radial flow and the elliptic flow coefficient as functions of the impact parameter and of the collision energy. We demonstrate that the finally observed elliptic flow is established earlier in the collision than the observed radial flow and thus probes the equation of state at higher energy densities. We point out that a phase transition from hadronic matter to a color-deconfined quark-gluon plasma leads to non-monotonic behaviour in both beam energy and impact parameter dependences which, if observed, can be used to identify such a phase transition. Our calculations span collision energies from the Brookhaven AGS (Alternating Gradient Synchrotron) to beyond the LHC (Large Hadron Collider); the QGP phase transition signature is predicted between the lowest available SPS (CERN Super Proton Synchrotron) and the highest RHIC (Brookhaven Relativistic Heavy Ion Collider) energies. To optimize the chances for applicability of hydrodynamics we suggest to study the excitation function of flow anisotropies in central uranium-uranium collisions in the side-on-side collision geometry.
CERN-TH/2000-161
hep-ph/0006129
I Introduction
At a given beam energy, the highest energy densities can be reached in central collisions (impact parameter ) between the largest available nuclei. Hence for many years the experimental and theoretical attention has focussed on such collisions. Non-central () collisions are, however, interesting in their own right since they exhibit new phenomena which are forbidden by azimuthal symmetry in central collisions between spherical nuclei. For non-central collisions the directions of the beam axis and the impact parameter define the collision plane, and many interesting physical phenomena are now non-trivial functions of the azimuthal angle relative to the collision plane. These include in particular the transverse geometry of the collision fireball as measured with two-particle Bose-Einstein correlations (see e.g. [1] and references therein) and momentum-space anisotropies in the transverse plane due to anisotropic transverse flow of the fireball matter [2].
Aside from changing the collision energy, limited variations of the energy density of the reaction zone are also possible by varying the collision centrality. Variation of the initial energy density provides the handle for studying phase transitions in nuclear matter, in particular the quark-hadron transition at a critical energy density GeV/fm3 [3]. Non-central collisions between spherical nuclei and/or central collisions between deformed nuclei provide new opportunities to correlate phenomena related to azimuthal anisotropies with the initial energy density. This may yield novel phase transition signatures. In [4] this idea was exploited for the so-called directed flow at forward and backward rapidities: the softening of the equation of state (EOS) in the phase transition region was predicted to lead to a reduction of the directed flow, making the phase transition visible as a minimum in its excitation function. Sorge [5, 6] suggested analogous features for the elliptic flow [7, 8, 9] which were further studied in [10, 11, 12]. The effects of a phase transition on the excitation function of radial flow in central collisions between spherical nuclei had been discussed earlier in [13, 14, 15].
An important difference between the radial flow observed in azimuthally symmetric central collisions and the anisotropic directed and elliptic flows in non-central collisions and/or central collisions between deformed nuclei was pointed out by Sorge in [5]:
1. Directed flow affects mostly particles at forward and backward rapidities which (at energies above a few hundred MeV/nucleon) are deflected away from the beam direction by the pressure built up between the colliding nuclei during the time of their mutual overlap. Since the thus affected particles quickly leave the central region where this transverse pressure force acts, the finally observed directed transverse flow pattern is established very early in the collision. Its natural time scale is given by the transition time of the two colliding nuclei which decreases with increasing beam energy; this causes a decrease at high collision energies (after an initial rise at low beam energies) of the directed flow [2]. This decrease is amplified by a lack of thermalization during the very earliest stages of the collision which prohibits fast enough buildup of transverse pressure and thus eventually invalidates the applicability of hydrodynamic concepts for calculating the directed flow. Such pre-equilibrium features may even cover up [5] the phase transition signal [4] in the excitation function of directed flow.
2. The elliptic flow is strongest near midrapidity [17]. Its driving force is the azimuthal anisotropy of the transverse pressure gradient, caused by the geometric deformation of the reaction region in the transverse plane. As pointed out in [6, 11], elliptic flow acts against its own cause by eliminating the geometric deformation which generates it, thereby shutting itself off after some time. This time is, at least at high energies, longer than the nuclear transition time. Elliptic flow is thus generated later than directed flow, and hydrodynamic concepts for its description may have a larger chance of being valid, even if the spatial deformation which causes elliptic flow exists only for a fraction of the total fireball lifetime. An important focus of this work will be a quantitative determination of the time scale over which elliptic flow is generated, as a function of the collision energy. We will see that this time scale grows with the overall size of the (initially deformed) collision region [8, 9]. Studying central collisions between large deformed nuclei like 238U [18, 19] therefore improves the chances that thermalization happens sufficiently early for a hydrodynamic description of elliptic flow evolution to be valid. Such collisions are the preferred proving ground for hydrodynamic predictions for the excitation function of elliptic flow.
3. Radial flow is generated by the pressure gradient between the interior of the collision fireball and the external vacuum; this force persists throughout the fireball expansion until freeze-out. Of all three transverse flow patterns it thus has the strongest weight at late times. Comparing the excitation functions of elliptic and radial flow with their intrinsically different weights for the EOS at early and late times (i.e. at high and low energy density) may help with the identification of phase transition signatures and their discrimination against possible non-equilibrium effects from incomplete local thermalization. Of course, the final proof for the phase transition to quark matter will require an additional correlation of the here predicted structures in the anisotropic flow pattern with other “quark-gluon plasma signatures” (see [20, 21]).
As already indicated we here study the evolution of transverse flow in a macroscopic hydrodynamic framework (to be contrasted with microscopic kinetic approaches [5, 6, 16]). This approach, which is based on the assumption of rapid local thermalization, allows the most direct connection of observables to the EOS of the hot matter in the collision fireball, including possible phase transitions. Its validity can be tested both experimentally and by comparison with kinetic approaches. We will not do so here (see, for example, Refs. [10, 24]) but rather concentrate on qualitative predictions resulting from the hydrodynamic approach.
Hydrodynamics cannot describe the earliest collision stage of nuclear energy loss and entropy production by thermalization of the energy deposited in the reaction zone by the stopping process; this must be replaced by appropriate initial conditions for the hydrodynamic expansion. The evolution of azimuthally asymmetric reaction zones requires a (3+1)-dimensional hydrodynamic approach. This is very time consuming and makes a tuning of initial conditions to data difficult [25, 26]. However, near midrapidity and especially for high collision energies the longitudinal expansion dynamics is expected to be given by the Bjorken scaling solution [22] which can be implemented analytically. The remaining hydrodynamic equations for the transverse dynamics live in 2 space and 1 time dimension and are much easier to solve [8, 11, 12]. The hydrodynamic evolution is terminated by a freeze-out criterium (in our case a fixed decoupling energy density). At this point the energy and baryon densities are converted into temperature and chemical potentials for baryon number and strangeness, using the EOS, and the particle spectra are calculated using the Cooper-Frye prescription [23]. With these spectra and the hydrodynamic flow pattern on the freeze-out surface the average radial flow velocity and the elliptic flow coefficient are evaluated.
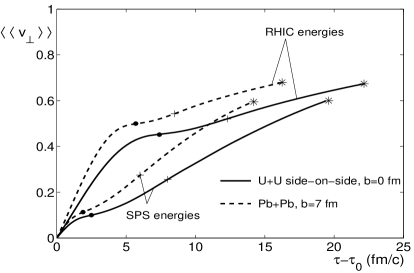
The present paper gives technical details for our previous two short reports in [11] and significantly extends the results presented there. The excitation function for is complemented by a similar one for the average radial flow and calculated up to very much higher energies. We also compute the impact parameter dependence at fixed beam energy of the elliptic flow scaled by the initial spatial anisotropy. The time evolutions of radial and elliptic flow and their dependence on the collision energy are discussed in detail, in order to establish to which extent elliptic flow is really a signature for early pressure in the system [5, 6, 11]. Finally, we advertize central U+U collisions in the side-on-side configuration as an optimum system for studying the hydrodynamic evolution of elliptic flow and the quark-hadron phase transition signature in its beam energy dependence [11]. We give predictions for the time evolution of radial and elliptic flow, for their excitation function and for the -dependence of the elliptic flow coefficient at SPS energies for this particular collision system.
II The hydrodynamic model
The equations of relativistic ideal hydrodynamics follow from the local conservation laws for energy, momentum, and other conserved currents (e.g. baryon number),
| (1) |
by inserting the ideal fluid decompositions
| (2) | |||
| (3) |
is the energy density, the pressure, and the conserved number density at point ; with is the local four velocity of the fluid. Ideal hydrodynamics assumes that local thermalization by the strong interactions among the matter constituents happens fast on the scale defined by the space-time gradients of these quantities and therefore neglects such gradient terms [27].
We always use for the transverse coordinate inside the reaction plane, with positive values in the direction of the impact parameter , and for the transverse coordinate perpendicular to . (In momentum space denotes the rapidity; which meaning is implied should follow from the context.) points in beam direction.
A The equation of state
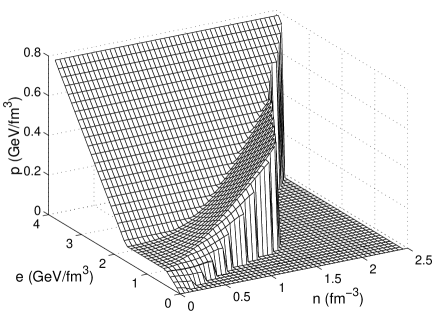
The set (1) contains 5 equations for 6 unknown fields . To close the system one needs an equation of state (EOS) which relates pressure, energy and baryon density. The EOS for strongly interacting matter involves a phase transition from a hadron resonance gas (HG) phase to a color-deconfined quark-gluon plasma (QGP) phase. Like many others before (see, e.g., [28, 29]) we accomplish this by separately constructing an EOS for a resonance gas (EOS H) and for the QGP phase (EOS I)
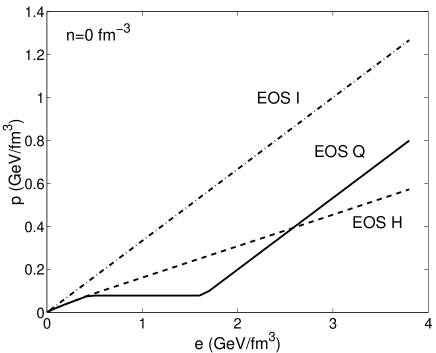
and matching the two via the Maxwell construction, invoking a bag constant to describe the different vacuum energy in the two phases. EOS H is constructed from the contributions of all known hadron resonances of masses up to 2 GeV; their repulsive short-range interactions are parametrized via a mean-field potential with GeV fm3 [29]. The QGP is described as an ideal gas of massless quarks and gluons (EOS I) inside a large bag with bag constant . The latter is tuned to the desired phase transition temperature: MeV gives MeV at vanishing net baryon density. EOS I is given by the simple equation or , independent of .
In order to investigate the influence of the phase transition on the anisotropic transverse flow pattern, we studied separately the equations of state EOS H and EOS I as well as the combined equation of state EOS Q which includes the phase transition between the first two as obtained from the Maxwell construction. Comparisons to data are only performed for EOS Q. Figure 1 shows all three equations of state for vanishing net baryon density while Fig. 2 gives for EOS Q the pressure as a function of both and .
B Reduction to 2+1 dimensions
At high collision energies, relativistic kinematics and its influence on the particle production process implies longitudinal boost-invariance of the collision fireball near midrapidity [22]. (Of course, near the target and projectile rapidities longitudinal boost-invariance is broken by the finite amount of total available energy.) As a result, the longitudinal velocity field scales as , and it is convenient to use a coordinate system spanned by longitudinal proper time and space-time rapidity instead of and (see Appendix A). Longitudinal boost-invariance is then equivalent with -independence.
Assuming the validity of this scaling ansatz near midrapidity, the longitudinal expansion of the fireball can be dealt with analytically, thereby reducing the numerical problem to the two transverse dimensions and time [8]. This greatly reduces the numerical effort. However, by doing so one gives up the possibility to study the rapidity dependence of the (anisotropic) transverse flow pattern [25, 26] as well as other interesting effects which occur at AGS and SPS energies, like the tilt of the longitudinal axis of the collision fireball away from the beam direction [26, 30, 1]. For such studies a complete solution of the (3+1)-dimensional hydrodynamics [25, 26, 30, 33] is required. We will here concentrate entirely on the midrapidity region where the (2+1)-dimensional approach with exact longitudinal boost-invariance is expected to yield reasonable results even at SPS energies. At higher energies the model should become better and better.
The implementation of longitudinal boost-invariance and transformation from to is described in Appendix A. The rewritten hydrodynamic equations read
| (8) |
where
| (9) | |||
| (10) |
We call the transport velocities and the energy flow velocities in the transverse directions. Since we work at midrapidity, , the transverse transport velocities agree with the corresponding fluid velocities in the c.m. frame.
In hydrodynamic problems phase transitions generically lead to the formation of shock waves which complicate the numerical solution. To integrate the differential equations (8) we use the “Sharp and Smooth Transport Algorithm” (SHASTA [31]) which was shown to perform excellently even under difficult conditions [33].
C Initialization of the fields
In this subsection we discuss the initial conditions for the solution of Eqs. (8). Strong interactions between the partons of the colliding nuclei lead to the deposition of a large fraction of the beam energy and the creation of many secondary particles in the reaction zone. The newly produced partons interact strongly with each other and, after only a few scatterings during a time interval (1 fm/), the system is expected to reach a state of approximate local thermal equilibrium. Following [8, 32] (to which we refer for details) we take the energy deposition in the transverse plane to be proportional (by a factor ) to the number of collisions producing wounded nucleons:
| (11) | |||
| (12) | |||
| (13) |
Here is the nuclear thickness function of the incoming nucleus ,
| (14) |
where the nuclear density is given by a Woods-Saxon profile,
| (15) |
and similarly for nucleus .
We further assume that the initial transverse density profile of net baryon number is proportional to the initial transverse energy density profile:
| (16) |
For Pb-Pb collisions we use in (15) a nuclear radius fm and a surface thickness fm [34]. For U-U collisions we take fm, with a deformation ([34], Vol. 2, p. 133). This leads to a ratio between the long and short axes of this nucleus; in absolute terms fm and fm [35]. For the ground-state nuclear density we take fm-3 [34].
Three parameters thus describe the initial conditions:
-
the maximum energy density in a central collision () – this fixes the parameter in (11) at the given beam energy;
-
the ratio in (16) between energy and baryon density;
-
the equilibration time .
In Sec. II E we adjust the parameters by tuning the output of our calculations with EOS Q for central () Pb+Pb collisions to experimental data (transverse mass spectra of negative hadrons and net protons at midrapidity [36]) at 158 GeV/ beam momentum. We use the same parameters and for U+U collisions at 155 GeV/.
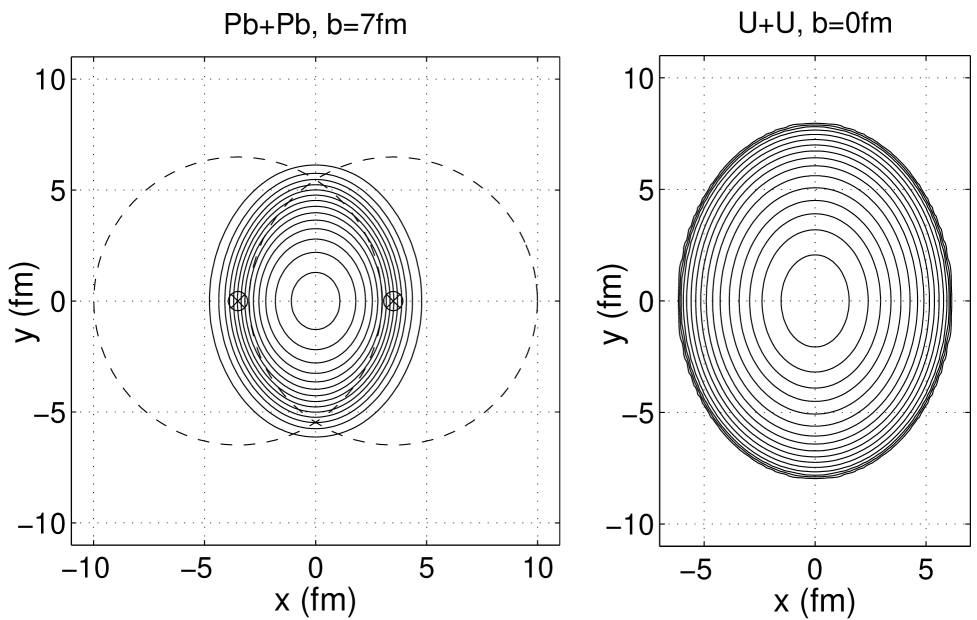
In Fig. 3 we illustrate the initial conditions resulting from this tuning procedure. It shows contour plots of the energy density in the transverse plane at for Pb+Pb collisions with fm and central U+U collisions in the side-on-side configuration at the highest SPS beam momentum of GeV/. Note that at fixed collision energy the central energy density for side-on-side U+U collisions is 8% lower than for Pb+Pb collisions, but about 14% higher than in Pb+Pb collisions at fm which correspond to about the same initial spatial deformation. At similar deformation, the initial volume of the elliptic fireball formed in central side-on-side U+U collisions is almost twice that of the corresponding semi-central Pb+Pb collisions.
D Freeze-out and particle spectra
As the matter expands and cools, the mean free path of the matter constituents grows, and the hydrodynamical description eventually breaks down. The system reaches the point of “kinetic freeze-out” after which the momentum spectra are no longer significantly affected by scattering among the particles. One should stop the hydrodynamic solution when the average time between scatterings becomes comparable to the expansion time scale (inverse “Hubble constant”) [39, 40, 41]. [It was shown in [42] that in relativistic heavy ion collisions freeze-out happens dynamically rather than geometrically, i.e. it is driven by the expansion of the fireball and not by its finite size.] Numerical calculations [42, 43] have shown that, since the particle density in the denominator of is a very steep function of , this leads to freeze-out at nearly constant temperature. For low net baryon freeze-out densities, as they arise in heavy ion collisions at and above SPS energies near midrapidity, this corresponds to almost constant energy density. We here therefore impose freeze-out at a constant energy density which is the most easily implemented condition in hydrodynamics. The value of (or, nearly equivalently, ) is another model parameter to be tuned to the data.
After the freeze-out hypersurface of constant energy density has been determined, the , chemical potentials and flow velocity field are evaluated on this surface. To this end a tabulated version of EOS H is used for interpolation which (in addition to the pressure ) gives the intensive thermodynamical variables as functions of and . Each cell on this freeze-out hypersurface contributes particles of species (where runs over all resonances included in EOS H) with a local equilibrium distribution
| (17) |
is the spin-isospin degeneracy factor for particle species . The complete momentum spectrum is obtained by summing the corresponding particle flux currents across the 3-dimensional freeze-out hypersurface in space-time over all cells in (Cooper-Frye prescription [23]):
| (18) |
This prescription is strictly correct only for freeze-out surfaces whose normal vector is everywhere timelike because otherwise some particles flow back into the 4-volume inside . A discussion of this issue which still awaits a fully consistent solution can be found in [44, 45].
In the present paper we concentrate on flow patterns reflected in pion spectra. (Flow anisotropies for pions and protons at SPS energies were compared in [11].) A significant fraction of the measured pions arises from the decays of unstable resonances after freeze-out. These decays usually happen isotropically in the rest frame of the resonance and tend to smear out flow anisotropies, thereby reducing the anisotropic flow signals [11, 25]. The fraction of pions from resonance decays depends strongly on the freeze-out temperature: their diluting effect on the elliptic flow , for example, is much stronger at MeV [25] than at MeV [11]. All our calculations fully account for resonance decay contributions including the complete relativistic decay kinematics [46].
E Tuning the model
Since the hydrodynamic approach cannot describe the initial thermalization stage directly after nuclear impact, the initial conditions for the hydrodynamic expansion stage cannot be predicted but must be obtained by fitting experimental data. However, once the initial conditions (in our case the parameters , and ) have been fixed in central collisions, the Glauber model (11) uniquely predicts their dependence on the impact parameter. The validity of the hydrodynamic model can thus be tested by checking the impact parameter dependence of its predictions. In [11, 47] we showed that, after being tuned to central Pb+Pb collisions at 158 GeV/, the model successfully reproduces the measured pion and proton spectra near midrapidity up to impact parameters of 8-10 fm. This was better than expected.
We here provide some details of the tuning procedure which were not previously reported in [11] due to space limitations. In particular we show in Fig. 4 our fit to the midrapidity -spectra of negative hadrons () and net protons measured by the NA49 collaboration [36]. The theoretical spectra are absolutely normalized. The corresponding fit parameters for the initial state are GeV/fm3 for the initial energy density in the center of the fireball (corresponding to GeV/fm in (11) and to an initial central temperature MeV [37]), fm-3 for the initial baryon density in the fireball center (corresponding to GeV-1 in (16)), and a starting time fm/ for the hydrodynamic expansion (corresponding to ). controls the dilution of the matter via boost-invariant longitudinal expansion and thus the length of time available for the buildup of transverse flow before freeze-out; the latter affects the slope of the -spectra. The total time until freeze-out and the amount of transverse flow generated can also be changed by varying the initial energy density, but this also affects the normalization of the midrapidity spectra. and result from a suitable balance between these two effects. is then essentially fixed by the measured ratio between the proton and spectra.
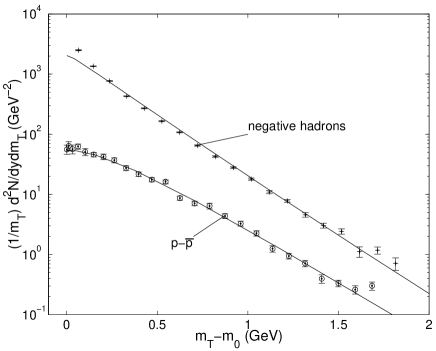
The different shapes of the proton and spectra provide a handle to separate collective transverse flow () from thermal motion () at freeze-out. However, it is known that a thermal model analysis of particle spectra in general results in strong correlations between these two parameters [41, 42]. Our best fit gives MeV (corresponding to GeV/fm3) and , albeit with a significant uncertainty (somewhat lower with higher and vice versa cannot be excluded). This is in good agreement with other analyses of particle spectra [48] and hydrodynamic simulations [49]; a combined analysis of spectral slopes and two-particle Bose-Einstein correlations [50, 51] tends to give somewhat larger transverse flow velocities coupled to lower freeze-out temperatures, but still inside the region of uncertainty from the analysis of the single-particle spectra.
This set of fit parameters, adjusted to SPS data, is our starting point for extrapolations towards non-central collisions and into different collision energy regimes. When studying the impact parameter dependence at fixed collision energy we leave all parameters unchanged. This may be unrealistic for very peripheral collisions where the midrapidity fireball is smaller and geometric freeze-out can cut the expansion short, leading to higher decoupling temperatures. For the spectral slopes this is a second order effect since earlier freeze-out at higher is partially compensated for by a smaller transverse flow velocity . As we will see below (see Fig. 7), the elliptic flow anisotropy builds up early in the collision and, even at SPS energies, has almost reached its final value already several fm/ before decoupling; a possible earlier decoupling in very peripheral collisions thus will not strongly affect either. We thus feel justified in leaving the model parameters (in particular the decoupling temperature) unchanged when studying the impact parameter dependence.
When investigating the excitation function of radial and elliptic flow we change and . This is rationalized as follows: At higher energies we expect higher particle production per wounded nucleon; we cannot predict the beam energy dependence of secondary particle production, but we can parametrize it by changing and plotting our results as a function of the finally observed multiplicity density . The beam energy dependence of will eventually be provided by experiment, then allowing to present our results directly against . – Higher initial particle production leads to higher particle and energy densities and thereby to accelerated thermalization. From relativistic kinematics and the uncertainty relation it follows that the production time of a secondary particle is inversely related to its energy [52]; by dimensional analysis this suggests that the thermalization time scales in inverse proportion to the initial temperature : = const. or, equivalently, = const. This is what we use in the present paper; in [11] we instead left constant. Within the range of collision energies studied in [11] the difference is negligible, but for the higher energies investigated here a reduction of causes a significant shrinkage of the horizontal axis on the excitation function in Fig. 14 below.
For energies above the SPS we leave the initial baryon density unchanged. As a result, the ratio of baryon to energy density drops, qualitatively consistent with the expectation of decreasing baryon stopping. Since already at the SPS the influence of the baryons on the EOS is minor, it doesn’t really matter in which way approaches zero as the collision energy goes to infinity. Note that we don’t predict the normalization of the baryon spectra at other than SPS energies. Below SPS energies we leave constant, lacking motivation for a different choice. Once a better understanding of the beam energy dependence of the initial conditions becomes available, this can be easily improved.
III Transverse flow phenomenology
In this section we study generally the space-time evolution of the transverse flow pattern and how it is influenced by a phase transition in the EOS. Since the finally observed particle spectra and their azimuthal anisotropies reflect the full space-time history of the fireball expansion, their proper interpretation requires an accurate understanding of the transverse fireball evolution. In [11] we showed that the softening of the EOS in the phase transition region leads at collision energies above the SPS to a reduction of the elliptic flow coefficient below the value expected from a hadron resonance gas. At even higher energies, however, one expects to enter a regime where the initial energy density is so far above the phase transition that nearly all of the expansion history happens inside the QGP phase. Since far above the EOS of a QGP () is much harder than EOS H (which in the region relevant for us can be parametrized by ), should eventually rise again and approach the value characteristic of EOS I which is 30-40% higher. In order to see whether this is true we have now studied collisions at very much higher energies, even far beyond the LHC.
A Semiperipheral Pb+Pb collisions
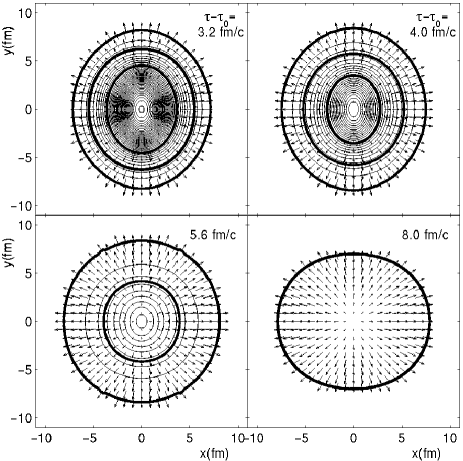
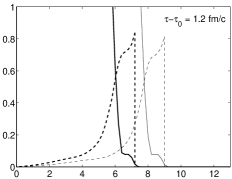
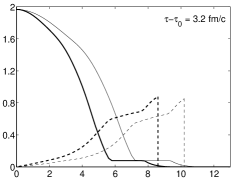
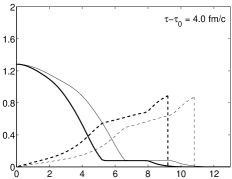
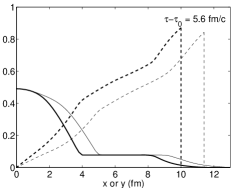
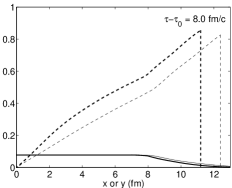
In this subsection we investigate Pb+Pb collisions at an impact parameter of 7 fm (left panel in Fig. 3). We begin by showing the evolution of the energy distribution and flow field in the transverse plane for the cases with and without a phase transition. We do so for an initial central energy density in Pb+Pb collisions of GeV/fm3 ( MeV) at fm/. The resulting total pion multiplicity density with EOS Q of at fm is at the upper end of the range of predictions for RHIC energies [53]. This study was motivated by the work of Teaney and Shuryak who predicted under similar conditions an interesting phenomenon which they called “nutcracker flow” [12] and which shows up only in the presence of a phase transition. In Fig. 5 we show the evolution for EOS I, i.e. a hard EOS without phase transition. One sees smooth expansion and a continuous transition from an initial state of positive elliptic deformation (longer axis perpendicular to the collision plane) to one with negative deformation, caused by the developing in-plane elliptic flow. The thicker contours correspond (from the inside outward) to , 0.45, and 0.06 GeV/fm3; for the more realistic equation of state EOS Q the first two values limit the mixed phase while the latter indicates freeze-out.
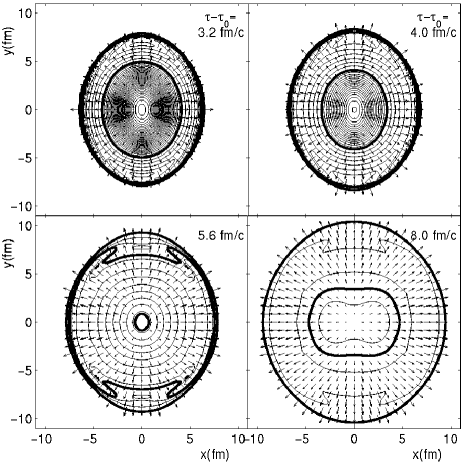
Figure 6 shows the analogous situation for EOS Q (which includes a phase transition) for identical initial conditions. Compared to Fig. 5 one sees clear differences: the lack of a pressure gradient in the mixed phase inhibits its transverse expansion; the hadronic phase ouside the mixed phase expands quickly and freezes out, leaving a shell of mixed phase matter behind which inertially confines the QGP matter in the center. The matter with the softest EOS (smallest ) is concentrated around the QGP/mixed interface (thick contour at 1.6 GeV/fm3). When the QGP matter finally pushes the mixed phase shell apart (the “nutcracker phenomenon” discovered in [12]), the energy density contours develop an interesting structure vaguely reminiscent of two separated half shells. Compared to Fig. 5, the elliptic flow clearly needs more time to push the matter from a state of positive to one of negative elliptic deformation. This is due to the inertia of the mixed phase shell which does not participate in the pushing.
Figures 5 and 6 emphasize the spatial structure of the fireball at fixed time steps. Let us now study the time evolution in more detail. To this end we condense the information contained in the density and flow patterns into three time-dependent scalar quantities:
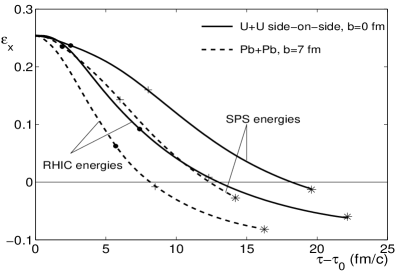
(i) The “spatial ellipticity”
| (19) |
characterizes the spatial deformation of the fireball in the transverse plane. The angular brackets denote energy density weighted spatial averages at a fixed time. causes azimuthal anisotropies in the transverse pressure gradients which would eventually drive it to zero if the hydrodynamic evolution were not cut short by the freeze-out process.
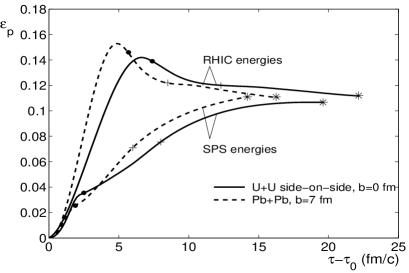
(ii) The momentum anisotropy
| (20) |
measures in an analogous way the anisotropy of the transverse momentum-space density. It is directly calculated from the spatial components of the energy momentum tensor but, as shown in [11], at freeze-out it is nearly equal to the -weighted elliptic flow for pions as calculated from their final momentum spectra [54]. Its time-dependence thus provides a picture of the dynamical buildup of the elliptic flow even at early times when the elliptic flow coefficient (which is calculated from hadronic momentum spectra, see Sec. IV) is not yet defined. For pions at freeze-out is given by [11].
(iii) The time-dependence of the average radial flow velocity
| (21) |
characterizes the buildup of the overall transverse expansion which is modulated by the elliptic flow. Comparing the time-dependencies of and allows to answer the question to which stages of the expansion (i.e. to which domains of the EOS) each one is most sensitive.
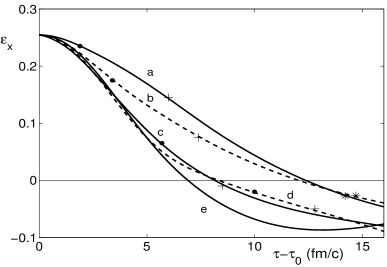
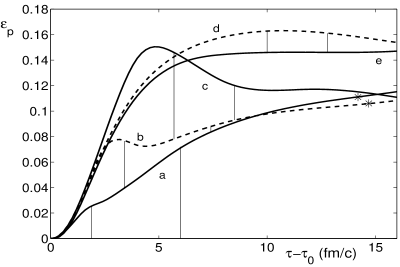
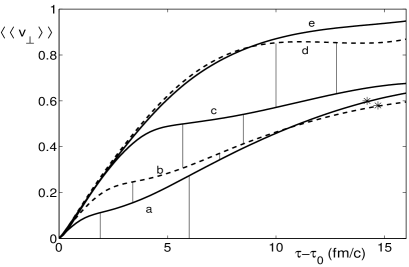
We now give a detailed discussion of Figs. 7a-c which show (using EOS Q) the time evolution for the above three quantities for a sequence of collision energies, parametrized by the initial central energy density in Pb+Pb collisions, : = 9, 25, 175, and 25000 GeV/fm3 (curves a through d in Figs. 7). With increasing the initial time was scaled down as described at the end of Sec. II E. The lowest of these -values corresponds to 158 GeV Pb+Pb collisions at the SPS, while the highest value is far beyond the reach of even the LHC.
A calculation with EOS I is shown for comparison as curve e. Since EOS I () is completely scale invariant, the time evolution of the dimensionless ratios (19), (20), and (21) is invariant under a rescaling of as long as is held fixed (see Eqs. (8)). Changing breaks this scaling, but only weakly as we have checked. Curves e in Fig. 7 show the time evolution for EOS I in the limit . Not shown is a calculation with EOS Q which was initialized with an extraordinarily high initial temperature of GeV ( GeV/fm3); during the first 16 fm/ covered by Fig. 7 it fully coincides with curve e. In this case almost all of the matter stays in the QGP phase during this time period whose EOS coincides with EOS I up to the (here negligible) bag constant. Therefore, as expected, the hydrodynamic evolution with EOS Q approaches at asymptotically high energies that with EOS I.
Inspection of Fig. 7 shows that the elliptic flow saturates at large times while the radial flow keeps rising forever, albeit at a decreasing rate. The driving force for radial flow, the radial pressure gradient between the matter in the fireball and the surrounding vacuum, never vanishes completely. The spatial ellipticity , on the other hand, which is responsible for azimuthal anisotropies in the transverse pressure gradients and thus drives the evolution of , passes through zero after some time. Afterwards the longer axis of the transverse fireball cross section no longer points perpendicular to the reaction plane, but into the reaction plane. A vanishing implies a vanishing growth rate for ; as turns negative, smaller oppositely directed anisotropies of the pressure gradients develop which can actually cause to decrease again. This can be seen in Fig. 7b for large values of where the sign of changes sufficiently early in the collision that pressures are still high enough to generate this effect.
Qualitatively one hence can say that the final value of is established roughly at the point when passes through zero. For SPS energies this happens just before decoupling (implying that the fireball freezes out in a nearly circular configuration), but at high energies this occurs well before freeze-out. Generically the freeze-out value of (and thus ) is sensitive to the EOS at significantly higher energy densities than the radial flow . The elliptic flow indeed measures the early pressure [5, 6].
On a more detailed level, the time evolution shows an interesting additional feature: In curves b and c the elliptic flow is seen to peak even before passes through zero. The origin of this phenomenon, which is related to the phase transition, will be discussed in Sec. III C below.
Comparison of the lower two panels in Fig. 7 shows that the softening effect on the EOS of the phase transition affects the buildup of and at similar times. However, the influence on is stronger since elliptic flow is a smaller effect (which feels only the anisotropies in the transverse pressure gradient, not its overall magnitude) and thus more fragile than radial flow. This results in a relatively larger sensitivity of elliptic flow to the phase transition.
B Central U+U collisions in the side-on-side configuration
As discussed in Sec. II C, central U+U collisions in the side-on-side configuration provide 14% higher energy density over nearly twice the volume at the same initial spatial deformation as Pb+Pb collisions at fm. This leads to a longer lifetime for non-zero spatial ellipticity , the driving force for elliptic flow, and also for the whole fireball until freeze-out. Hence the system has more time for thermalization, favoring the applicability of our hydrodynamic method. For this reason we decided to perform quantitative calculations for this system and make predictions for experiments with uranium beams at RHIC and LHC.
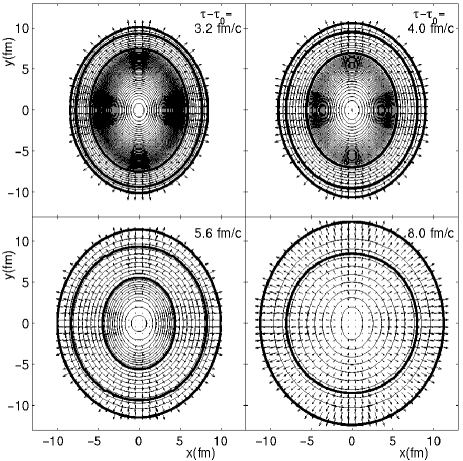
We first look once more at the space-time evolution of the transverse energy density and flow profiles, shown in Fig. 8. The initialization corresponds to the same collision energy as in Fig. 6 ( GeV/fm3) but, since we now consider central () collisions, the initial energy density in the center of the deformed collision
region is higher than in the semiperipheral Pb+Pb collisions of Fig. 6. As seen in Fig. 9, the whole time evolution is slower for central U+U than for semiperipheral Pb+Pb collisions, due to the larger system size: At fm/ (the first shown snapshot) the central energy density is 50% higher, and at fm/ (the last snapshot) it is even by a factor 3 larger than in fm Pb+Pb collisions at the same beam energy. Freeze-out occurs nearly 30% later in central U+U than in semiperipheral Pb+Pb collisions (see Fig. 9).
We note with surprise that the “nutcracker” phenomenon [12] is conspicuously missing in the U+U collisions. We could not find it at lower and higher collision energies either. The origin of this difference between central U+U and peripheral Pb+Pb collisions will be discussed in the following subsection.
In Fig. 9 we compare the time evolutions of the three characteristic quantities , and in central U+U and semiperipheral Pb+Pb collisions, at SPS ( = 9 GeV/fm3) and RHIC ( GeV/fm3) energies. We note that at freeze-out ( MeV) both systems give nearly the same radial and elliptic flow, in spite of the different time evolution: in the large system both flow types develop more slowly, but over a longer time. This does not take into account that the flow gradients are smaller in the larger system, leading to later freeze-out at a lower temperature [49]. This would not change the elliptic flow since has already saturated (actually, it would lead to a very slight decrease of , see Fig. 9b). The radial flow would, however, be somewhat larger. Since we enforced freeze-out at the same value , we don’t see this.
C What makes the nut crack?
In this subsection we analyze two questions which so far remained open: (1) Why does the “nutcracker” phenomenon arise in semiperipheral Pb+Pb collisions, but not in central U+U collisions, in spite of their identical initial deformation? (2) What is the origin of the decrease of before passes through zero which is observed in Fig. 9b and curves b and c of Fig. 7b?
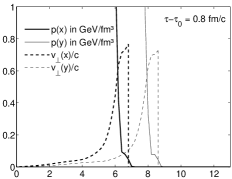
To answer them requires a more detailed look at the time evolution of the transverse pressure gradients (cause) and transverse flow profiles (effect). In Figs. 10 and 11 we show a series of six snapshots each for semiperipheral Pb+Pb and central U+U collisions, plotting the pressure and flow velocity profiles along the and axis, respectively. The crucial difference between the two collision systems is that in the semiperipheral Pb+Pb collisions the initial fireball contains a roughly 0.5 fm thick layer of mixed phase matter with vanishing transverse flow velocity; for central U+U collisions the initial energy density drops to zero so steeply that the mixed phase layer is initially practically absent.
As the matter begins to expand and dilute, a mixed phase layer begins to develop also in the U+U collisions; however, due to the buildup of transverse flow in the expanding matter, it is automatically created with a nonvanishing transverse flow velocity. Thus, even without pressure gradients inside the mixed phase which could accelerate it, the mixed phase matter flows in the transverse directions, with velocities exceeding those of the enclosed QGP matter (see Fig. 11). The resulting transverse flow profiles are monotonous functions of and , with a selfsimilar (linear “scaling”) pattern inside the mixed phase exactly as given by the analytic solution recently found by Biró [59]. The monotony of the transverse flow profiles is related one-to-one to the absence of the nutcracker phenomenon.
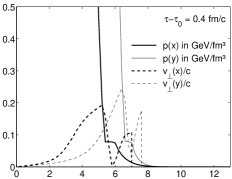
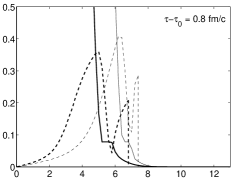
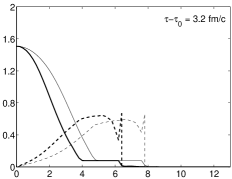
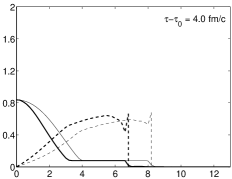
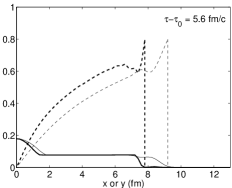
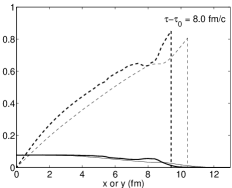
In the semiperipheral Pb+Pb collisions, on the other hand, the initially present mixed phase layer is at rest and, due to the lack of pressure gradients, cannot accelerate itself in the transverse direction. As the transverse pressure gradients in the enclosed QGP matter begin to accelerate the QGP matter, the latter “slams” into the motionless mixed phase. This is clearly seen in the first four panels of Fig. 10 which show a strong radial increase of the transverse flow velocities inside the QGP phase, followed by a dramatic drop inside the mixed phase and a second rise in the HG matter near the edge. Inside the mixed phase the radial velocity profile is thus completely different from the selfsimilar scaling pattern seen in Fig. 11. As time proceeds, this anomalous structure in the Pb+Pb collisions weakens, and the velocity profile begins to approach a scaling form inside the mixed phase; scaling violations survive longest near the outer edge of the mixed phase layer. In the direction they disappear slightly earlier than in the shorter direction; this is the origin of the “nutcracker phenomenon”.
Now we can also understand the decrease of even before passes through zero: Figs. 7, 10 and 11 show that this happens while most of the fireball is in the mixed phase. (Actually, begins to decrease while there is still a small QGP core in the center.) During this stage the matter expands essentially without transverse acceleration, featuring a nearly selfsimilar transverse flow pattern. While it lasts, the selfsimilar flow dilutes the earlier developed momentum anisotropy . This feature is therefore also directly related to the phase transition.
IV Experimental predictions
While the time-evolution of , and is interesting and helpful for an understanding of the relevant physical mechanisms, only the final values at freeze-out are observable (through the momentum spectra and, in the case of , possibly indirectly via two-particle momentum correlations). The flow observables thus represent time-integrals over the expansion history and EOS, and their measurement in a single collision system at fixed beam energy provides very little information. Using flow signatures as indicators for properties of the equation of state for strongly interacting matter requires their measurement over a wide range of external control parameters, such as impact parameter, size of the colliding nuclei, and beam energy. As discussed in the preceding section, a time-differential measurement is to some extent possible by comparing the radial and elliptic flow as functions of these parameters.
Flow anisotropies reflect themselves as non-vanishing higher order Fourier coefficients in a Fourier expansion of the azimuthal dependence of the measured single-particle spectra around the beam direction [55]:
| (22) |
Since most experiments have limited acceptance, one studies these coefficients also as functions of the transverse momentum:
| (23) |
The -weighted anisotropic flow coefficients are defined by
| (24) |
In symmetric collision systems (which are the only ones we consider here) the odd order coefficients vanish at midrapidity by symmetry. We here concentrate on the second harmonic coefficient which is conventionally called “elliptic flow”. The are only defined at freeze-out but we already discussed how and can be related to which is known also before freeze-out.
and are functions of time; in the present section, however, we only need the initial spatial deformation and the final momentum-space deformation . For simplicity we will quote them as and , respectively, without the time arguments.
A -dependence of elliptic flow
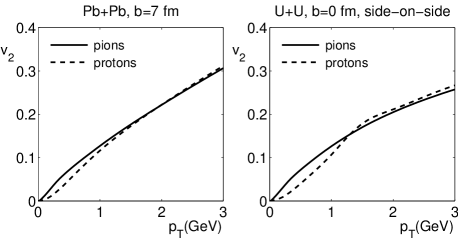
Since most experiments have a limited acceptance in transverse momentum, the measured elliptic flow signal must be corrected for the -acceptance. In Fig. 12 we show the -dependence of for pions and protons for semiperipheral Pb+Pb and central U+U collisions. In spite of their different masses, the predicted is rather similar for the two particle species [10]. At low , the heavier protons show even a little less elliptic flow than the pions. To the extent that hydrodynamics is applicable, the larger for protons than pions measured by NA49 [17] is thus predominantly due to the different -windows for the two particle species (the proton elliptic flow was measured at higher [17]).
According to general arguments [56], must vanish with zero slope as . We checked that this is true. Fig. 12 shows, however, that for pions the turnover from a roughly linear behaviour at large to zero slope as occurs at very small -values, GeV/; for protons the corresponding scale is somewhat larger. We have no quantitative analytic understanding of this momentum scale but note that qualitatively similar behaviour was found in [57] using the kinetic UrQMD model.
B Impact parameter dependence of elliptic flow
As one changes the impact parameter, the initial spatial deformation of the transverse cross section through the reaction zone varies as shown in Fig. 3 of Ref. [8]. The stronger the initial ellipticity, the stronger is the hydrodynamic response to it, i.e. the larger are or at freeze-out. Ollitrault [8] showed that for an EOS with a constant velocity of sound, = const., the ratio or, equivalently, is independent of the impact parameter [58]. (Ollitrault [8] used the variable which is closely related to [54]. For pions and are related by a factor 2 [11].) This scaling is broken only for very peripheral collisions which freeze out before the elliptic flow builds up and saturates; thus in hydrodynamics is constant over most of the impact parameter range.
A phase transition is characterized by a strong drop of the sound velocity in the critical region (for a first order phase transition the sound velocity vanishes in the mixed phase). It is therefore interesting to reinvestigate the impact parameter dependence of in the presence of a phase transition. The impact parameter not only controls the initial spatial ellipticity of the fireball, but also (with less variation) its initial energy density. At a given beam energy, it is therefore possible to probe the EOS over a range of energy densities by varying the impact parameter. For a beam energy, at which in central collisions the initial energy density is not too far above the phase transition, it may thus be possible to study the effect of the reduced sound velocity near the phase transition on the elliptic flow by changing the impact parameter. Weak structures in Fig. 9 of Ref. [8] first indicated that the quark-hadron phase transition might thus become visible. Our analysis improves on that analysis by including resonance decays which tend to dilute the elliptic flow signature [11].
In Fig. 13 we study the impact parameter dependence of in Pb+Pb collisions for three different initial central energy densities: GeV/fm3 (corresponding to a low energy run at RHIC), GeV/fm3 (corresponding to collisions at the highest SPS energy of 158 GeV), and GeV/fm3 (corresponding to lower SPS energies around 40 GeV). The calculated total pion multiplicity densities at and midrapidity are = 859, 460, and 317, respectively. For later comparison with Fig. 14 we also quote the corresponding rapidity densities for semiperipheral Pb+Pb collisions: = 415, 220, and 148, respectively.
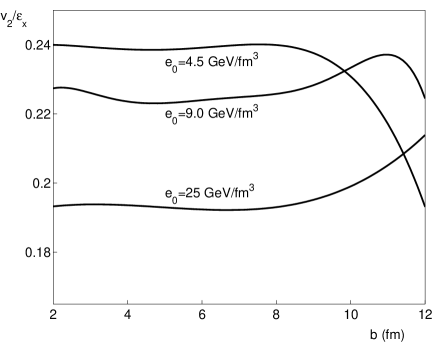
Fig. 13 shows that, at moderate impact parameters, the largest elliptic flow is generated at the lowest of these three beam energies. At very large impact parameters (where hydrodynamics becomes doubtful) the generated elliptic flow naturally drops to zero, since the overlap region and its initial energy density are then too small and the matter freezes out before flow can develop. What is interesting, however, is that at higher beam energies the elliptic flow starts out lower than at GeV/fm3, but then rises with increasing . In fact, for GeV/fm3 this ratio reaches at fm nearly the same value as for central collisions at GeV/fm3.
The decrease with rising beam energy of at moderate impact parameters was found [11] to result from the softening of the EOS in the phase transition region. The soft matter near the transition point inhibits the buildup of elliptic flow. Going at fixed beam energy to larger impact parameters is like going at fixed impact parameter to lower beam energies: in both cases the initial energy density in the collision zone is reduced, and eventually the matter is dominated again by the relatively hard hadron gas. When read from right to left, the curves in Fig. 13 can thus be viewed as different projections of the excitation function of elliptic flow which will be discussed below. We emphasize in particular the rise of towards larger impact parameters at the high SPS and the low RHIC energy: without a phase transition this feature would be absent. Unfortunately, these variations are small (at the level of a few percent), and very accurate measurements are required to identify them.
Preliminary data from 158 GeV Pb+Pb collisions [17] show a monotonous decrease of with increasing impact parameter, instead of the nearly constant behaviour predicted by hydrodynamics (see Fig. 13). For , however, the data seem to approach the hydrodynamic prediction. It is possible that semiperipheral Pb+Pb collisions do not equilibrate quickly enough to permit the elliptic flow to fully reach the hydrodynamic limit. Indeed, kinetic simulations with the RQMD code [6, 17, 24], where the collision centrality is coupled to the degree of local thermalization, are able to qualitatively explain the observed decrease of with increasing impact parameter: more peripheral collisions lead to less equilibration and hence to a weaker elliptic flow response to the initial spatial ellipticity. When RQMD is modified to simulate an EOS with a quark-hadron phase transition [6], the same generic decrease is superimposed on the rise of at large shown here (middle curve in Fig. 13); this results in a decrease of which is first steep, then flattens, then finally steepens again [6].
It is evident that a proper understanding of the interesting features in the impact parameter dependence of predicted in [6] for Pb+Pb collisions require the separation of pre-equilibrium effects from those induced by the softening of the EOS near the phase-transition. A collision system which is large enough to ensure sufficiently rapid thermalization for hydrodynamics to apply would make life much easier. We therefore suggest to study elliptic flow in side-on-side U+U collisions at zero impact parameter and search for the hydrodynamically predicted phase transition signatures in the beam energy dependence of elliptic flow.
C Beam energy dependence of elliptic flow
The time-dependence of the flow patterns discussed in Sec. III reflects itself also in the beam energy dependence of elliptic flow. We already noted in [11] that the phase transition causes an non-monotonic excitation function for the elliptic flow coefficient : as the collision energy is increased, first rises (at low energies the fireball freezes out before the elliptic flow can saturate) but then decreases again as the initial energy density rises above the QGP threshold. We now understand that this decrease is intimately connected to the diluting effects of the selfsimilar fireball expansion in the mixed phase, even before the spatial deformation passes through zero (see the discussion in Sec. III C.) Without a phase transition (EOS H) this does not happen (see dash-dotted lines in Fig. 14); the slight decrease of with EOS H at asymptotically high energies has a different origin, namely a reduction of by the opposite sign of the spatial fireball anisotropy after has passed through zero.
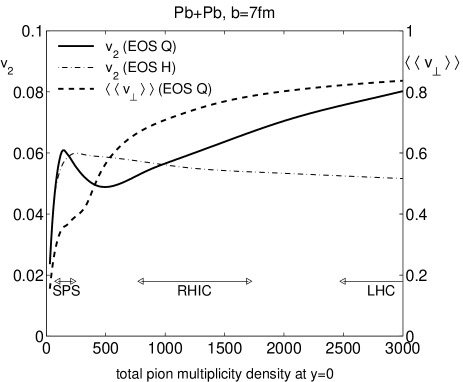
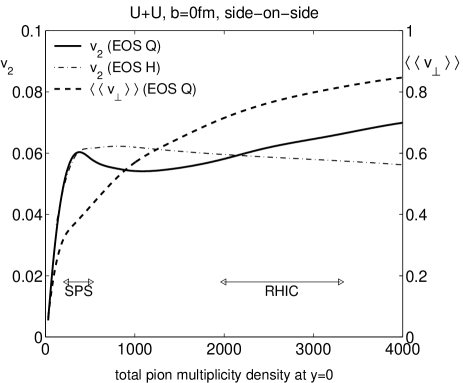
The comparison of semiperipheral Pb+Pb collisions with central U+U collisions in the upper and lower panels of Fig. 14 shows that this non-monotonic behaviour of the excitation function for is not sensitive to the existence of the “nutcracker phenomenon”: the decrease of below its maximum in the SPS regime is only slightly weaker in the U+U case than for Pb+Pb, although only the latter features a “cracking nut”. Since elliptic flow is a fragile phenomenon which is quite sensitive to incomplete thermalization, we believe that the most promising route towards experimental verification of the phase transition signature suggested here is to study the excitation function of in largest available deformed collision system, namely central side-on-side U+U collisions.
In Ref. [11] we missed the fact that at asymptotically high energies the elliptic flow coefficient must approach the larger value corresponding to the stiffer QGP equation of state EOS I. We calculated in [11] the excitation function for fm Pb+Pb collisions only up to multiplicity densities and concluded prematurely that saturates at high collision energies at a value below the value corresponding to EOS H. Fig. 14 extends the excitation functions for both Pb+Pb and U+U collisions to LHC energies and demonstrates that begins to rise again, eventually approaching the EOS I limit. The dip, which indicates the presence of the phase transition, thus only covers the energy range between SPS and RHIC. Note that in the same energy region also the radial flow (dashed lines in Fig. 14) is predicted to grow more slowly with than at lower and higher beam energies where the expansion is predominantly driven by pure HG or pure QGP matter.
D Elliptic flow as an estimator for the thermalization time scale
Throughout this paper we have assumed early thermalization followed by hydrodynamic expansion. For a given initial deformation of the collision zone in the transverse plane (which can be calculated from geometry once the impact parameter is known, for example by a measurement of the number of spectator nucleons), this guarantees the maximum possible momentum-space response in the form of elliptic flow. Any delay in the thermalization process will lead to a reduction of the elliptic flow: even without secondary collisions the spatial deformation of the region occupied by the produced particles decreases by free-streaming, and if thermalization effectively sets in later, the resulting anisotropies in the pressure gradients will be smaller, leading to less elliptic flow.
We can use the above demonstrated fact that, up to variations of the order of 20%, the hydrodynamic response to the elliptic spatial deformation at thermalization is essentially constant: const. . This allows to interpret the measured in terms of an effective initial spatial deformation at the point of thermalization, i.e. at the beginning of the hydrodynamic evolution. It is clearly not a good approximation to idealize the initial kinetic equilibration stage of the collision by a stage of collisionless free-streaming followed by hydrodynamic expansion, thereby assuming a sudden, but delayed transition from a non-equilibrium initial state to a fully thermalized fluid. Still, this simple-minded picture can be used to obtain a rough first order-of-magnitude guess of the thermalization time scale, based on a measurement of .
To this end we note that under free-streaming the phase-space distribution evolves as
| (25) |
Using a Gaussian parametrization for the initial phase-space distribution of produced secondary particles,
| (26) |
one easily finds
| (27) | |||||
| (28) |
where is the time delay between particle formation and thermalization. Assuming that can be obtained from the measured by dividing by , we can extract by rewriting (27) as
| (29) |
where parametrizes the initial deformation via , such that .
Inserting appropriate values for and one finds that for Pb+Pb collisions at fm a dilution by 50% of the elliptic flow signal by initial free-streaming requires a time-delay of order 3.5 fm/ until thermalization sets in; for central U+U collisions in the side-on-side configuration fm/ of approximate free-streaming would be required to dilute the elliptic flow signal by 50%. This (admittedly rough) exercise demonstrates two points: (i) U+U collisions provide the better chance to observe the full hydrodynamic elliptic flow signal, and (ii) the observation of less elliptic flow than hydrodynamically expected can be used to obtain a rough estimate of the thermalization time scale in the initial collision stage.
V Summary
On the basis of hydrodynamic simulations we analyzed the sensitivity of radial and elliptic transverse flow at midrapidity to the quark-hadron phase transition. We modelled this phase transition as a strongly first order phase transition with a latent heat of about 1.15 GeV/fm3. It manifests itself dynamically as an expanding shell of mixed phase matter inside which all pressure gradients and thus all hydrodynamic acceleration forces vanish. Compared to the situation of a pure HG or a pure QGP phase this leads to a reduction of both radial and elliptic flow. Elliptic flow, as the more fragile phenomenon which is generated only by azimuthal anisotropies in the pressure gradients, shows a larger sensitivity to the phase transition than radial flow. Also, since we showed that it saturates well before freeze-out, it more directly reflects the EOS during the early and dense stages of the expansion.
As a tell-tale signature for the phase transition we predict a non-monotonic excitation function for the elliptic flow coefficient as shown in Fig. 14. In the present paper we explored in great detail the origin of the dip in , which we predict to occur in the energy region between the SPS and RHIC, by performing a careful analysis of the space-time evolution of the anisotropic transverse flow pattern for a variety of collision energies. As the dynamical origin of the phase transition signature in we identified the existence of a large subvolume of mixed phase matter which undergoes nearly selfsimilar, acceleration-free expansion while it lasts. In addition to the excitation function it leaves traces in the impact parameter dependence of the response of the elliptic flow to the initial spatial deformation of the collision zone, and in the (not directly measurable) time evolution of the flow anisotropy .
When colliding spherical nuclei with each other, the measurement of elliptic flow requires selecting collisions at rather large impact parameters ( fm) in order to achieve a sufficiently large initial spatial deformation of the nuclear overlap region (reaction zone). Correspondingly the overall size of the elliptically deformed, expanding fireball is small, and one may doubt the applicability of our hydrodynamic approach. We here point out that central U+U collisions in the side-on-side configuration provide nearly twice larger collision volumes at similar deformation as Pb+Pb collisions at fm and should thus exhibit hydrodynamic behaviour much more clearly.
We therefore carefully compared central side-on-side U+U collisions with semiperipheral Pb+Pb collisions at all collision energies. We showed that the phase transition signature in the excitation function manifests itself similarly in both collision systems. The U+U system should thus be preferred for its presumed better hydrodynamical behaviour and for the larger particle multiplicities which improve the statistics of elliptic flow measurements. The phase transition signal appears to be slightly stronger in the smaller Pb+Pb system; we were able to trace this to the “nutcracker phenomenon” of Shuryak and Teaney [12] which, unfortunately, only occurs in the Pb+Pb system. In trying to understand the fragility of “nutcracker flow” we found that it crucially relies on the existence of a rather thick shell of mixed phase matter at rest in the initial state of fireball expansion, which surrounds a significant core of QGP. In response to internal pressure gradients the QGP core starts to expand and “slams” into the surrounding shell of mixed phase at rest. This cannot happen in central U+U collisions since there the initial transverse energy density profile drops to zero so steeply that no visible mixed phase shell forms.
We thus conclude that the interesting “nutcracker flow” phenomenon constitutes a very fragile variant of anisotropic flow which is not generated in central U+U collisions. If the fireballs formed in semiperipheral Pb+Pb collision should turn out to be too small to achieve sufficient local thermalization for hydrodynamics to work, it may be unmeasurable. Fortunately, the elliptic flow signature for the phase transition is more robust and does not require the actual “cracking of the nut”; it should be clearly visible in central U+U collisions.
This raises the question how to experimentally select the side-on-side collision geometry. By requiring zero spectators one can trigger on configurations in which the colliding nuclei overlap completely in the transverse plane. This still allows for arbitrary, but (up to a sign) equal angles () between the beam direction and the long axes of the two deformed nuclei. The interesting side-on-side configuration corresponds to . Since this configuration has the largest initial spatial deformation in the transverse plane, it generates the largest elliptic flow ; therefore, Shuryak [18] suggested a cut on large to select the side-on-side collision geometry. Unfortunately, the event-by-event fluctuations of are so large that this off-line trigger is not expected to be very efficient [60]; furthermore, it would introduce an inconvenient trigger bias into our suggested investigation of the dependence of on various control parameters.
We have not been able to come up with a more efficient selection criterium. We checked that with initial conditions calculated according to (11), the produced charged particle multiplicity densities at midrapidity vary by less than 5% between tip-on-tip and side-on-side collisions (with side-on-side collisions producing more particles, with slightly smaller at freeze-out). Again this difference is well below the expected level of event-by-event fluctuations. Its smallness is explained by the fact that with the Ansatz (11) the amount of entropy stopped at midrapidity is essentially independent of the orientation (for 0∘ it is 1.3% larger than for 90∘), and boost-invariant longitudinal expansion conserves . At higher collision energies minijet production may overtake the soft particle production processes implicitly assumed in (11); instead of scaling with the number of wounded nucleons as in (11), minijet production scales with the number of nucleon-nucleon collisions, involving the product rather than the sum of the nuclear thickness functions appearing in (11). In this case tip-on-tip collisions are expected to generate considerably more entropy in the transverse plane at midrapidity than side-on-side collisions, and one could trigger on the latter by selecting for zero spectators combined with low . — In the absence of an efficient trigger for side-on-side U+U collisions at present-day collision energies one will be forced to compare with data which are averaged over all orientations . The computation of an orientation-averaged excitation function for is, however, numerically expensive; we therefore postpone it until experiments involving U+U are approved.
Our prediction of a dip in the excitation function of at midrapidity is directly related to the one by Rischke et al. [4] of a dip in the excitation function for directed flow at forward and backward rapidities: both rely on the softening of the EOS near the phase transition which results in reduced hydrodynamic pressure gradients. We point out, however, that, as the collision energy increases, the time interval during which directed flow is generated (the nuclear transition time) becomes shorter and shorter, and the prospects for sufficiently fast local thermalization to validate hydrodynamic concepts thus become worse and worse. The opposite is true for elliptic flow: Figs. 7 and 9 show that the time interval over which elliptic flow builds up approaches at high collision energies a finite limit of about 7 fm/ for semiperipharal Pb+Pb and about 12 fm/ for central U+U collisions. The density of produced particles, on the other hand, continues to increase, leading to shorter and shorter thermalization times. The hydrodynamic description of elliptic flow buildup should thus become better with increasing collision energy.
We finally comment on the sensitivity of the proposed phase transition signature to our simple modelling of the phase transition: we used a Maxwell construction between the HG and QGP equations of state, leading to a strong first order phase transition with large latent heat. We don’t believe that smoothing the phase transition to a rapid crossover will qualitatively alter our results: the only major change will be a replacement of the acceleration-free mixed phase by a transition region with non-zero, but nevertheless small pressure gradients. However, since elliptic flow signals are generically weak and the predicted effects from the phase transition are at a level of only about 10% of this signal, further hydrodynamic simulations using a more realistic modelling of the EOS may be required for a reliable quantitative assessment of the expected experimental signal.
Acknowledgements.
We gratefully acknowledge fruitful discussions with Tamas Biró, Pasi Huovinen, Art Poskanzer, and Sergei Voloshin. Our hydrodynamic code is a (2+1)-dimensional generalization of a (1+1)-dimensional algorithm for central collisions which was originally developed by M. Kataja, P.V. Ruuskanen, R. Venugopalan, and P. Huovinen. We thank these colleagues for allowing us to modify their code for non-central collisions. This work was supported in part by BMBF, DFG and GSI.A Implementation of boost invariance
An elegant method of introducing longitudinal boost invariance with the longitudinal velocity field makes use of the notation of general covariant derivatives.
In an arbitrary coordinate system the equations of motion can be written as
| (A1) |
where the semicolon indicates a covariant derivative. For tensors of rank 1 and 2 it reads explicitly
| (A2) | |||||
| (A3) |
where the komma denotes a simple partial derivative and the Christoffel symbols are given by derivatives of the metric tensor :
| (A4) |
We use this with the following transformation from Cartesian to light cone coordinates:
| (A5) | |||||
| (A6) | |||||
| (A7) |
In the new coordinate system the velocity field (after inserting ) is given by
| (A8) |
with , , and .
Now we turn to the metric of the new system. We have
| (A9) | |||||
| (A10) |
and therefore
| (A11) |
The only non-vanishing Christoffel symbols are
| (A12) |
Finally, by making use of the relations and the energy-momentum conservation equations (A1) turn for into
| (A14) | |||
| (A15) | |||
| (A16) | |||
| (A17) | |||
| (A18) | |||
| (A19) | |||
| (A20) |
while the current conservation (A1) becomes
| (A21) |
We note the explicit appearance of on the r.h.s. of the differential equations, reflecting the dilution of the matter due to the boost-variant longitudinal expansion. Connected with this is the initial equilibration time as one of the model parameters. Equation (A20) expresses the fact that, due to longitudinal boost-invariance, the evolution is -independent.
Multiplying these equations by and introducing the scaled quantities , , and leads to the simple form (8).
REFERENCES
- [1] M.A. Lisa, U. Heinz, and U.A. Wiedemann, nucl-th/ 0003022.
- [2] A comprehensive list of references can be found in the recent review by N. Herrmann, J.P. Wessels, and T. Wienold, Ann. Rev. Nucl. Part. Sci. 49, 581 (1999).
- [3] E. Laermann, Nucl. Phys. A610, 1c (1996); F. Karsch, hep-lat/9909006.
- [4] D.H. Rischke, Y. Pürsün, J.A. Maruhn, H. Stöcker, and W. Greiner, Heavy Ion Physics 1, 309 (1995).
- [5] H. Sorge, Phys. Rev. Lett. 78, 2309 (1997).
- [6] H. Sorge, Phys. Rev. Lett. 82, 2048 (1999).
- [7] H. Stöcker et al., Phys. Rev. C 25, 1873 (1982).
- [8] J.Y. Ollitrault, Phys. Rev. D 46, 229 (1992).
- [9] J.Y. Ollitrault, Nucl. Phys. A638, 195c (1998).
- [10] H. Heiselberg and A.-M. Levy, Phys. Rev. C 59, 2716 (1999).
- [11] P.F. Kolb, J. Sollfrank, and U. Heinz, Phys. Lett. B 459, 667 (1999); P.F. Kolb, J. Sollfrank, P.V. Ruuskanen and U. Heinz, Nucl. Phys. A661, 349c (1999).
- [12] E.V. Shuryak, Nucl. Phys. A661, 119c (1999); D. Teaney and E.V. Shuryak, Phys. Rev. Lett. 83, 4951 (1999).
- [13] E.V. Shuryak and O.V. Zhirov, Sov. J. Nucl. Phys. 28, 247 (1978); and Phys. Lett. B 89, 253 (1980).
- [14] L. van Hove, Phys. Lett. B 118, 138 (1982).
- [15] M. Kataja, P.V. Ruuskanen, L.D. McLerran, and H. von Gersdorff, Phys. Rev. D 34, 2755 (1986).
- [16] H. Sorge, Phys. Lett. B 402, 251 (1997).
- [17] NA49 Collaboration: H. Appelshäuser et al., Phys. Rev. Lett. 80, 4136 (1998); A.M. Poskanzer, S.A. Voloshin et al., Nucl. Phys. A661, 341c (1999).
- [18] E.V. Shuryak, Phys. Rev. C 61, 034905 (2000).
- [19] Bao-An Li, Phys. Rev. C 61, 021903(R) (2000).
- [20] S.A. Bass, M. Gyulassy, H. Stöcker, and W. Greiner, J. Phys. G 25, R1 (1999).
- [21] CERN Press Release Feb. 10, 2000: http://cern.web. cern.ch/CERN/Announcements/2000/NewStateMatter/; U. Heinz and M. Jacob, nucl-th/0002042.
- [22] J.D. Bjorken, Phys. Rev. D 27, 140 (1983).
- [23] F. Cooper and G. Frye, Phys. Rev. D 10, 186 (1974).
- [24] S.A. Voloshin and A.M. Poskanzer, Phys. Lett. B 474, 27 (2000).
- [25] T. Hirano, nucl-th/9904082 and nucl-th/0004029.
- [26] C. Nonaka, N. Sasaki, S. Muroya, and O. Miyamura, Nucl. Phys. A661, 353c (1999); C. Nonaka, S. Muroya, and O. Miyamura, nucl-th/9907045; K. Morita, S. Muroya, H. Nakamura, and C. Nonaka, Phys. Rev. C 61, 034904 (2000).
- [27] L.P. Csernai, Introduction to relativistic heavy ion collisions (Wiley&Sons, Chichester (UK), 1994).
- [28] K.S. Lee, M.J. Rhoades-Brown, and U. Heinz, Phys. Lett. B 174, 123 (1986); and Phys. Rev. C 37, 1452 (1988).
- [29] J. Sollfrank et al., Phys. Rev. C 55, 392 (1997)
- [30] J. Brachmann et al., Phys. Rev. C 61, 024909 (2000).
- [31] J.P. Boris, D.L. Book, J. Comp. Phys. 11, 38 (1973); J.P. Boris, D.L. Book, and K. Hain, ibid. 18, 248 (1995).
- [32] J.-P. Blaizot and J.-Y. Ollitrault, in Quark-Gluon Plasma (R.C. Hwa, ed.), Adv. Series on Directions in High Energy Physics 6, p.393 (World Scientific, Singapore, 1990).
- [33] D.H. Rischke, S. Bernard, and J.A. Maruhn, Nucl. Phys. A595, 346 (1995); D.H. Rischke, Y. Pürsün, and J.A. Maruhn, ibid., p. 383.
- [34] A. Bohr and B.R. Mottelson, Nuclear Structure (Benjamin, New York, 1969).
- [35] Note that the box distribution radii used in [18] are 4.6% larger than the Woods-Saxon radius parameters used by us. The values for given in [18] were scaled down by this factor.
- [36] NA49 Collaboration, H. Appelshäuser et al., Phys. Rev. Lett. 82, 2471 (1999).
- [37] For an approximately Gaussian initial transverse energy density profile GeV/fm3 at fm/ corresponds to an average energy density fm 4.5 GeV/fm3. Due to longitudinal Bjorken expansion this decreases with to fm GeV/fm3 at fm/. This value is consistent with fm/ GeV/fm3 as estimated from the measured transverse energy using Bjorken’s formula [38].
- [38] NA49 Collaboration, T. Alber et al., Phys. Rev. Lett. 75, 3814 (1995); WA98 Collaboration, T. Peitzmann et al., Nucl. Phys. A610, 200c (1996).
- [39] J. Bondorf, S. Garpman, and J. Zimányi, Nucl. Phys. A296, 320 (1978).
- [40] U. Heinz, K.S. Lee, and M.J. Rhoades-Brown, Phys. Rev. Lett. 58, 2292 (1987); K.S. Lee, M.J. Rhoades-Brown, and U. Heinz, Phys. Rev. C 37, 1463 (1988).
- [41] K.S. Lee, U. Heinz, and E. Schnedermann, Z. Phys. C 48, 525 (1989).
- [42] E. Schnedermann and U. Heinz, Phys. Rev. Lett. 69, 2908 (1992) and Phys. Rev. C 50, 1675 (1994); E. Schnedermann, J. Sollfrank, and U. Heinz, in Particle Production in Highly Excited Matter (H.H. Gutbrod and J. Rafelski, eds.), NATO Asi Series B 303 (1993) 175 (Plenum, New York).
- [43] U. Mayer and U. Heinz, Phys. Rev. C 56, 439 (1997).
- [44] S. Bernard, J.A. Maruhn, W. Greiner, and D.H. Rischke, Nucl. Phys. A605, 566 (1996); D.H. Rischke, in Hadrons in Dense Matter and Hadrosynthesis (J. Cleymans, H.B. Geyer, and F.G. Scholz, eds.), Springer Lecture Notes in Physics 516, 21 (1999).
- [45] K.A. Bugaev, Nucl. Phys. A606, 559 (1996); K.A. Bugaev and M.I. Gorenstein, nucl-th/9903072; K.A. Bugaev, M.I. Gorenstein, and W. Greiner, J. Phys. G 25, 2147 (1999).
- [46] J. Sollfrank, P. Koch, and U. Heinz, Z. Phys. C 52, 593 (1991); U.A. Wiedemann and U. Heinz, Phys. Rev. C 56, 3265 (1997).
- [47] P.F. Kolb, Diploma thesis, University of Regensburg, 1999, unpublished.
- [48] B. Kämpfer, A. Peshier, O.P. Pavlenko, M. Hentschel, and G. Soff, J. Phys. G 23, 2001 (1997).
- [49] C.M. Hung and E.V. Shuryak, Phys. Rev. C 57, 1891 (1998).
- [50] NA49 Collaboration, H. Appelshäuser et al., Eur. Phys. J. C 2, 661 (1998).
- [51] B. Tomášik, U.A. Wiedemann, and U. Heinz, nucl-th/ 9907096.
- [52] J. Kapusta, L. McLerran, and D.K. Srivastava, Phys. Lett. B 283, 145 (1992).
- [53] S.A. Bass et al., Nucl. Phys. A661, 205c (1999).
- [54] According to (18) the hadronic spectra from which and are calculated involve an integration over the freeze-out surface whereas is given by a spatial integral at fixed time (e.g. at ). We found that the difference is small since most particles freeze out during a very short time interval. This is in particular true at very high energies (see Fig. 4 in the first paper of Ref. [11]). Another difference between and is that the first implicitly sums the contributions from all particle species while the latter is defined in terms of the spectrum of a single particle species (in our case pions). The difference is small for pion-dominated systems like those studied here. For the same reason, however, the for protons or kaons may well differ from .
- [55] S.A. Voloshin and Y. Zhang, Z. Phys. C 70, 665 (1996).
- [56] P. Danielewicz, Phys. Rev. C 51, 716 (1995).
- [57] M. Bleicher and H. Stöcker, hep-ph/0006147.
- [58] The differing statement in [10] that this ratio should increase with decreasing impact parameter (see Fig. 5 in [10]) is incorrect. It is derived from schematic considerations which assume that elliptic flow scales like radial flow, not taking into account the earlier saturation of the former.
- [59] T. Biró, Phys. Lett. B 474, 21 (2000), and nucl-th/ 0003027.
- [60] A.M. Poskanzer, private communication.