Microscopic Universality and the Chiral Phase Transition in two Flavor QCD
Abstract
We re-analyze data from available finite-temperature QCD simulations near the chiral transition, with the help of Chiral Random Matrix Theory (chRMT). Statistical properties of the lowest-lying eigenvalues of the staggered Dirac operator for SU(3) lattice gauge theory with dynamical fermions are examined. We consider temperatures below, near, and above the critical temperature for the chiral phase transition. Below and above the statistics are in agreement with the exact analytical predictions in the microscopic scaling regime. Above we observe a gap in the spectral density and a distribution compatible with the Airy distribution. Near the eigenvalue correlations appear inconsistent with chRMT.
pacs:
PACS numbers: 11.10.Wx, 11.15.Ha, 11.30Rd, 12.38.GcI Introduction
It is inherent to the lattice approach to quantum field theory, that one has to extrapolate from finite lattices, finite statistics and non-critical coupling parameters to infinite lattices, infinite statistics and critical points. Since the result supposedly is a non-trivial, non-perturbatively defined quantum field theory, this process is plagued by uncertainties. A typical example of such a situation, where all these aspects combine, is the study of the thermal transition in QCD for small quark masses. One is interested in the continuum limit (gauge coupling ), small or vanishing fermion masses (), close to critical temperature () in the thermodynamic limit () — a formidable problem.
The extrapolations are always based on assumptions on the asymptotic behavior. Well known examples are scaling functions based on renormalization group and chiral perturbation theory — an expansion around a ground state with Goldstone bosons. Here we will examine another such approach, which should allow the extrapolation to infinite volume and vanishing fermion mass: Chiral Random Matrix Theory (chRMT).
A Chiral Random Matrix Theory
RMT attempts to identify universal features of ensembles of (random) matrices with common symmetry properties. Its chiral version, if successful, allows to separate two aspects of a theory like QCD: the general universal properties shared with other theories from the model-specific “dynamical” content of the theory. Microscopic eigenvalue distribution shapes are an example for the first aspect, expectation values of the fermion condensate for the second.
The limitations for validity of the chRMT considerations (for a given in the phase of broken chiral symmetry) are set by [1, 2]
| (1) |
where is the linear size of the system and is the mass of the lightest (pseudo-)Goldstone boson. The second restriction imposes that the pion does not fit into the space-time volume and it therefore appears to be unphysical. However, various correlators in the Dirac operator spectrum can be computed precisely in this limit.
chRMT has been proven to give exact analytical predictions for the spectrum of the Dirac operator in the microscopic limit [3]. The microscopic scaling region is simply a blowup of the origin in the spectrum. To be specific, one considers eigenvalues on the scale where is the chiral condensate, related to the spectral density per unit volume via the Banks-Casher [4] relation, . This regime is, by definition, only well defined in the spontaneously broken phase where . In the phase with restored symmetry the scale of interest is set by the density of states in the vicinity of the onset of .
Here we present a study of the microscopic correlators in the spectrum of the staggered Dirac operator in SU(3) gauge theory with dynamical fermions at finite temperature. Specifically we examine the low lying eigenvalue statistics at temperatures below, near, and above the critical temperature of the chiral phase transition.
Our analysis is based on the evaluation of the MILC collaboration’s gauge configurations [5, 6]. We therefore concentrate on the new aspects connected to RMT ideas for the spectral correlators of the Dirac operator. In particular for we study the singularity at the inner endpoint of the spectral density.
B Temperature transition
Strictly speaking, in the continuum limit , non-zero temperature is realized for lattices with and . In that limit, for vanishing quark mass , one expects a phase transition at . In [5] the critical temperature was estimated to lie between 143 and 154 MeV. For chiral symmetry is broken spontaneously, with massless pseudoscalars and ; above we expect restoration of this symmetry. Whereas for pure Yang-Mills theory the deconfinement transition is associated with a breaking of the center-symmetry with the Polyakov loop as order parameter, this symmetry is explicitly broken by the fermion action. Nevertheless, remnants of the original breaking feature of the Polyakov loop persist even for small fermion masses.
The nature of the chiral phase transition depends on the number of flavors . An argument based on a 3D -models analysis [7] predicts a first order phase transition for . For one expects a second order phase transition with scaling behavior. However, even first order behavior may be arguable [8, 9, 10]. For staggered fermions at non-vanishing lattice spacing the correct counting of flavors is unclear since flavor symmetry is restored only in the continuum limit. Staggered fermions (as simulated by MILC with the hybrid R-algorithm [11]) correspond to the case in the continuum limit. On coarse lattices the so defined fermions should show at least scaling behavior. For a discussion of the various scenarios cf. [12, 13, 14].
It is unclear whether the phase transition at extends towards or whether, when moving from lower to higher temperature, one just observes crossover-like behavior. Some evidence points towards this second scenario [15, 12]. In the following, we denote the crossover (phase transition) position by or simply .
II Expectations from chRMT
According to the nature of the elements in the random matrix, chRMT appears in three universality classes. In this paper we consider the SU(3) gauge theory with quarks in the fundamental representation, which belongs to the universality class of the chiral unitary ensemble (chUE). The partition function under study is [2, 16, 17]
| (3) | |||||
where is a block hermitian matrix (the elements of being random complex numbers), and is a deterministic, i.e. not-random, off-diagonal block matrix
| (4) |
Here d denotes the Haar measure, is an analytic function.
The predictions from chRMT concern the correlations between the eigenvalues of on the scale of individual eigenvalues in the thermodynamic limit . The matrix is the analogue of the massless Dirac operator in QCD. The chiral phase transition within chRMT is identified through the value of the spectral density of the eigenvalues of near zero, i.e. using the Banks-Casher relation.
Modeling the chiral phase transition in chRMT amounts to driving a depletion of eigenvalues of near the origin by means of some temperature parameter. Two separate approaches have been examined in the literature. First, the unitary invariant chRMT [2, 3], corresponding to (3) with , in which the chiral phase transition is driven by tuning . Second, the non-unitary invariant chRMT [16, 17, 18], corresponding to (3) with , where the deterministic block matrix mimics the effect of the temperature. In this paper we do not need to distinguish between the two approaches as they are consistent for the quantities measured here.
Below , i.e. when , chRMT predicts [19] the probability distribution for the smallest eigenvalue (for the trivial topological sector)
| (5) |
with
| (6) | |||||
| (7) | |||||
| (8) |
where is the spectral density at the origin for the massless situation (i.e. when in (3)). denotes the ’th modified Bessel function. This result is universal in the chRMT context, that is, the analytic form of does not change under deformations of provided that . After the identification ( is the physical volume in lattice units), (5) allows to extract (the fermion condensate in the chiral limit) from finite-volume Dirac spectra. Of course, in this the mild condition (1) must be satisfied.
Above , when there is a finite gap in the spectral density, the repulsion between the eigenvalue pair becomes negligible; chRMT hence predicts a soft inner edge, known as the Airy-solution [20, 21].
At — signaled in chRMT by a power-like behavior of the spectral density at small — , the prediction from chRMT is not unique. It turns out that the spectral correlators depend on the value of [22].
The distribution of the smallest eigenvalue is a spectral one-point correlation function and is quite sensitive to statistical fluctuations (see below). As an additional measure we also study a two-point correlator: the level spacing distribution . Note that the level spacings, , are determined in the unfolded spectrum . Unfolding separates the fluctuation properties of the spectrum from the supposedly smooth background behavior. The unfolded variable is defined in terms of the eigenvalue spectrum and the local average spectral density by
| (9) |
The RMT prediction for the level spacing distribution is well approximated by the unitary Wigner surmise
| (10) |
The level spacing distribution is not expected to be affected by temperature and masses in chRMT, see e.g. [23].
chRMT makes predictions for average spectral correlators in sectors with definite topological charge , i.e. derived assuming exact zero modes (these are not included in the predicted distributions; cf. [24] for the result of the weighted summation of all topological sectors). For Ginsparg-Wilson fermions [25], which realize chiral symmetry on the lattice, one may identify exact zero modes as resulting from topological excitations according to the Atiyah-Singer index theorem (for Wilson fermions one can hypothesize that zero modes are replaced by real modes). This is not the case for staggered fermions, where exact zero modes are absent away from the continuum limit [26] and even gauge configurations with non-vanishing topological charge do not give zero eigenvalues. Exact zero modes are here replaced by “almost” zero modes which accumulate to the origin in the continuum limit. In the strong coupling region the microscopic staggered Dirac spectra summed over all topological sectors show [27, 28] good agreement with the analytical prediction for the topologically neutral, , sector from chRMT. However, approaching weaker coupling observations contradicting this scenario have been found in a two-dimensional context [29].
Before turning to the numerical studies, let us comment on the validity of the chRMT predictions. The condition for application of chRMT in lattice analyses is well established when : The range in the unfolded spectrum over which the chRMT correlations dominate is [30, 31], where is the pion decay constant. An equivalent statement for is not known and no stringent tests of the low-lying eigenvalue statistics have been carried out so far.
Let us emphasize that even though the larger part of the studies of chRMT have been focused on the situation where , there is nothing wrong from first principles in using chRMT when .
III Gauge field configurations and analysis
By courtesy of the MILC collaboration [5] there are sets of gauge configurations [6] available to the lattice community. These were generated with two species of dynamical staggered fermions, at various lattice sizes, temperatures, values of the gauge coupling and small values of the bare fermion mass. In Table I the samples used in the present study are listed. For further details on the method of determination of the gauge configurations and the physical parameters we refer to [5].
| MILC-set | # conf’s | phase | ||||
|---|---|---|---|---|---|---|
| 124A | 61 | 12 | 4 | 5.25 | 0.0125 | |
| 124B | 91 | 12 | 4 | 5.26 | 0.0125 | |
| 124C | 126 | 12 | 4 | 5.27 | 0.0125 | near |
| 124D | 57 | 12 | 4 | 5.28 | 0.0125 | |
| 1241 | 42 | 12 | 4 | 5.25 | 0.008 | |
| 1242 | 50 | 12 | 4 | 5.255 | 0.008 | |
| 1243 | 45 | 12 | 4 | 5.26 | 0.008 | near |
| 1244 | 47 | 12 | 4 | 5.265 | 0.008 | near |
| 1245 | 42 | 12 | 4 | 5.27 | 0.008 | |
| 1246 | 40 | 12 | 4 | 5.28 | 0.008 | |
| FT01 | 30 | 24 | 12 | 5.65 | 0.008 | |
| FT03 | 131 | 24 | 12 | 5.725 | 0.008 | near |
| FT04 | 188 | 24 | 12 | 5.8 | 0.008 | |
| FT05 | 146 | 24 | 12 | 5.85 | 0.008 |
The massless staggered Dirac operator is anti-hermitian and therefore has purely imaginary eigenvalues, lying symmetric to the origin. We determine the lowest lying eigenvalues with help of the implicitly restarted Arnoldi method [32], using Chebyshev polynomials to improve the convergence.
The convergence speed depends on the separation between the eigenvalues. The configurations below therefore exhibit much slower convergence and for the determination is then quite time-consuming. Configurations that are supposedly above develop a gap for the smallest eigenvalue and the convergence of the diagonalization is faster. All eigenvalues have been obtained with a precision of at least 5 significant digits.
We have determined (on the positive imaginary axis) the lowest ten eigenvalues for the ensembles and the lowest eight eigenvalues for the ensembles.
The chRMT-prediction for the smallest eigenvalue distribution has been tested against quenched QCD [33, 34] and dynamical SU(2) [28] lattice simulations at ; there are also recent quenched QCD results for non-zero temperature [35]. RMT distributions for the bulk nearest-neighbor spacing in both, the confinement and the deconfinement phase of full QCD have been observed in [23] on lattices (Wigner surmise, see Eq. (10)).
IV Reporting the results
We now turn our attention to the measurement of the statistical properties of the Dirac operator. Starting with the distribution of all eigenvalues and then separating out the lowest and the second lowest eigenvalue we observe the first indication of a discrepancy with chRMT. In order to investigate this discrepancy further we study the level spacing distribution. Finally we focus on the inner edge of the spectrum for and measure the exponent for the singularity of the spectral density.
A Eigenvalue density
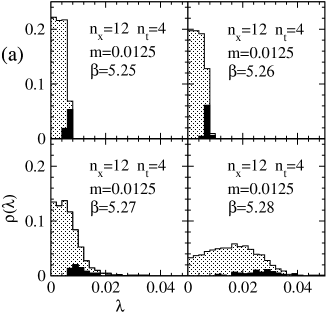
Fig. 1 gives the eigenvalue distribution as obtained from the lowest 10 (or 8 for the large lattices) eigenvalues for each configuration. It coincides with the distribution from all eigenvalues only up to the lowest of all 10th (8th) eigenvalues. In order to emphasize this feature we also plot the distribution histogram of this 10th (8th) eigenvalue in full black.
A remarkable change in the features of the distributions occurs around , as given in Table I. In particular for , a gap in appears for .
Since we do not know about the topological charge of most of the configurations studied here, we cannot separate the trivial from the non-trivial topological sectors, as would be required for a faithful comparison with chRMT distributions. For sufficiently rough lattices (i.e. in the

strong coupling region), one can argue [28] that the topological charge is effectively zero from the fermionic point of view; however this is no more the case for fine enough lattices [29] and the problem of the knowledge of the topological charge becomes critical. For the situation is completely different, since topological fluctuations are suppressed in the continuum theory.
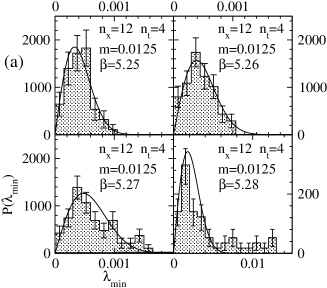
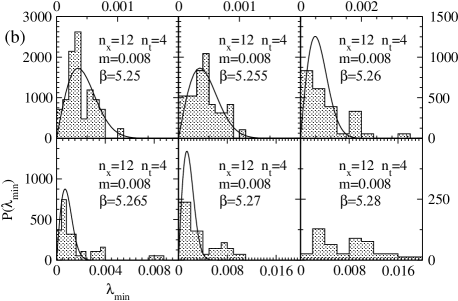

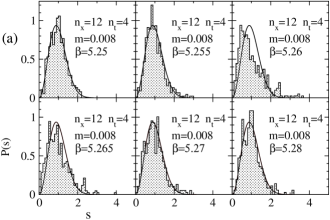
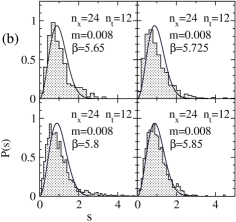
The “microscopic” distributions should be in the chUE universality class and prediction (5) should apply in particular for the smallest eigenvalue for . A fit of the corresponding prediction for the topologically trivial case () to the normalized data provides us with the (infinite volume) parameter . We assume the continuum symmetry, i.e. in (5). This one-parameter fit appears reasonable only for data concerning temperatures well below as indicated in Fig. 2(a). This is made explicit in Table II where the fitted values of together with the corresponding are reported; the latter increases with , and for (in agreement with Table I) prediction (5) becomes incompatible with data.
The formal chRMT expression (5) gives the eigenvalue distribution as a function of volume and fermion mass; the parameter (the spectral density at the origin) is thus defined implicitly as the extrapolation to infinite volume and vanishing fermion mass. From our fits – if the data follows chRMT formulas – should therefore be independent of the spatial lattice size and the fermion mass .
For e.g. , we find agreement of for and 0.008 within the errors. At the values disagree. This value of is, however, close to and the position of the phase transition (or crossover) is quite sensitive to . Such a change of the transition point is not accounted for in chRMT, which is not at all sensitive to the underlying dynamics of QCD.
For comparison we have to extrapolate the MILC values [5] for the chiral condensate both, to infinite volume and to vanishing quark mass. Since (except for chRMT) we have no firm prediction concerning the volume dependence, we just extrapolate the MILC results for the large lattices at and 5.725 linearly to vanishing quark mass. We know however that finite-volume effects on the condensate increase as the quark mass decreases. Therefore, it is not surprising that our linear extrapolation of MILC results tends to come out slightly but systematically smaller than the values we find in Table II.
The issue of the topological sector is likely to be particularly relevant for the finest lattice at our disposal (), where almost zero modes could be present and spoil the validity of the trivial sector predictions from chRMT. These could be the cause of the bump observed for small at , both in the spectral density and in the smallest eigenvalue distribution. It is therefore with some hesitation, that we compare the histograms for the smallest eigenvalues in Fig. 2 with these predictions.
| 12 | 4 | 5.25 | 0.0125 | 0.647(29) | 0.495 |
|---|---|---|---|---|---|
| 12 | 4 | 5.26 | 0.0125 | 0.571(26) | 0.562 |
| 12 | 4 | 5.27 | 0.0125 | 0.449(29) | 1.651 |
| 12 | 4 | 5.28 | 0.0125 | 0.138(13) | 2.129 |
| 12 | 4 | 5.25 | 0.008 | 0.686(37) | 0.368 |
| 12 | 4 | 5.255 | 0.008 | 0.551(52) | 1.218 |
| 12 | 4 | 5.26 | 0.008 | 0.459(43) | 1.379 |
| 12 | 4 | 5.265 | 0.008 | 0.331(39) | 2.517 |
| 12 | 4 | 5.27 | 0.008 | 0.168(21) | 2.806 |
| 24 | 12 | 5.65 | 0.008 | 0.0198(18) | 1.048 |
| 24 | 12 | 5.725 | 0.008 | 0.0063(60) | 5.063 |
In order to further investigate this feature, we studied (for the set with ) the influence of the configurations where the eigenvectors of the lowest eigenvalues exhibit a large contribution to the total chirality, i.e. . According to the index theorem, these configurations with large chirality, which make up roughly one half of the ensemble, tend to carry non-vanishing topological charge and therefore zero modes. Indeed we find that a substantial part (75%) of the first peak may be explained from these contributions.
These findings suggest that indeed topological modes are responsible for a low-lying peak in the distributions. Below all topological sectors are present and the low-lying eigenvalues have comparable magnitudes (their average position being roughly proportional to ). When the temperature approaches the theoretical expectation is that the topological fluctuations begin to be suppressed, although still present in the ensemble, quasi superimposed on the background distribution, which starts to broaden significantly with increasing temperature. Sufficiently far above only the topologically trivial sector survives and there may be no small eigenvalues at all. This is indeed what we actually observe for the lattice .
In a recent study of quenched configurations [35] there have been indications for a dilute gas of instanton–anti-instanton pairs producing a Poissonian distribution of small eigenvalues above . These may be suppressed or absent when considering dynamical fermions. In our context this seems to be the case for the finest lattices ( with ) at our disposal.
Fig. 3 gives the histograms for the 2nd smallest eigenvalues. Again we notice a dramatic change of the distribution shape around .

We interpret the sudden flatness of the distribution of the smallest eigenvalues as being (i) due to the vanishing spectral density and (ii) due to increasing statistical fluctuations near the chiral phase transition. The latter effect is not reproduced in chRMT since this is a zero dimensional and non-dynamical theory. Furthermore, the mutual overlap of and increases for . This is also inconsistent with chRMT. In order to study this effect further we now turn to the level spacing distributions.
B Level spacing distribution
Another observable with definite predictions from RMT (cf. Sect. II) is the distribution of level spacings. The advantage here is, that the level spacing should not be influenced by possible distortions of the smallest eigenvalues due to the unknown topological charge of the configurations (if the smallest eigenvalues are removed from the data).
The studies of the level spacing statistics in lattice data so far have shown a uniform picture consistent with the RMT prediction (10). The agreement extends on both sides of the confinement-deconfinement phase transition [23, 36]. However, to the authors’ knowledge there is no analytical prediction from chRMT for the level spacing distribution when focusing on the soft edge or at . So one might worry that the standard prediction, Eq. (10), is not appropriate when . Within the T-model of [16] for and , we have performed a numerical high statistics simulation to eliminate such doubt, and we there confirmed the distribution (10). (The T-model is defined by (3) with and in (4) chosen proportional to the unit matrix.)
Usually it is possible to get high statistics on the level spacing distributions since each configuration provides a large number of eigenvalue spacings. However, already the lowest 10 (or 8) eigenvalues allow for a crude estimate of the distribution shape.
Recall that the level spacing distribution is measured in the unfolded spectrum, see (9). Here we use the average spacings between contiguous eigenvalues to define the unfolded level spacings
| (11) |
In Fig. 4 we compare the data with the parameter-free theoretical expectation. Whereas below and above we find reasonable agreement with the theoretical expectation, there are clear discrepancies near . We observe unexpected high histogram entries. Since the average value by definition is 1 this then leads to a shift of the central peak to the left.
In order to further check our unfolding procedure, we also considered other approaches, e.g. using a average density as in (9) by smoothing our distribution in various ways. We furthermore tried to discard the higher lying eigenvalues, e.g. using only the lowest 5 level spacings or introducing a cutoff near the peak of the distributions in Fig. 2. In all those checks we found essentially the same behavior with discrepancies near .
In conclusion of this section, we observe at a breakdown of the otherwise universal microscopic spectral correlations. The dynamics of QCD plays an essential rôle in the phase transition. A RMT model where such dynamics is not there fails to account for the increased fluctuations in the eigenvalue level spacings.
C Soft inner edge
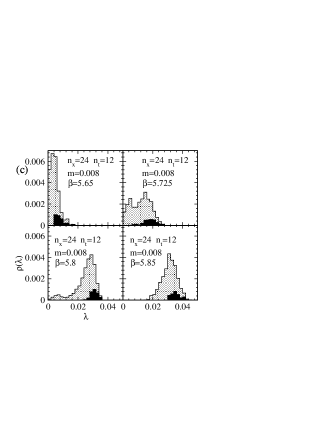
We now turn to the results for . In our results for at (Fig. 1(c)) a gap in the spectral distributions is obvious. However even at we may speculate, that a clear signal of a gap is only prevented by the (topological) quasi-zero modes responsible for the small bump at small eigenvalues.
Recall, that chRMT [16] predicts the presence of a gap in the spectral density of the Dirac operator centered around . Furthermore, the inner edge of this gap is predicted to show a singularity, at a point , in the macroscopic spectral density [37]
| (12) |
where is a known constant. The constant takes the value in the generic chRMT, i. e. without fine-tuning the matrix potential in (3) (which would be necessary in order to obtain higher values of ). This corresponds to a square-root-like eigenvalue density near .
One concern here is to measure . With the limited amount of data available it is not possible to do this based on the spectral density only. Instead we propose to study the average distance between the smallest and the sequel eigenvalues ; the extraction of is carried out by noting the following scaling relation in the index , ordering by size the eigenvalues which follow the smallest,
| (13) |
This proportionality follows by integration in (12).
In Fig. 5 we display the seven average distances, , from the ensemble of 146 configurations on a lattice for . We also exhibit the best fit to (13) with respect to , giving . Also shown are the corresponding curves for and . The value is clearly favored.

Since the two-point correlations behave as expected from RMT, we now turn to the one-point distribution. The microscopic behavior of the spectral density in the vicinity of this singularity is universal in the chRMT sense, but depends on the value of [37]. For the exact analytical prediction for the microscopic spectral density in the vicinity of the inner edge is [20]
| (14) |
Here the origin has been moved to the inner spectral endpoint by means of the rescaled eigenvalue , which is defined through
| (15) |
The consistency with the prediction (13) for and the approximate validity of chRMT correlations in the level spacing statistics above suggest that the Airy-density (14) corresponding to the value should fit the spectral density. If it does, then we can extract the inner-endpoint of the spectrum in the thermodynamic limit, by fitting with respect to to the lowest part of the spectral density, see Fig. 6.
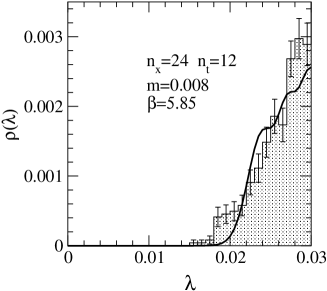
This fit does not convincingly confirm Airy density. However, the statistical fluctuations at this -value affect the one-point distribution substantially and prevent a decisive comparison.
V Summary and conclusions
We have examined the manifestations of the chiral phase transition in the microscopic spectral correlators for the Dirac operator. For the level spacing distribution, we find agreement with RMT below and above . Below the chRMT distributions allow us to determine condensate values with implicit consideration of lattice volume and quark mass dependence. This could in principle serve to improve the scaling analysis of the condensate near the chiral transition.
Near , however, the microscopic spectral statistics differs from the chRMT prediction. By measuring the Monte Carlo time evolution of the chiral condensate, Aoki et al. [15] have shown, that there are mixed phase signals, which, however, vanish towards larger volumes. The existence of a mixed phase would offer an explanation for the observed deviations from chRMT near . In that case the level spacing distribution near would be a mixture of those from the two phases. Such a mixture would lead to large spacings: the spacings are unfolded according to the average spacings of the total ensemble and not according to that of the separate phases.
The observed discrepancy from the RMT level spacing statistics may also be interpreted as an inclination towards Poissonian statistics; distribution shapes interpolating between Wigner and Poissonian statistics have been suggested by Brody [38].
As may be seen from the ensembles at and , a gap develops the spectral density for . This is consistent with the observed suppression of topological fluctuations in the latter ensemble [39]. For the ensemble we have measured the critical exponent characterizing the steepness of the density at the inner edge. The value is found to be compatible with 1/2. This is exactly as predicted by chRMT where the chiral phase transition is manifested by the crossover from the Bessel hard edge to the Airy soft edge. The indications of the Bessel to Airy scenario are suggestive but simulations with extended statistics are needed in order to quantify the observation. However, even with low statistics the -dependence of the distance between e.g. 8th and 1st eigenvalue provides an excellent means to identify the change of the phase.
At low , on coarse lattices, staggered fermions appear to be blind with regard to the topological charge of the gauge configurations, and the smallest eigenvalue distribution agrees with the chRMT distribution for the sector. As the lattice becomes finer, topology becomes more relevant. Although this is maybe “good” for the continuum limit of staggered fermions, it affects unfavorably the agreement with chRMT since the want-to-be-zero modes and the non-zero modes have similar eigenvalues, and begin to separate only when the non-zero modes are pushed to larger values when increasing the temperature.
Acknowledgements.
We want to thank the MILC collaboration for making available the gauge configurations, that we used in our analysis. Special thanks go to Jim Hetrick and Doug Toussaint for their help in accessing those and for the support in making additional ensembles public. Ph. de F. thanks Jim Hetrick and Jean-François Lagaë for their contribution at a preliminary stage of this project. K. S. would like to thank Andrew Jackson for discussions.REFERENCES
- [1] H. Leutwyler and A. Smilga, Phys. Rev. D 46, 5607 (1992).
- [2] E. V. Shuryak and J. J. M. Verbaarschot, Nucl. Phys. A 560, 306 (1993).
- [3] G. Akemann, P. H. Damgaard, U. Magnea, and S. M. Nishigaki, Nucl. Phys. B 487, 721 (1997).
- [4] T. Banks and A. Casher, Nucl. Phys. B 169, 103 (1980).
- [5] C. Bernard et al., Phys. Rev. D 54, 4585 (1996).
- [6] MILC collaboration, The MILC configurations are publicly available through the Gauge Connection on WWW-URL http://qcd.nersc.gov/.
- [7] R. D. Pisarski and F. Wilczek, Phys. Rev. D 29, 338 (1984).
- [8] F. Wilczek, Int. J. Mod. Phys. A 7, 3911 (1992); Erratum ibid. 6951.
- [9] K. Rajagopal and F. Wilczek, Nucl. Phys. B 399, 395 (1993).
- [10] K. Rajagopal, in Quark Gluon Plasma 2, edited by R. Hwa (World Scientific, Singapore, 1995).
- [11] S. Gottlieb, W. Liu, R. L. Renken, R. L. Sugar, and D. Toussaint, Phys. Rev. D 35, 2531 (1987).
- [12] E. Laermann, Nucl. Phys. B (Proc. Suppl.) 63, 114 (1998).
- [13] C. Bernard, T. Blum, C. E. DeTar et al., Nucl. Phys. B (Proc. Suppl.) 63, 400 (1998).
- [14] C. Bernard, C. DeTar, S. Gottlieb et al., hep-lat/9908008 (unpublished).
- [15] S. Aoki et al., Phys. Rev. D 57, 3910 (1998).
- [16] A. D. Jackson and J. J. M. Verbaarschot, Phys. Rev. D 53, 7223 (1996).
- [17] T. Wettig, A. Schäfer, and H. A. Weidenmüller, Phys. Lett. B 367, 28 (1996).
- [18] B. Seif, T. Wettig, and T. Guhr, Nucl. Phys. B 548, 475 (1999).
- [19] S. M. Nishigaki, P. H. Damgaard, and T. Wettig, Phys. Rev. D 58, 087704 (1998).
- [20] P. J. Forrester, Nucl. Phys. B 402, 709 (1993).
- [21] C. A. Tracy and H. Widom, Commun. Math. Phys. 159, 151 (1994).
- [22] G. Akemann, P. H. Damgaard, U. Magnea, and S. M. Nishigaki, Nucl. Phys. B 519, 682 (1998).
- [23] R. Pullirsch, K. Rabitsch, T. Wettig, and H. Markum, Phys. Lett. B 427, 119 (1998).
- [24] P. H. Damgaard, Nucl. Phys. B 556, 327 (1999).
- [25] P. H. Ginsparg and K. G. Wilson, Phys. Rev. D 25, 2649 (1982).
- [26] J. Smit and J. C. Vink. Nuc. Phys. B 286, 485 (1987).
- [27] P. H. Damgaard, U. M. Heller, R. Niclasen, and K. Rummukainen, hep-lat/9909017 (unpublished).
- [28] M. E. Berbenni-Bitsch, S. Meyer, and T. Wettig, Phys. Rev. D 58, 071502 (1998).
- [29] F. Farchioni, I. Hip, and C. B. Lang, hep-lat/9909132 (unpublished).
- [30] R. A. Janik, M. A. Nowak, G. Papp, and I. Zahed, Phys. Rev. Lett. 81, 264 (1998).
- [31] J. C. Osborn and J. J. M. Verbaarshot, Phys. Rev. Lett. 81, 268 (1998).
- [32] D. C. Sorensen, SIAM J. Matrix An. Appl. 13 357 (1992); R. B. Lehoucq, D. C. Sorensen and C. Yang, ARPACK User’s Guide (SIAM, New York: 1998).
- [33] P. H. Damgaard, U. M. Heller, and A. Krasnitz, Phys. Lett. B 445, 366 (1999).
- [34] R. G. Edwards, U. M. Heller, J. Kiskis, and R. Narayanan, Phys. Rev. Lett. 82 , 4188 (1999).
- [35] R. G. Edwards, U. M. Heller, J. Kiskis, and R. Narayanan, hep-lat/9908036 (unpublished).
- [36] B. A. Berg, H. Markum, and R. Pullirsch, Phys. Rev. D 59, 097504 (1999).
- [37] E. Kanzieper and V. Freilikher, Philosophical Magazine B 77, 1161 (1998).
- [38] T. A. Brody, Lett. Nuovo Cimento 7, 482 (1973).
- [39] Ph. de Forcrand, M. García Pérez, J. E. Hetrick, and I.-O. Stamatescu, Nucl. Phys. (Proc. Suppl.) 63, 549 (1998).