Equivalent of a Thouless energy in lattice QCD Dirac spectra
Abstract
Random matrix theory (RMT) is a powerful statistical tool to model spectral fluctuations. In addition, RMT provides efficient means to separate different scales in spectra. Recently RMT has found application in quantum chromodynamics (QCD). In mesoscopic physics, the Thouless energy sets the universal scale for which RMT applies. We try to identify the equivalent of a Thouless energy in complete spectra of the QCD Dirac operator with staggered fermions and lattice gauge fields. Comparing lattice data with RMT predictions we find deviations which allow us to give an estimate for this scale.
In recent years, RMT has been successfully introduced into the study of certain aspects of quantum chromodynamics (QCD). The interest focuses on the spectral properties of the Euclidean Dirac operator. For the massless Dirac operator with staggered fermions and gauge fields we solve numerically for each configuration the eigenvalue equation
| (1) |
The distribution of the gauge fields is given by the Euclidean partition function. Examples of the spectra are shown in Fig. 1, where the average level densities for and lattices are shown. It should be pointed out that we have resp. distinct positive eigenvalues of each configuration, so that there are millions of eigenvalues at our disposal.

As the gauge fields vary over the ensemble of configurations, the eigenvalues fluctuate about their mean values. Chiral random matrix theory models the fluctuations of the eigenvalues in the microscopic limit, i.e. near [1] as well as in the bulk of the spectrum [2]. Our main question is to what scales RMT does apply in QCD. In disordered systems the Thouless energy determines the scale in which fluctuations are predicted by RMT. Beyond this scale deviations occur. In QCD an equivalent of the Thouless energy is [3]. In the microscopic region it scales as
| (2) |
is the lattice volume, is the mean level spacing.
As argued in [4] a corresponding effect should also be
seen in the bulk of the spectrum.


The staircase function gives the number of levels with energy . In many cases it can be separated into
| (3) |
is determined by gross features of the system. contains the correlations to be analyzed. RMT makes predictions for the fluctuations on the scale of the mean level spacing. The influence of the overall level density must be removed by numerically unfolding the spectra through the mapping . For the new sequence we then have i.e. the mean level spacing is unity everywere where . The extraction of is highly non-trivial, because little is known analytically about the level density of QCD spectra.
However, there are several phenomenological unfolding procedures, e.g. ensemble unfolding, where one divides the energy range in bins of width and averages the density for each bin over all configurations. Then the staircase function , with is calculated. Furthermore there is configuration unfolding, where is fitted for each configuration to a polynomial of degree . Strong coupling expansions for with staggered fermions [5] and expansion of the QCD level density [6] motivate this ansatz. For technical details and further unfolding procedures see [7]. Whatever approach one uses, the mean number of rescaled levels in an interval of length in units of the mean level spacing should equal . This assures that the unfolded spectrum has mean level density unity.
We compared RMT predictions for two-point correlators with lattice data for two quantities. First, the level number variance, which measures the deviation of the number of eigenvalues in an interval from the expected mean number
| (4) |
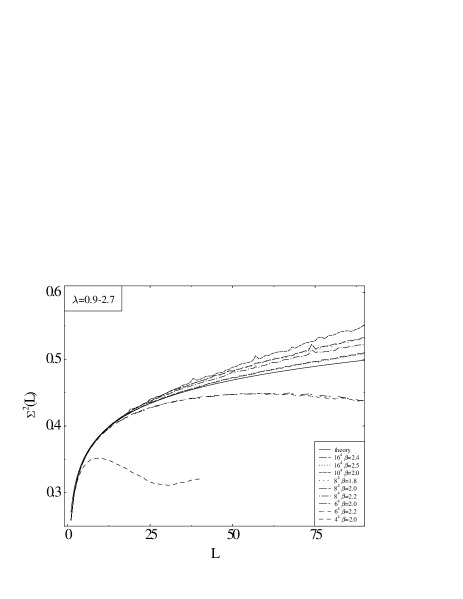
is the spectral average, the ensemble average. Thus, an interval of length contains on average levels. For uncorrelated Poisson spectra . RMT predicts stronger correlations: . The second two-point correlator we considered is the spectral rigidity, defined as the least square deviation of from the straight line
| (5) |
For this quantity RMT predicts . In Fig. 2 the RMT results for these statistical measures are compared with lattice data. The wealth of data allows us to analyze higher order correlations. Again we see good agreement (see Figs. 11 and 12 in [7]).

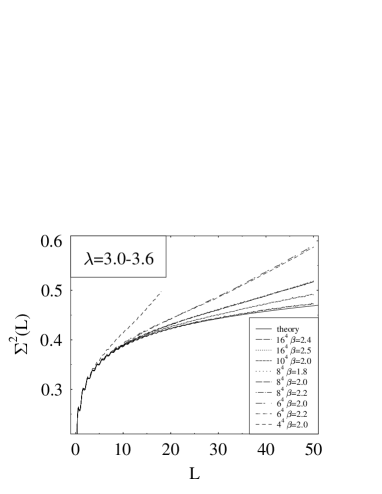
With ensemble unfolding of the data we obtain for the curves plotted in Fig. 3. Independently of the spectral region considered [7] and of we find that the point where the deviation sets in, scales as
| (6) |
This should be compared with the result obtained in [3] for the microscopic region
| (7) |
With polynomial unfolding the scaling law (6) vanishes. The deviation point appears to be the same for different lattice sizes (Fig. 4).
In order to find out, if these deviations are due to a Thouless energy, we performed a Fourier analysis of the oscillations of the staircase function [7]. From it we concluded that the deviations of the data obtained with polynomial unfolding are due to a non-polynomial-like part in the average level density and not to an equivalent of the Thouless energy.
In conclusion, analyzing some of the statistical properties of complete eigenvalue spectra of the Dirac operator for staggered fermions and gauge fields for various couplings and lattice volumes, we find the scaling behavior of the equivalent of the Thouless energy. Using ensemble unfolding, we have . The constant is approximately which is compatible with the result obtained in [3] for the microscopic region of the spectrum, where the scaling (7) was found. By unfolding each configuration separately, we do not see any scaling of this type. Hence the Thouless energy is due to fluctuations in the ensemble.
References
- [1] M.E. Berbenni, S. Meyer, A. Schäfer, J.J.M. Verbaarschot, T. Wettig, Phys. Rev. Lett. 80 (1998) 1146.
- [2] M.A. Halasz, J.J.M. Verbaarschot, Phys. Rev. Lett. 74 (1995) 3920; M.A. Halasz, T. Kalkreuter, J.J.M. Verbaarschot, Nucl. Phys. Proc. Suppl. 53 (1997) 266.
- [3] M.E. Berbenni, M. Göckeler, T. Guhr, A.D. Jackson, J.-Z. Ma, S.Meyer, A. Schäfer, H.A. Weidenmüller, T. Wettig, T. Wilke, Phys. Lett. B438 (1998) 14.
- [4] J.C. Osborn, J.J.M. Verbaarschot, Phys. Rev. Lett. 81 (1998) 268, Nucl. Phys. B525 (1998) 737.
- [5] J. Kogut, M. Stone, H.W. Wyld, S.H. Shenker, J. Shigemitsu, D.K. Sinclair, Nucl. Phys. B225 (1983) 326.
- [6] A.V. Smilga, J. Stern, Phys. Lett. B318 (1993) 531.
- [7] T. Guhr, J.-Z. Ma, S. Meyer, T. Wilke, Phys. Rev. D59 (1999) 054501.