Critical Behavior in Staggered Fermion Thermodynamics
Abstract
Quantum chromodynamics with two zero mass flavors is expected to exhibit a phase transition with O(4) critical behavior. Fixing the universality class is important for phenomenology and for facilitating the extrapolation of simulation data to physical quark mass values. Other groups have reported results from lattice QCD simulations with dynamical staggered quarks at , which suggest a departure from the expected critical behavior. We have pushed simulations to the largest volumes and smallest quark mass to date. Strong discrepancies in critical exponents and the scaling equation of state persist.
I Introduction
It is generally expected that two-flavor QCD undergoes a high temperature chiral-symmetry-restoring phase transition at zero quark mass with O(4) critical behavior[1]. Should the axial anomaly disappear simultaneously with the phase transition, the Pisarski Wilczek scenario then suggests a fluctuation-driven first order phase transition. Verifying these expectations is important for understanding the phenomenology of the transition and for facilitating an extrapolation of simulation data to physical quark masses. Since the staggered fermion scheme breaks the anomaly explicitly at nonzero lattice spacing, lattice QCD at fixed with staggered fermions, as a statistical system in its own right, is similarly expected to exhibit at least O(2) universality, with O(4) or a fluctuation-driven first-order phase transition emerging in the continuum limit . At the lattice spacing is coarse enough that, if there is a critical point at zero quark mass, O(2) is the only likely option.
The standard test of universality compares critical exponents. Comparing the critical scaling function itself gives further insight. To test for the expected universality we use the standard correspondence between QCD variables and O(N) spin variables, which identifies quark mass with magnetic field , inverse gauge coupling with temperature , chiral condensate with magnetization , and the action (plaquette) with the energy density. A critical point is expected to occur at zero quark mass and nonzero coupling . For studies at fixed , therefore, we define[2]
| (1) | |||||
| (2) |
Critical scaling theory predicts that for small quark masses we have the Fisher scaling relation [3]
| (3) |
where , and are scale constants, is the critical scaling function for QCD and is that for the appropriate universality class . Only the scale constants and are adjustable. Some critical exponents are given in Table I. Outside the Ginzburg scaling region, by definition, there are appreciable nonleading, nonscaling contributions to , analytic in and . In addition to corrections analytic in and , there are correction terms with subleading exponents, universal and nonanalytic in and . The mean-field scaling function is known exactly. For the O(4) scaling function we use results of a numerical simulation[4].
There is a similar scaling relation for the energy density. In QCD the energy density (plaquette) is dominated by gluon degrees of freedom, which are indirectly affected by the chiral singularity. So apparently there is a much larger analytic contribution. Consequently, we have found the plaquette observable much less useful for testing critical scaling. Here we concentrate on the scaling of .
In the next section we discuss an analysis of finite size effects, present a determination of some critical exponents, and compare our results with the critical scaling function. In the concluding section we suggest reasons for the discrepancies observed. A preliminary version of this study was presented at Lattice ’97 [5].
II Analysis of critical behavior
Our data set extends an old sample on lattice sizes with , and quark masses and 0.0125, which was generated with the standard one-plaquette gauge action plus two-flavor staggered fermion action. Our new simulations decrease the quark mass to and increase the spatial lattice size to 24 (aspect ratio 6). We also reanalyzed old data at , 8, and 12 [6]. The old data, unfortunately, are limited to aspect ratio . The extent of our data sample is given in Table II. Included in this table are values for global observables. For equilibration we typically dropped the first 300 molecular dynamics time units of each run.
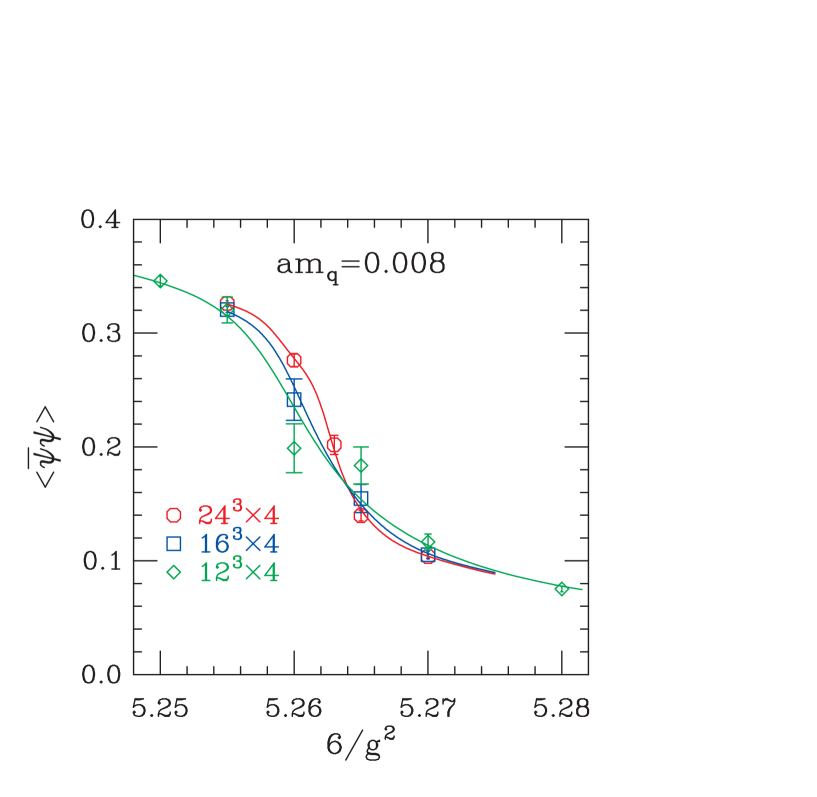
Over the range of nonzero quark masses considered, there appears to be no phase transition – only a crossover, as illustrated for in Fig. III. Evidently, however, the crossover steepens as the lattice volume is increased. The crossover, or “pseudo-critical point” is signaled by a peak in a susceptibility for any lattice size. For example the mixed plaquette/chiral condensate susceptibility, corresponding to the slope in Fig. III,
| (4) |
is plotted in Fig. LABEL:fig:pbpA for the lattice. Here, as well as in Fig. III, we use multihistogram reweighting to interpolate the data from the simulation points and locate the peak. The error analysis was performed with the jackknife method, which enables us to obtain reliable error estimates for both the peak height and location.
The peak location (crossover coupling ) shows little variation in lattice size for . For example the peak location in shifts from 5.2605(10) to 5.2623(6) as increases from 12 to 24, a scarcely significant change. It also shows little variation among the susceptibilities chosen. For example the peak location varies by over the susceptibilities considered. In all cases we take the result from the largest volume and assign an error of 0.002. Close to the critical point the peak position occurs at a fixed value of the scaling variable , so we have the scaling relation [2]
| (5) |
Shown in Fig. LABEL:fig:pseudo_crit_scaling is the trajectory of the pseudocritical point, fitted to both and mean-field predictions. Both fits are good. An fit would do equally well. Such agreement was first found by Karsch and Laermann and inspired hope that the simulations had entered the scaling region [2].
Problems with scaling were uncovered in studies at larger volumes [7, 8, 9]. In Figs. LABEL:fig:pbpA_ext_0125 and LABEL:fig:pbpA_ext_008 we plot the peak height of the susceptibility for two fixed quark masses. The increase in peak height with increasing volume reflects the steepening trend seen, for example, in Fig. III. It is necessary to extrapolate to infinite volume at each quark mass before checking scaling. We start by assuming the conventional scenario, in which the critical point occurs at . Then at nonzero mass, the susceptibility has a finite limit at large volume. We make an ad hoc choice for an extrapolation formula with the result shown in Figs. LABEL:fig:pbpA_ext_0125 and LABEL:fig:pbpA_ext_008.
| (6) |
The data covers the largest range of lattice sizes. Varying the inverse power of from 1/2 to 1 to 2 gives a slight preference for at this mass. Given the uncertainties in the values themselves, we feel it is safe to use any of these extrapolations, and we have chosen for all masses.
The extrapolated peak height of the susceptibility is expected to scale with decreasing quark mass. For this susceptibility, the expected scaling relation is
| (7) |
We compare this prediction with results from our analysis in Fig. LABEL:fig:pbpA_ext. Also shown are similarly extrapolated JLQCD values [9]. If we include all points in the fit, the scaling exponent is , compared with an prediction of — a clear disagreement, corroborating results of the JLQCD and Bielefeld groups [7, 8, 9]. However, it is evident in Fig. LABEL:fig:pbpA_ext that at the three lightest masses this observable alone does not exclude O(4). To test sensitivity to our extrapolation formula, we carried out the same analysis, replacing by and . The resulting scaling exponents are and , respectively, still clearly at variance with over the full mass range studied.
A similar fit of the plaquette susceptibility, , also including -extrapolated JLQCD results, yields a scaling exponent of , while the prediction is . The and extrapolations give and , respectively.
Because the crossover steepens so much with increasing lattice volume and small quark mass, it is worthwhile looking for evidence for two-phase metastability, signaling a first-order phase transition. Figure LABEL:fig:pbp.m008l24 shows the simulation time histories of our runs at . While we certainly see long correlation times, we see no evidence for a first order transition in these histories. In Fig. LABEL:fig:pbp_hot_cold we show time histories from hot and cold starts at (two hot and two cold starts) and at values of near the peaks of the susceptibilities. Again, there is no evidence for a first order transition.
We turn next to an analysis of the critical scaling function, given by Eq (3). Here, again, we assume that we are in the scaling region. The analysis then depends on which critical exponents we adopt. Using critical exponents from Kanaya and Kaya [10], we construct and compare with the scaling function for O(4) [4] in Fig. LABEL:fig:pbpnt4.change.5225. Essentially all of the data lie at positive , which permits a log-log plot. Vertical and horizontal displacements of the log-log scaling curves correspond to adjusting and . Clearly, no such displacement would result in good agreement. The newer data are plotted with octagons and squares. We observe: (1) The QCD curve falls with increasing steepness as the quark mass is decreased. Since the slope of the curve at the crossover gives the peak height of the susceptibility, the disagreement there is consistent with the observed lack of scaling of the peak height itself. (2) The new data at larger volume and smaller quark mass show generally worse agreement with the scaling curve. (3) The crossover regions, indicated in the QCD results by line segments and in the scaling function by a dashed line, are far from agreeing.
We show a similar comparison of the QCD scaling function with the mean-field prediction in Fig. LABEL:fig:pbpnt4.change.5235.mf. Again the disagreement is significant. Although we have not measured the scaling function, so cannot make a direct comparison, given the close similarity of the critical exponents with , we do not expect any improvement with that choice.
We conclude that if the theory falls in the or universality class, simulations at present masses do not reach the critical scaling region. Furthermore, as the quark mass is decreased over the present range, disagreement with scaling predictions worsens, offering little hope that we might be getting closer.
A similar analysis at larger is shown in Fig. LABEL:fig:pbp_o4. Perhaps there is improvement with increasing . However, our sample includes data only at a single quark mass, making it the weakest test. Furthermore, for we have no results for , where we first encountered difficulties at .
III Discussion and Speculations
We have seen that new simulations at smaller quark mass and larger volume at have raised doubts about the extent of the previously observed agreement between QCD and [2, 6]. The conventional staggered fermion action with the conventional choice of scaling variables does not show good agreement with the or mean field scaling functions at present quark masses and temperatures. (Wilson quarks with an improved gauge action seem to behave very differently [11].)
Believers in the conventional sigma model scenario could argue that the critical region is attained only when and correlation lengths are considerably greater than . Only in that case is the reduction of QCD to a three-dimensional sigma model well justified. Here, typically, these correlation lengths are smaller than . Still, the observed worsening of the agreement with decreasing quark mass is disturbing.
Recent results from simulations of the conventional staggered fermion action, augmented by a four-fermi term (“chiral QCD”) permit another speculation[12]. With the additional four-fermi interaction, Kogut, Lagaë, and Sinclair are able to carry out simulations at precisely zero quark mass. They find evidence for a first order phase transition at small four-fermi coupling. A nearby first order phase transition could spoil the approach to the critical point. Indeed, one cannot, therefore, rule out the possibility that the first order phase transition extends to zero four-fermion coupling for a small range of quark masses below the reach of our simulations. In this case, one expects a critical end-point at a nonzero quark mass in the Ising or mean-field universality class. At the same group finds evidence for a crossover instead of a first-order phase transition [13]. Thus, one may speculate that the conventional one-plaquette, staggered fermion action at is plagued by lattice artifacts large enough to obliterate the expected critical point, but these artifacts diminish at higher .
Acknowledgements.
This work was supported by the U.S. Department of Energy under grants DE–FG02–91ER–40661, DE–FG02–91ER–40628, DE–FG03–95ER–40894, DE–FG03–95ER–40906, DE–FG05–96ER–40979, DE–FG05–96ER–40979, and National Science Foundation grants NSF–PHY96–01227 and NSF–PHY97–22022. Calculations were carried out through grants of computer time from the NSF at NCSA and SDSC, and by the DOE at NERSC and ORNL. Some computations were carried out with the Indiana University Paragon.REFERENCES
- [1] R. Pisarski and F. Wilczek, Phys. Rev. D 29, 338 (1984).
- [2] F. Karsch and E. Laermann, Phys. Rev. D 50, 6954 (1994).
- [3] D.J. Amit, Field Theory, the Renormalization Group, and Critical Phenomena, (McGraw Hill, New York, 1978).
- [4] D. Toussaint, Phys. Rev. D 55, 362 (1997).
- [5] C. Bernard et al., Nucl. Phys. B (Proc. Suppl.) 63, 400 (1998).
- [6] C. Bernard et al, Phys. Rev. D 54, 4585 (1996).
- [7] A. Ukawa, Lattice ’96, Nucl. Phys. B (Proc. Suppl.) 53, 95 (1997).
- [8] G. Boyd, F. Karsch, E. Laermann, and M. Oevers, Talk given at 10th International Conference on Problems of Quantum Field Theory, Alushta, Ukraine, 13-17 May 1996. hep-lat/9607046 (unpublished).
- [9] S. Aoki et al. (JLQCD), Phys. Rev. D 57, 3910 (1998).
- [10] K. Kanaya and S. Kaya, Phys. Rev. D 51 2404, (1995).
- [11] Y. Iwasaki, K. Kanaya, S. Kaya, T. Yoshie, Phys. Rev. Lett. 78 179, (1997); S. Aoki, Y. Iwasaki, K. Kanaya, S. Kaya, A. Ukawa, and T. Yoshié, Nucl. Phys. B (Proc. Suppl.) 63, 397 (1998).
- [12] J. Kogut, J.-F. Lagaë, and D.K. Sinclair, Phys. Rev. D 58, 034504 (1998).
- [13] J. Kogut, J.-F. Lagaë, and D.K. Sinclair, Nucl, Phys. B (Proc. Suppl.) 73, 471 (1999).
| MF | ||||
|---|---|---|---|---|
| length | ||||||
|---|---|---|---|---|---|---|
| 12 | 1965 | |||||
| 12 | 2200 | |||||
| 12 | 2130 | |||||
| 12 | 2170 | |||||
| 12 | 2045 | |||||
| 12 | 1965 | |||||
| 12 | 2920 | |||||
| 12 | 4630 | |||||
| 12 | 7320 | |||||
| 12 | 2820 | |||||
| 12 | 2150 | |||||
| 12 | 2075 | |||||
| 12 | 1975 | |||||
| 16 | 2460 | |||||
| 16 | 1445 | |||||
| 16 | 1825 | |||||
| 16 | 1310 | |||||
| 16 | 4700 | |||||
| 16 | 4900 | |||||
| 24 | 950 | |||||
| 24 | 1698 | |||||
| 24 | 1703 | |||||
| 24 | 1702 | |||||
| 24 | 1700 | |||||
| 24 | 1950 | |||||
| 24 | 1760 | |||||
| 24 | 3126 | |||||
| 24 | 1760 | |||||
| 24 | 1950 |