CP-PACS results for light hadron spectrum in quenched and two-flavor full QCD
Abstract
We present a summary of our results for the light hadron spectrum in quenched lattice QCD and preliminary ones in two-flavor full QCD. For the quenched hadron spectrum we find that the mass formulae predicted by quenched chiral perturbation theory(QChPT) give a good description of our results. Employing the QChPT mass formulae for chiral extrapolations we conclude that the mass spectrum in the continuum limit deviates unambiguously and systematically from experiment. For our two-flavor full QCD results we focus on the dynamical quark effects on the light hadron spectrum.
I Introduction
Numerical studies of QCD on the lattice provide us a quantitative understanding of the dynamics of strong interactions. One of the main goals is to derive the hadron mass spectrum from the first principle. In order to give a precise prediction with lattice QCD simulations we have to control the following three physical sources of systematic errors besides the quenching error: (i) scaling violation, (ii) finite size effects and (iii) chiral extrapolations.
In the quenched approximation the GF11 collaboration carried out an extensive calculation to reduce these three systematic errors and found that the quenched spectrum is consistent with experiment within errors[1]. The aim of our work is to tell definitely how the quenched spectrum deviates from experiment, by considerably diminishing the statistical and systematic uncertainties.
On the other hand, in spite of much effort devoted in the full QCD spectrum study we have not yet been able to answer a fundamental question: to what extent the dynamical quarks affect the light hadron spectrum. Before embarking upon a realistic full QCD calculation in the future we attempt to settle this question.
In the first part of this report we present our results for the quenched light hadron spectrum, examining the validity of QChPT for the chiral extrapolation. The two-flavor full QCD results obtained so far are presented in the second part, where we investigate possible signs of dynamical quark effects on the light hadron spectrum. More details are found in Ref[2].
II Quenched light hadron spectrum with the Wilson quark action
A Details of numerical simulation
| [GeV] | [fm] | #conf. | |||||||||
|---|---|---|---|---|---|---|---|---|---|---|---|
| 0.752(1) | 0.692(1) | 0.593(1) | 0.491(2) | 0.415(2) | 0.106(5) | ||||||
| 0.751(1) | 0.684(1) | 0.581(2) | 0.474(2) | 0.394(3) | 0.103(6) | ||||||
| 0.760(1) | 0.707(2) | 0.609(2) | 0.502(2) | 0.411(3) | 0.117(7) | ||||||
| 0.759(2) | 0.708(3) | 0.584(3) | 0.493(4) | 0.391(4) | 0.113(13) | ||||||
Our simulations are carried out with the plaquette gauge action and the Wilson quark action. To control the systematic errors we carefully choose our run parameters, which are summarized in Table I. We employ four values so that the lattice spacing covers the range fm to remove the scaling violation effects by extrapolation of the data to the continuum limit. To avoid finite size effects we keep the physical spatial lattice size approximately constant at fm. A previous study showed that the finite size effects are or less already at fm[3]. The most subtle issue in controlling the systematic errors is associated with chiral extrapolations of the hadron masses. Although the mass formulae predicted by QChPT are considered to be plausible candidates for the fitting functions of chiral extrapolations, their validities should be checked employing a wide range of quark masses. At each value of we choose five values of the hopping parameter corresponding to , , , and . The heaviest two values and are taken to be around the physical strange quark mass. In terms of these quark masses we calculate hadron masses both for degenerate and non-degenerate cases.
Gauge configurations are generated with the 5-hit pseudo heat-bath algorithm incorporating the over-relaxation procedure quadruply and employing periodic boundary condition. Quark propagators are solved in the Coulomb gauge both for the point and the smeared sources with periodic boundary conditions imposed in all four directions. For the hadron mass measurement we use the smeared source quark propagators.
The physical point for the degenerate up and down quark mass is determined by and . For the strange quark mass we employ or . The lattice scale is set with .
B Chiral extrapolations
We first examine the validity of QChPT investigating the presence of quenched chiral logarithm in the pseudoscalar(PS) meson sector. For the quark mass dependence of the PS meson mass the QChPT predicts[4]
| (1) |
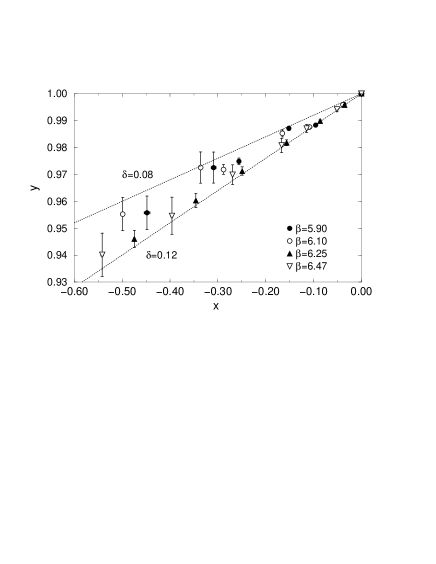
where and are masses of two valence quarks in the PS meson. This ratio diverges logarithmically toward the chiral limit due to the term. To detect the contribution of the term in a direct manner we introduce the two variables: and , for which eq.(1) leads to the relation . Here and are the degenerate PS mesons with quark mass or and is the non-degenerate one with and . It should be noted that the quark masses are defined by an extended axial vector current Ward identity(AWI) [5], where we are free from ambiguities originating from the determination of the critical hopping parameter . Figure 2 shows the distribution of as a function of . Our data fall in a wedge shaped with and . A PS meson decay constant ratio , for which QChPT predicts , is another quantitative test for . Our data indicate that the value of is within .
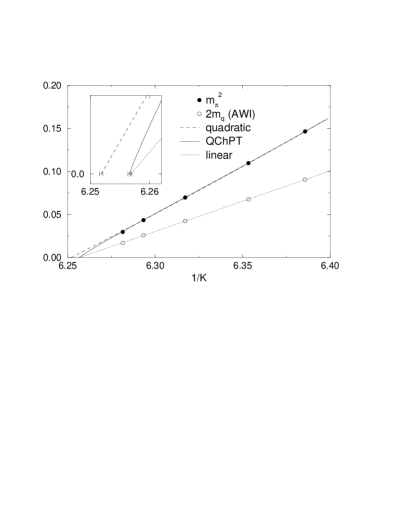
Since we observe clear evidence for the existence of the quenched chiral logarithm, we now try to fit the PS meson masses with the functional form of eq.(1). In Fig. 2 we show a typical result for chiral extrapolations of the degenerate PS meson mass and the AWI quark mass. There are two features to be remarked. One is a good description of the AWI quark mass with a linear function of , which means the AWI quark mass is proportional to the vector Ward identity(VWI) quark mass . The other is a good agreement between the critical hopping parameter determined from the QChPT fit of and that from the linear fit of . They are consistent within , which should be compared with () discrepancy for the case of a quadratic (cubic) polynomial fit of .
Our examinations for the chiral properties of the PS meson masses strongly suggest the validity of QChPT with . It would be legitimate to apply the QChPT mass formulae for the chiral extrapolation of the vector meson masses and the baryon ones.
For the vector meson masses we make simultaneous but uncorrelated fits of the degenerate and non-degenerate data employing the functional form predicted by QChPT:
| (2) |
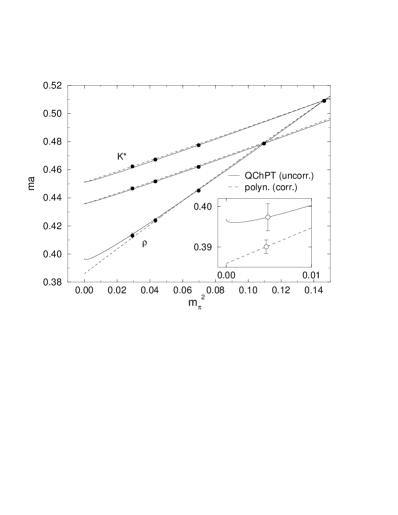
where with a phenomenological coupling constant of the vector meson quenched chiral Lagrangian. It should be noticed that the term is a characteristic of QChPT. This model function up to the terms describes our vector meson mass data well as illustrated in Fig. 4. A small bending toward the chiral limit found in the fitting result of reflects the contribution of the term. However, the fitted values for the coefficient of term are much smaller than expected. The average value of over four points gives , whose magnitude is ten times smaller than the phenomenological estimate with and . The magnitude of the term in eq.(2) is MeV, which means about a contribution to . If we employ the fitting function up to the terms, we find a few times larger value for at each beta. In this case, however, the fitting results are very unstable against the value.
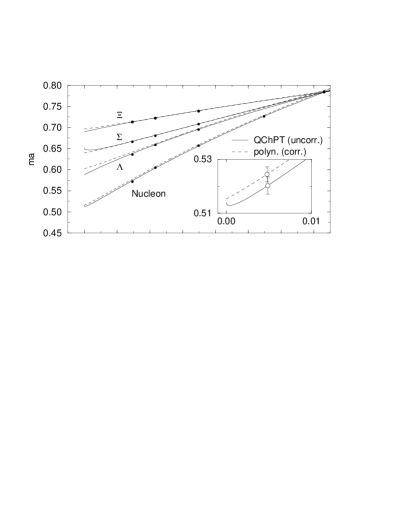
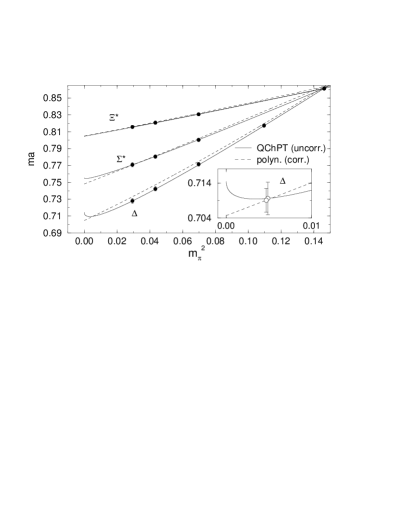
For fitting of the octet and decuplet baryon masses we take the same strategy as for the vector meson mass case. Assuming the QChPT mass formulae we fit the degenerate and non-degenerate data simultaneously without including correlations. While we find that and terms are sufficient to reproduce our decuplet baryon mass data as shown in Fig. 4, for the octet baryon masses a term is inevitably required to explain the convex curvature of the nucleon mass data. The fitted value for the coefficient of the term in the nucleon is as an averaged value over four points. This is less than half of the phenomenological estimate with , and . The term contribution to the nucleon mass is about MeV or . We find a similar value for . If the terms are included in the fitting function of the decuplet baryon masses, we obtain much smaller value for in .
Whereas we observe that the mass formulae based on the QChPT reproduce our data adequately, it is instructive to try another chiral ansatz employing polynomial fitting functions in (cubic for , quadratic for others). We employ independent fits for the different degeneracies in the vector meson and the octet and decuplet baryons. The fitting results are shown by dashed lines in Figs. 2, 4 and 4. Although the QChPT fits seem to give better descriptions of our hadron mass data than the polynomial ones, the differences between them are fairly small.
C Quenched light hadron spectrum in the continuum limit
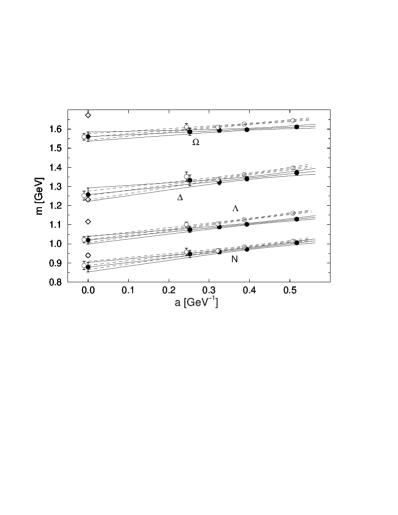
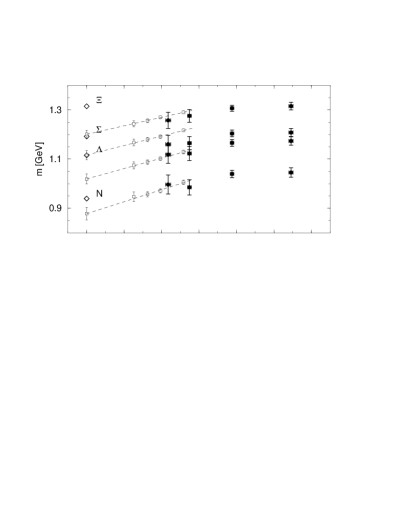
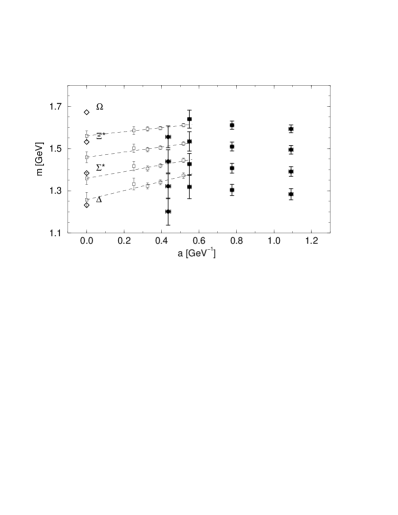
The lattice spacing dependences of the hadron masses are shown in Fig. 6. We expect that the leading scaling violation effects are of in the Wilson quark case. A linear extrapolation to the continuum limit assuming the fitting function yields GeV, for which we find that higher order terms are safely negligible, e.g., at GeV-1.
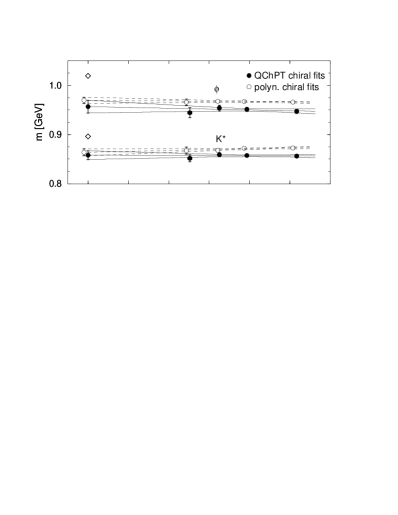
While the results of the QChPT fits and the polynomial ones differ by about () in the largest case after the chiral extrapolation at each , the differences in the continuum limit are within () of the results of the QChPT fits. At a few percent level of statistical errors it is hard to appreciate the differences between the QChPT chiral extrapolations and the polynomial ones.
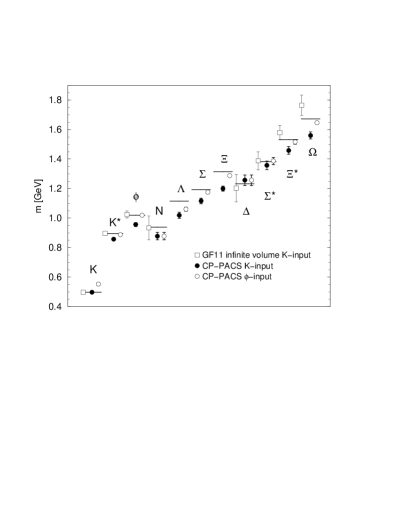
Our final result of the quenched light hadron spectrum is presented in Fig. 6. The spectrum deviates from experiment systematically and unambiguously. The following discrepancies should be noticed: The - meson hyperfine splitting is definitely underestimated by () for the input case and by () for the input case; The nucleon mass is appreciably smaller than experiment by (); For the strange octet baryon masses our data with the input are systematically smaller than experiment by (), which is much reduced in the input case; While the input leads smaller estimates for the decuplet mass splittings in average, we observe rather good agreement for the input results.
III Light hadron spectrum in two-flavor full QCD
A Details of numerical simulation
The simulation of full QCD requires a huge amount of computing time compared to the quenched approximation. In order to secure an adequate physical spatial lattice size for avoiding finite size effects, the lattice spacing is compelled to be coarse GeV, which urges us to employ improved actions. Our choice is a RG-improved gauge action[6] and the SW quark action[7] with a mean-field improved value of . This decision is based on a former comparative study of various combinations of improved gauge and quark actions at GeV[8].
Our full QCD study is performed with two flavors of sea quarks which are supposed to be the degenerate dynamical up and down quarks. Our simulation parameters are summarized in Table II. Four values covering the lattice spacing in the range GeV are employed to examine the scaling behavior of the light hadron spectrum. We keep the physical spatial lattice size approximately constant at fm except for the finest lattice where fm. At each value of we choose four values of sea quark mass corresponding to , , and . Gauge configurations including the dynamical sea quark effects are generated with the HMC algorithm.
We calculate hadron masses using the five valence quarks whose masses correspond to , , , and . Hadron propagators are constructed with the smeared source quark propagators at every fifth trajectory. Hadron masses are extracted by an exponential fit ignoring correlations between time slices. Errors are estimated by the jackknife method with a bin size of 10 configurations (50 HMC trajectories).
The light hadron spectrum is obtained by setting the sea quark mass on the physical up and down quark mass and the valence quark mass on the physical up and down quark mass or the strange one. The physical point of the degenerate up and down quark mass is fixed with and as input. For the strange quark mass the physical point is determined from or . The lattice scale is set with .
B Chiral extrapolations in the sea and valence quark masses
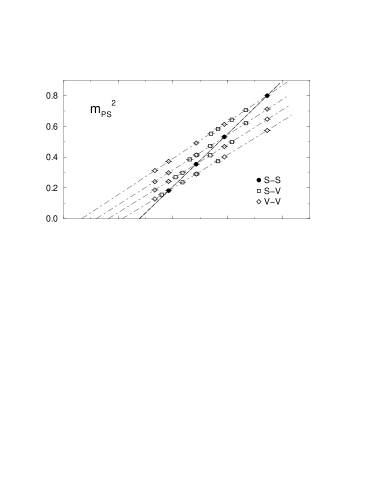
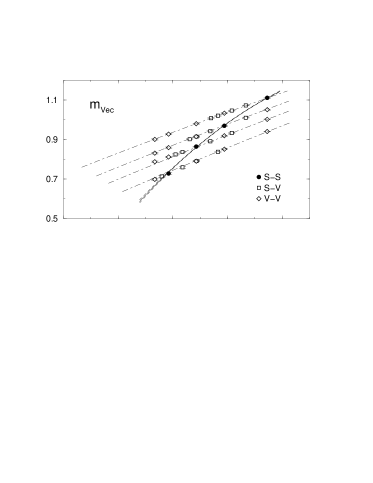
In Fig. 8 we plot a result for the sea and valence quark mass dependences of hadron masses at . The data are parameterized by the averaged hopping parameter of the two kind of valence quarks constituting the hadrons. represents a valence quark with and a valence quark with .
| [fm] | [fm] | for sea quarks | ||||||
|---|---|---|---|---|---|---|---|---|
| #traj. | ||||||||
| 1.80 | 0.215(2) | 2.58(3) | 0.8060(7) | 0.753(1) | 0.696(2) | 0.548(4) | ||
| 6250 | 5000 | 7000 | 5250 | |||||
| 1.95 | 0.153(2) | 2.45(3) | 0.8048(9) | 0.751(1) | 0.688(1) | 0.586(3) | ||
| 7000 | 7000 | 7000 | 5000 | |||||
| 2.10 | 0.108(2) | 2.59(5) | 0.806(2) | 0.757(2) | 0.690(3) | 0.575(6) | ||
| 2000 | 2000 | 2000 | 2000 | |||||
| 2.20 | 0.086(3) | 2.06(6) | 0.800(2) | 0.754(2) | 0.704(3) | 0.629(5) | ||
| 2000 | 2000 | 2000 | 2000 | |||||
We observe that the data of the meson masses are distributed on different four lines in accordance with the four sea quarks. Partially quenched data on each sea quark show almost linear behavior both for and . Their slopes, however, slightly depend on the sea quark masses: As the sea quark mass decreases the slope decreases for , while the slope increases for . In the - channel behaves almost linearly in , whereas exhibit a convex curvature. Chiral extrapolations of the meson masses are made by global fits of all the data assuming quadratic functions in terms of and . For the PS meson mass we employ
| (3) |
where bare quark masses are defined by and is the averaged value of two valence quark masses. Similar fitting function without the valence-valence cross term is used for the vector meson masses and the decuplet baryon masses. The fitting results for the meson masses are drawn in Fig. 8.
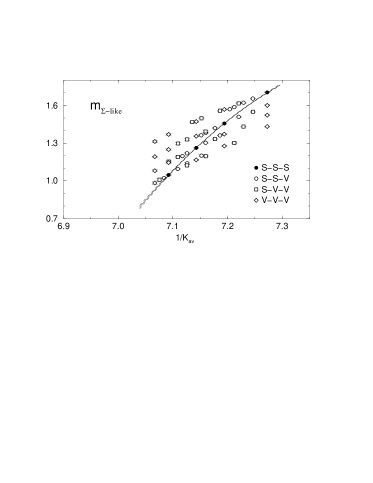
As for the octet baryon masses we find a rather complicated situation in Fig. 8: Partially quenched baryon masses are not functions of . For the fitting function we take a combination of linear terms based on the ChPT prediction and general quadratic terms of individual . This function has 12 free parameters in all, which are determined by a combined fit of -like and -like baryon masses.
C Sea quark effects on the light hadron spectrum
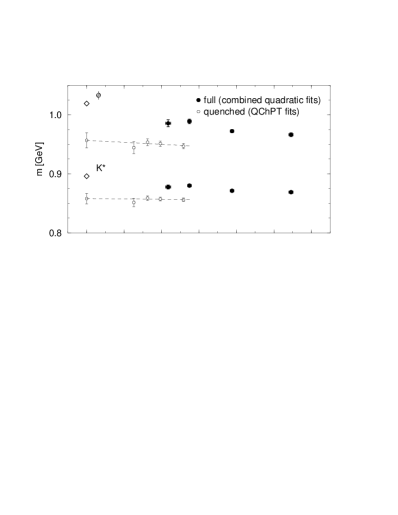
The results for the light hadron spectrum are presented in Fig. 8 as a function of the lattice spacing. For comparative purpose we also plot the quenched results(open symbols) from the last section, which would help us distinguish the dynamical sea quark effects.
We observe an intriguing feature in the meson sector: The and meson masses in full QCD are heavier than those in quenched QCD at finite lattice spacing and become closer to experimental values as the lattice spacing decreases. However, our full QCD results do not necessarily agree with experiment in the continuum limit. We have two possible reasons. One is the relatively heavy sea quark masses corresponding to , for which the chiral extrapolations are rather ambiguous. The other is the quenched treatment of the strange quark.
For the baryon sector it is hard to read any meaningful implication in comparison between the full QCD results and the quenched ones. At the finite lattice spacing the full QCD spectrum is consistent with the quenched ones within rather large errors, while the lattice spacing dependence of the decuplet baryon masses in full QCD is opposite to that in quenched case.
IV Conclusions
We have presented our results for the quenched light hadron spectrum. After examining the validity of QChPT in the pseudoscalar meson masses we applied its hadron mass formulae to the chiral extrapolations. Although the QChPT predictions reproduce our hadron mass data well, for the vector meson and baryon masses it is hard to confirm the contributions of the term specific to QChPT. The spectrum in the continuum limit deviates systematically and unambiguously from experiment on a level of about far beyond the statistical error of for mesons and for baryons.
Our full QCD study is an exploring step toward a realistic QCD simulation. For the light hadron spectrum we found an encouraging result that the deficiency of the meson hyperfine splitting in the quenched approximation is largely compensated with the dynamical sea quark effects. At this stage, however, the most important conclusion is as follows: To perform a close investigation of the sea quark effects we need a direct comparison between the full QCD results and the quenched ones employing the same gauge and quark actions with the same , and . Work in this direction is now in progress.
I am grateful to all the members of the CP-PACS Collaboration for their help in preparing this manuscript. I would particularly like to thank R. Burkhalter and T. Yoshié. This work is supported in part by the Grants-in-Aid of Ministry of Education(Nos. 08NP0101 and 09304029).
REFERENCES
- [1] F. Butler et al., Nucl. Phys. B430, 179 (1994).
- [2] CP-PACS Collaboration, S. Aoki et al., hep-lat/9809146; R. Burkhalter, hep-lat/9810043.
- [3] MILC Collaboration, C. Bernard et al., Nucl. Phys. B (Proc. Suppl.) 60A, 3 (1998).
- [4] C. W. Bernard and M. F. L. Golterman, Phys. Rev. D46, 853 (1992); S. R. Sharpe, Phys. Rev. D46, 3146 (1992); J. N. Labrenz and S. R. Sharpe, Phys. Rev. D54, 4595 (1996) M. Booth et al., Phys. Rev. D55, 3092 (1997).
- [5] M. Bochicchio et al., Nucl. Phys. B262, 331 (1985).
- [6] Y. Iwasaki, Nucl. Phys. B258, 141 (1985).
- [7] B. Sheikholeslami and R. Wohlert, Nucl. Phys. B259, 572 (1985).
- [8] CP-PACS Collaboration, S. Aoki et al., hep-lat/9902018.