UTCCP-P-52
Oct. 1998
Recent Results from the CP-PACS Collaboration
Abstract
We present an overview of recent results from the CP-PACS computer on the quenched light hadron spectrum and an on-going two-flavour full QCD study. We find that our quenched hadron mass results are compatible with the mass formulae predicted by quenched chiral perturbation theory, which we adopt in our final analysis. Quenched hadron masses in the continuum limit show unambiguous and systematic deviations from experiment. For our two-flavour full QCD simulation we present preliminary results on the light hadron spectrum, quark masses and the static potential. The question of dynamical sea quark effects in these quantities is discussed.
1 Introduction
Calculating the light hadron spectrum from first principles has been one of the main objectives of lattice QCD since its formulation[1]. Pioneering attempts towards this goal in the quenched approximation[2] were followed by an increase of understanding and control of various systematic uncertainties due to finite lattice spacing, finite size and the problem of chiral extrapolations. An outstanding effort carried out by the GF11 collaboration[3] led to a quenched spectrum agreeing within 5–10% with experiment. With its history quenched QCD can therefore be considered as a matured field where an additional increase of calculational accuracy will finally tell us how the quenched spectrum deviates from experiment.
Last year the CP-PACS collaboration presented first results of an effort in this direction[4]. The simulation has been completed in the meantime and the final results have been presented at this conference[5].
Progress in the full QCD spectrum study has been comparatively slower. Even though full QCD simulations have a history almost as long as quenched ones[6], the field is still at an exploring stage. In particular how in detail the spectrum is influenced by the presence of light sea quarks has not yet been fully answered[7]. Recently the CP-PACS collaboration undertook a further step in the direction of a realistic full QCD simulation. At this conference first preliminary results have been presented[8, 9, 10, 11].
In this article we present an overview of the two calculations of the CP-PACS collaboration described above. In the first part we discuss in detail our final results for the quenched hadron spectrum, devoting some length to the issue of chiral extrapolations. In the second part we switch to full QCD where we present our main results, focussing on whether effects from sea quarks can be seen.
2 Simulation of Quenched QCD with the Standard Wilson Action
We list the parameters of our quenched simulation in Table 1, where the partition size of the CP-PACS computer employed and the execution time for one cycle of configuration generation and hadron propagator calculations are also given for each lattice size.
The runs are performed on four lattices covering the lattice spacing in the range –4 GeV for extrapolation to the continuum limit. The physical lattice size in the spatial direction is chosen to be around fm where finite size effects are expected to be negligible. Gauge configurations are generated with over-relaxation and heat bath algorithms mixed in a 4:1 ratio.
For each value of quark propagators are calculated for five quark masses corresponding to of about 0.75, 0.7, 0.6, 0.5 and 0.4. The first two values are taken to be around the strange quark for interpolation, and the last value is our attempt to control chiral extrapolations better than in previous spectrum studies with the Wilson quark action. We calculate hadron masses for equal as well as unequal quark masses so that we can determine the complete light hadron spectrum with degenerate and quarks and a heavier strange quark.
Since Lattice 97 we have increased the number of configurations from 91 to 150 at . For technical details of the simulation we refer to [4].
| size | # | # | hrs/ | |||
|---|---|---|---|---|---|---|
| [GeV] | [fm] | conf | PU | conf | ||
| 5.90 | 1.934(16) | 3.26(3) | 800 | 256 | 3.0 | |
| 6.10 | 2.540(22) | 3.10(3) | 600 | 512 | 4.8 | |
| 6.25 | 3.071(34) | 3.08(3) | 420 | 1024 | 6.8 | |
| 6.47 | 3.961(79) | 3.18(6) | 150 | 2048 | 15.5 |
3 Chiral Extrapolation in Quenched QCD
Extrapolation to the chiral limit is a major nontrivial component of light hadron spectrum calculations[12]. In addition to the difficulty that simulations are done far from the chiral limit there is the issue of the choice of the functional form of hadron masses as a function of the quark masses. In considering this issue it should be asked whether the actual data supports the validity of quenched chiral perturbation theory (qPT) [13, 14, 15, 16, 17], which predicts characteristic singularities in hadron masses in the chiral limit. One also has to examine how results differ if different possible fitting functions are employed. In the following we examine these questions in detail.
3.1 pseudoscalar meson sector
The dependence of the pseudoscalar (PS) meson mass on its two valence quark masses and is predicted by qPT to have the form [14]
| (1) | |||||
To test whether our data is consistent with the presence of a logarithmic term we plot in Fig. 1 the ratio of the PS meson mass squared to the quark mass. We employ quark masses determined from an extended axial current Ward identity (AWI), , avoiding ambiguities due to the determination of the critical hopping parameter. We see a clear increase of the ratio for small quark masses in agreement with (1).

A more quantitative test can be made by forming the two variables
| (2) | |||||
| (3) |
where and are degenerate pseudoscalar mesons with an equal quark mass of or , and is the non-degenerate meson. The two quantities are related by
| (4) |
if the term in (1) is ignored. In Fig. 2 we plot our mass data in terms of and for two choices of ( 0.75 or 0.7) and three for ( 0.6, 0.5 or 0.4). All our data lie within a narrow wedge bounded by two lines corresponding to –0.12.
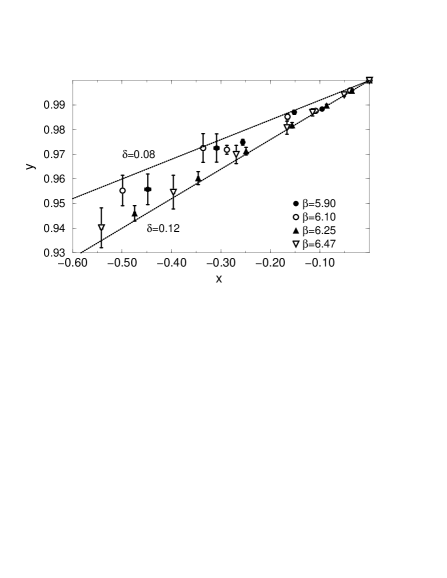
The mass ratio originally proposed[14] has corrections due to both quadratic terms in (1). For this ratio we find that our data does not lie on a common line, indicating that the inclusion of the term is important for the description of our data.
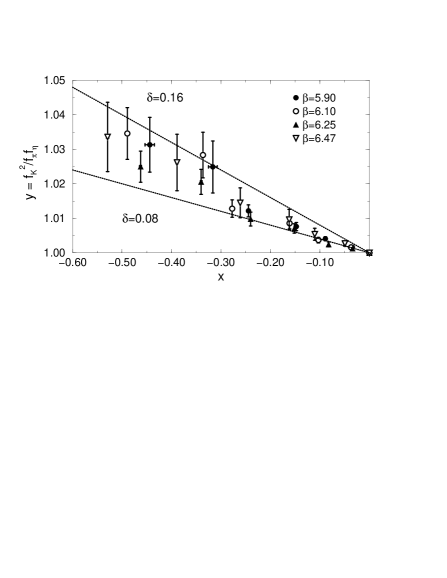
A different test uses a ratio of decay constants [15]; the quantity from (2) and are related by . As shown in Fig. 3 the data lies again in a wedge, bounded by two lines corresponding to –0.16.
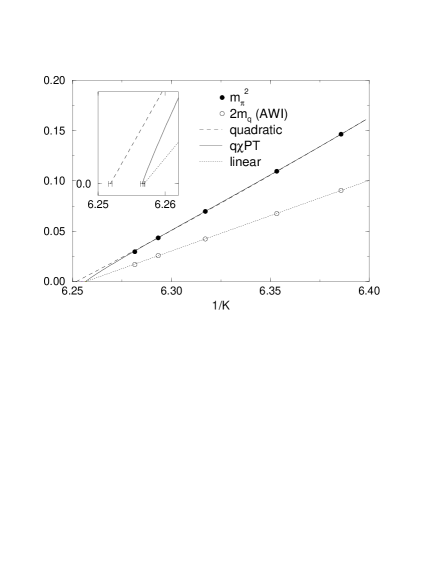
Having seen evidence for quenched chiral logarithms in the above tests, we fit the pseudoscalar meson mass with (1), taking into account the correlation between meson masses at different quark masses. We drop the quadratic term proportional to since the mass test (2) and (3) suggests its effect to be small. The fits are done in terms of since it has no statistical error, which means that we use the quark mass derived from the vector Ward identity (VWI), .
In Fig. 4 we show the degenerate pseudoscalar meson mass at as a function of together with fit curves from (1). Results for a quadratic fit in (dashed lines), and the AWI quark mass data with a linear fit (dotted line) are also plotted. We observe that the AWI quark mass is well described by a linear function in . This means that a proportionality holds between the two definitions of quark mass, which in turn justifies our use of different quark mass definitions for mass tests and fitting. Another important feature is a good agreement of the critical hopping parameter from the qPT fit of pseudoscalar meson masses and from a linear fit of AWI quark masses, whereas they differ by as much as if a quadratic fit is employed for the pseudoscalar meson masses.
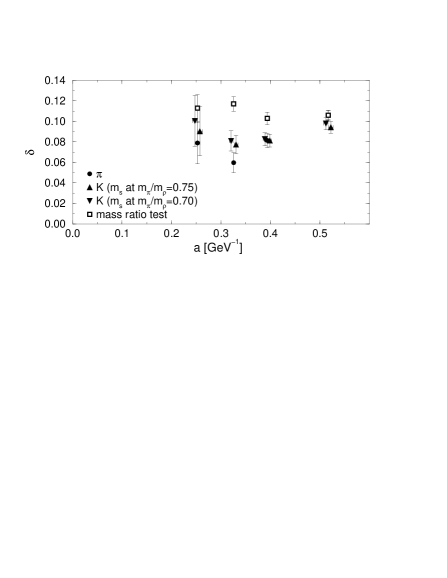
Results for the parameter obtained from the fit are shown in Fig. 5 as function of the lattice spacing for degenerate and non-degenerate data separately. Values obtained with a linear fit of the mass test in Fig. 2 are also shown (open squares). At each value of , the results of independent fits to degenerate and non-degenerate masses agree with each other within error bars. The values from the mass test are somewhat higher in comparison. Overall however, all the results for are mutually in reasonable agreement.
To summarize our examinations in the pseudoscalar sector, we find the two different direct tests to provide a positive evidence for the presence of qPT logarithms. The value of is in the range .
3.2 vector meson sector
For vector meson masses qPT gives[16]
| (5) | |||||
| (6) | |||||
where with a phenomenological coupling constant of the vector meson quenched chiral Lagrangian.
An examination of mass ratios such as calculated for our data indicates a small negative value in the chiral limit. The evidence, however, is less compelling than for pseudoscalar mesons because a chiral extrapolation is needed in order to extract .
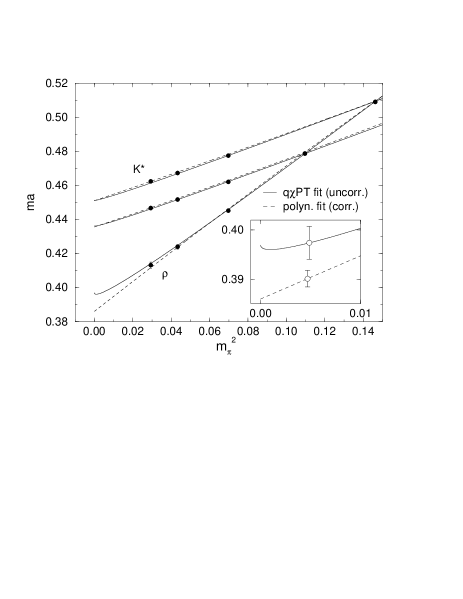
As an alternative analysis we attempt to fit data with the predicted forms (5,6). To examine whether our data exhibits the full pattern of dependence on pseudoscalar masses we employ a simultaneous fit to degenerate and non-degenerate masses. Such a combined fit involves a large number of data points, for which we find only uncorrelated fits to be practically feasible.
This fit reproduces our vector meson mass data well as illustrated in Fig. 6. Clearly visible in the fit curve for (solid line) is the effect of the term, giving rise to an increase close to the chiral limit. The magnitude of the effect, however, is small, and this holds for all . Correspondingly, small negative values for are found from the fits (see Table 2), consistent with indications from mass ratio tests. The average of over gives , which is ten times smaller compared to the phenomenological estimate (for and ).
3.3 baryon sector
For the baryons we find a situation for mass ratio tests less conclusive than for vector mesons. Therefore we follow the same strategy and fit masses of different degeneracies simultaneously. We assume qPT mass formulae [17], i.e. for octet baryons
| (7) | |||||
| (8) | |||||
and for decuplet baryons
| (9) | |||||
where and are and meson masses and , and is the pion decay constant.
These forms are slightly simplified compared to the full formula in order to get stable fits. For decuplet baryons all leading linear terms in and all quadratic terms are included, but not the cubic terms . For octet baryons, on the other hand, a bending in the nucleon mass data necessitates a retention of such terms; we keep those arising from the octet-octet couplings and , but not those due to the decuplet-octet coupling . We also note that MeV and are fixed in the fits.
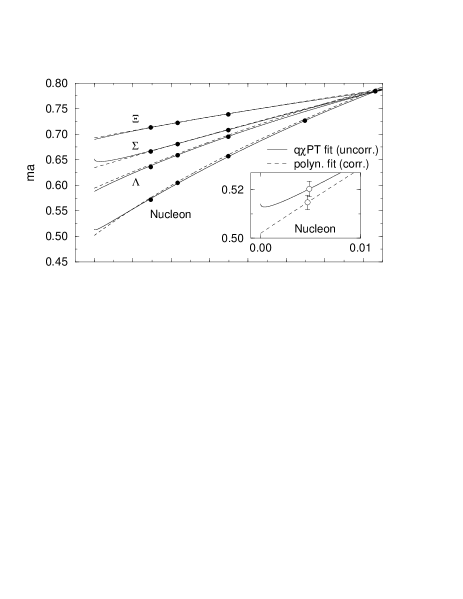
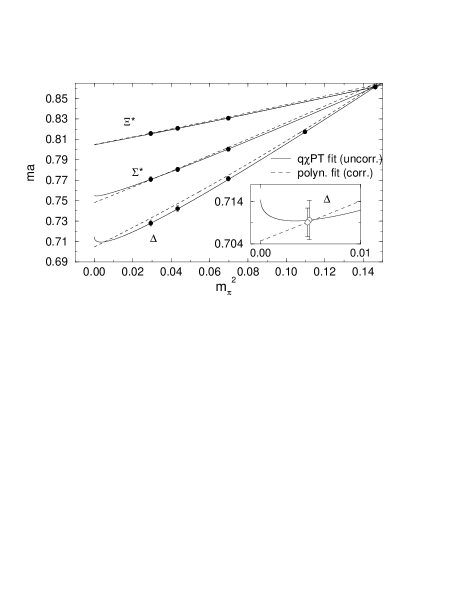
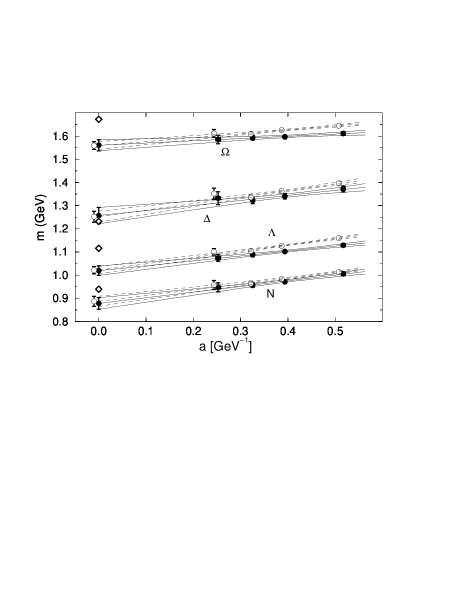
The result of the mass fits to octet and decuplet baryons is shown at in Fig. 7. The increase of masses close to the chiral limit as a quenched artifact is visible in the fit curves for the nucleon, , and , but is small compared to the error after extrapolation. For the nucleon the coefficient of the term obtained from the fits has an average value (see also Table 2). This is considerably smaller than a phenomenological estimate for which , and , estimated from experiment[18] are used. The contribution of this term to the nucleon mass is therefore about 2% or 15 MeV. A similar value is found for .
Summarizing, our data does not provide direct evidence for the validity of qPT in vector meson and baryon sectors. However, qPT formulae describe the overall pattern of the data well, with the fit parameters taking reasonably constant values at different values of . Our data is therefore compatible with the presence of terms. Their magnitudes are smaller than expected, amounting to about 2% of vector and baryon masses.
3.4 polynomial chiral fits
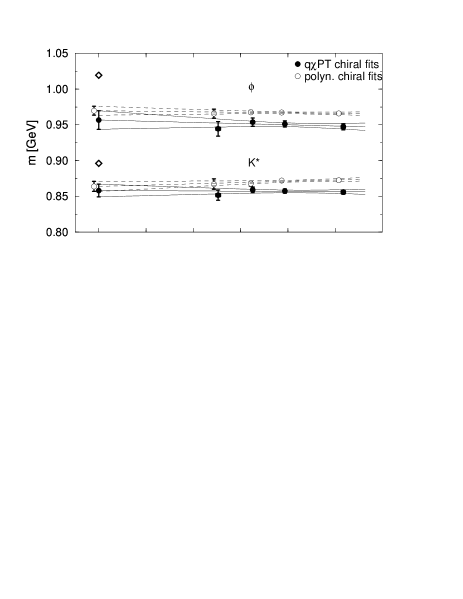
In order to investigate the effect of choosing different fitting functions we have also made chiral extrapolations employing polynomials in (cubic for , quadratic otherwise). Hadrons of different degeneracies are fitted independently and correlations between different quark masses are taken into account. The results of these fits are already plotted for each channel in Figs. 4, 6 and 7 by dashed lines. The continuum extrapolations with qPT and polynomial fits are compared in Fig. 8 for meson masses and typical baryon masses.
The two types of fits do lead to different results after chiral extrapolation at each , which can be as significant as in the largest case. In absolute magnitude, however, this difference corresponds to 2–3% at most. Furthermore, after continuum extrapolation, the results from polynomial fits do not differ beyond 1.5% from the values obtained with qPT fits, which is a effect.
We conclude that qPT and polynomial chiral extrapolations, while possibly leading to sizably different continuum values in principle, actually yield results which do not differ beyond a 2% level.
4 Quenched Light Hadron Spectrum
Based on the results of analyses described in Sec. 3 we choose chiral extrapolations using qPT formulae for the calculation of our final spectrum results. The physical point for the degenerate and quarks is fixed by (135.0) and (768.4), and we use (497.7) or (1019.4) for the quark. The lattice scale is set with .
We observe in Fig. 8 that the continuum extrapolation is well described by a linear function in the lattice spacing. Indeed, if we parameterize the -dependence as , we find the typical scale to be GeV. Hence higher order terms are expected to be small, e.g., at . We thus employ a linear continuum extrapolation. We present our final result for the quenched light hadron spectrum in Fig. 9.
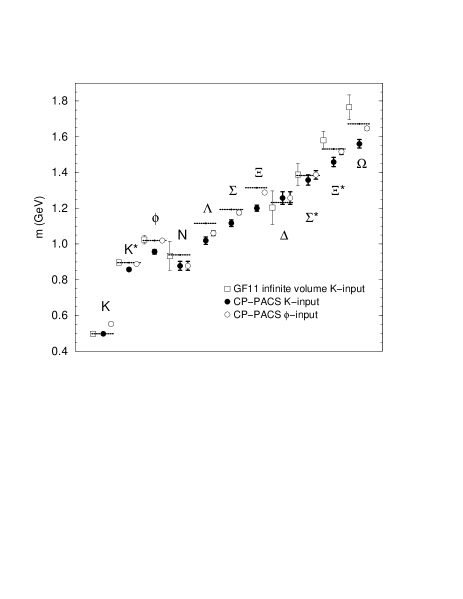
This figure shows that the quenched light hadron spectrum systematically deviates from experiment. If one uses as input to fix the quark mass, the mass splitting between and () in the meson sector is underestimated by 9.5% (12%), which is a 4.3 (4.9 effect. In the baryon sector, the octet masses are smaller, by 7.6% (4.5) on the average, and the decuplet mass splittings are 30% (1.1 for individual level spacings, but 3.2 for the splitting) short of the experimental splitting. With as input, the meson mass is in agreement with experiment, and the discrepancies in the baryon masses are reduced. However, the meson hyperfine splitting is still smaller by 16% which has a statistical significance of 6.1.
These conclusions remain unchanged compared to those presented at Lattice 97 [4], where we employed a linear chiral extrapolation in (cubic for and quadratic for ), except in numerical details for individual channels. The most conspicuous change is the decrease of the nucleon mass away from the experimental value, and that of the mass toward it. Strange baryon masses with as input have also decreased. The changes, however, are at most 1.5 of the error of our final results, and do not affect the overall pattern of deviation between the quenched and experimental spectrum.
5 Quark Masses in Quenched QCD
The use of qPT fits to pseudoscalar meson masses has important consequences for VWI quark masses. As already noted with Fig. 4 the critical hopping parameter is different for polynomial and qPT fits of pseudoscalar meson masses. This translates into a different estimate of , influencing the average and quark mass most.
In Fig. 10 we show the quark mass results as a function of the lattice spacing. The conclusion, reported at Lattice 97, that the VWI and AWI quark masses converge in the continuum limit remains unchanged also when qPT fits are used. Another point to note is that the continuum result of the VWI quark masses obtained with quadratic polynomial chiral fits of pseudoscalar meson masses are consistent within error bars with those of qPT fits, which is similar to the situation with hadron masses discussed in Sec. 3.4.
For our final values of the quark masses we make a combined linear continuum extrapolation of the VWI and AWI quark masses from qPT fits together, restricting them to a common value in the continuum limit (see Fig. 3 in [5]). We obtain MeV and MeV ( input) or MeV ( input) in the scheme at 2 GeV. The value of is 12% larger than the estimate reported at Lattice 97, where linear chiral extrapolations of pseudoscalar meson masses have been used.
6 Pseudoscalar Meson Decay Constants
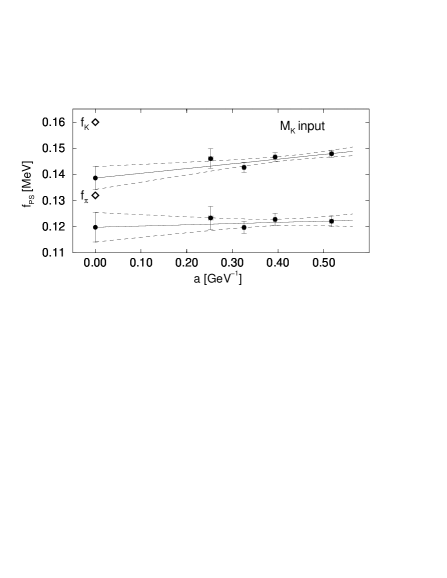
PS meson decay constants are determined from the local axial current. Because the quark mass dependence of degenerate decay constants has not yet been determined within qPT, we employ a quadratic polynomial chiral extrapolation for and a linear extrapolation for . The results as a function of the lattice spacing are shown in Fig. 11. We obtain 120(6) MeV and 139(4) MeV in the continuum limit, which are 10 and 15% smaller than experiment, respectively. The ratio 0.156(29) is also smaller than the experimental value 0.212.
7 Full QCD Simulation
Having observed systematic deviations of the quenched hadron spectrum from experiment, the natural question to ask is whether the deviation can be explained as a consequence of the effect of dynamical quarks. Due to the large increase of computer time required for simulating full QCD compared to the quenched approximation, we are forced to work at coarse lattice spacings where GeV, and are therefore led to employ improved actions.
In an initial study [19] we compared the scaling behaviour of various combinations of improved gauge and quark actions in full QCD at lattice spacings GeV. Based on the outcome of this comparison we decided to employ for gauge fields the RG improved action consisting of plaquette and 12 rectangular Wilson loop proposed by Iwasaki [20]. For quarks we use the SW clover action [21] with mean-field improved value of : with the one-loop value of the plaquette.
Simulations are carried out with two flavours of sea quarks, to be identified with the degenerate and quarks, while the strange and heavier quarks are treated in the quenched approximation. In Table 3 we give an overview of our run parameters. Three lattice spacings in the range –2 GeV are used for continuum extrapolation. Lattice sizes are chosen so that the spatial size is kept around fm (except for where it turned out to be smaller). For chiral extrapolations, simulations are performed at four sea quark masses corresponding to , 0.75, 0.7 and 0.6.
| size | [GeV] | #traj | time | ||
|---|---|---|---|---|---|
| #PU | [fm] | /traj | |||
| [hrs] | |||||
| 0.917(10) | .1409 | .8060(7) | 6250 | 0.11 | |
| 64 | 2.58(3) | .1430 | .753(1) | 5000 | 0.16 |
| 1.80 | .1445 | .696(2) | 7000 | 0.27 | |
| 1.60 | .1464 | .548(4) | 5250 | 0.93 | |
| 1.288(15) | .1375 | .8048(9) | 7000 | 0.11 | |
| 256 | 2.45(3) | .1390 | .751(1) | 7000 | 0.16 |
| 1.95 | .1400 | .688(1) | 7000 | 0.26 | |
| 1.53 | .1410 | .586(3) | 5000 | 0.85 | |
| 2.45(9) | .1351 | .800(2) | 1250 | 0.44 | |
| 512 | 1.93(7) | .1358 | .752(3) | 1350 | 0.70 |
| 2.20 | .1363 | .702(3) | 1610 | 0.99 | |
| 1.44 | .1368 | .637(6) | 1265 | 1.98 |
Configurations are generated with the HMC algorithm. To speed up our code we have implemented several improvements. For the integration of molecular dynamics equations we employ the scheme
where moves the gauge field and the conjugate momenta by a step . This scheme has errors of the same order as the standard leapfrog but the main contribution to the error is removed by the choice [22]. For our heaviest quarks can be taken about a factor 3 larger than for leapfrog, leading to a 30% gain in computer time. The gain decreases for decreasing quark masses and is lost at our smallest quark mass. For the inversion of the quark matrix we use the even/odd preconditioned BiCGStab algorithm [23]. Its performance compared to MR increases with decreasing quark mass. We observe a gain of about 40% at . CPU times needed for the creation of one unit of trajectory and numbers of processors are listed in Table 3.
The light hadron spectrum is calculated at each sea quark mass with valence quark masses corresponding to , 0.75, 0.7, 0.6 and 0.5. Quark propagators are calculated with exponentially smeared sources and local sinks. We combine quark propagators to form mesons of the form , and and baryons of the form , , and where stands for a valence quark with and for a valence quark with . These combinations include all unequal quark mass combinations allowed for degenerate and sea quarks and valence quark.
We measure hadron propagators at every 5th trajectory. Hadron masses are extracted by uncorrelated fits. Errors are determined with the binned jackknife method. The error reaches an approximate plateau after a bin size of at most 10 configurations (50 HMC trajectories), which we choose for error estimates of all our runs.
8 Full QCD Light Hadron Spectrum
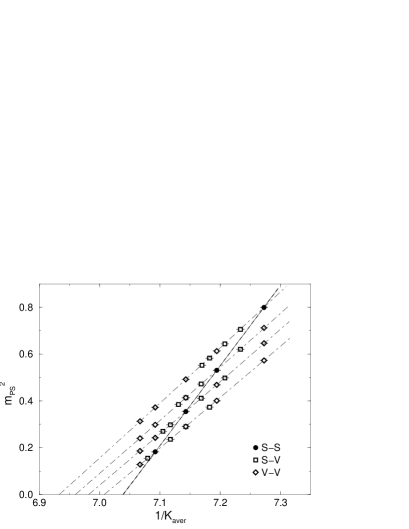
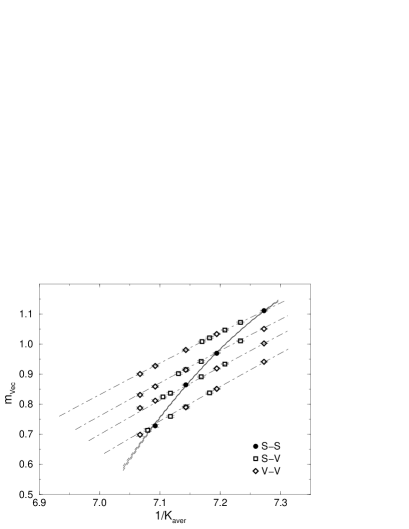
Figure 12 shows meson masses at as a function of the average hopping parameter of the two valence quarks in the meson. Partially quenched data ( and ) lie along clearly distinct lines for each . Each of these mass results are almost linear for both pseudoscalar and vector mesons, but their slope shows a variation with . With decreasing sea quark mass we observe a decreasing slope for pseudoscalar mesons and an increasing slope for vector mesons. While the pseudoscalar meson mass in the channel is almost linear in , the vector meson mass exhibits a clear concave curvature.
The picture for decuplet baryons looks very similar to the one for vector mesons, whereas for octet baryons partially quenched data of different degeneracies lie on clearly different lines.
For chiral extrapolations we fit at each value of all the data of a given channel together in a combined fit with a general quadratic ansatz in and . For pseudoscalar mesons consisting of valence quarks “1” and “2”, the fit ansatz is
| (10) | |||||
where bare quark masses are defined as
| (11) | |||||
| (12) |
and is the average valence quark mass. The valence-valence cross term is introduced to take into account mass differences of mesons at the same average valence quark mass. For vector mesons and decuplet baryons such a term is dropped because we observe them to be well described as a function of the sea quark mass and the average valence quark mass only. Curves of the combined fit are illustrated in Fig. 12 for meson masses.
For octet baryons we employ a combined quadratic fit for -like and -like baryons simultaneously. Linear terms are taken in a form inspired by chiral perturbation theory and general quadratic terms of individual are added. The resulting ansatz has 12 parameters which fits the 84 octet baryon mass data per value well.
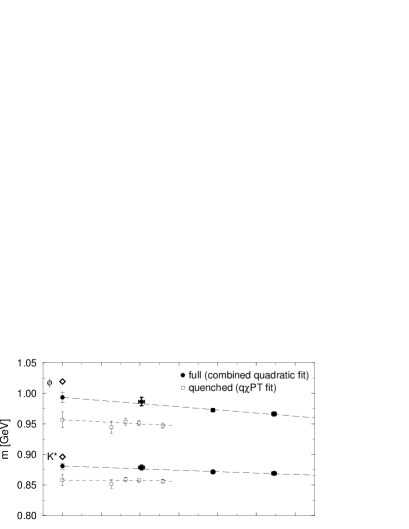
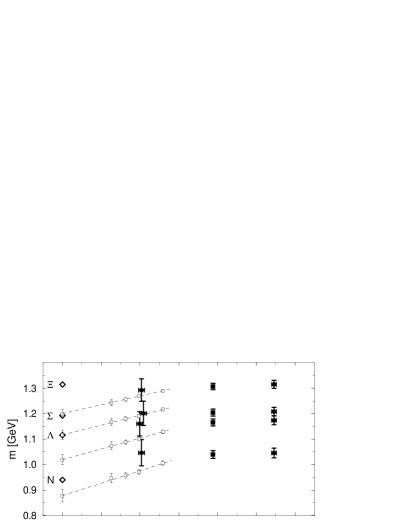
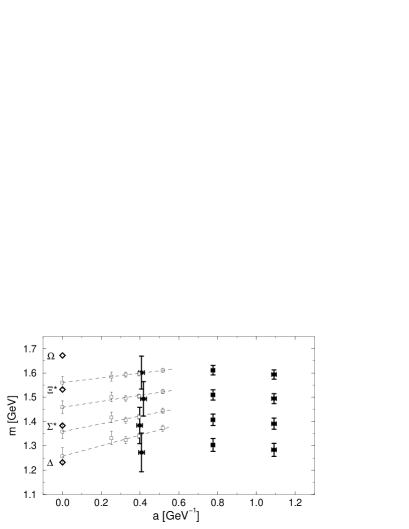
Using the results from the combined quadratic fits, the physical light quark hopping parameter and the lattice scale are fixed with the experimental value of and as input. The valence strange quark hopping parameter (at ) is determined from either or . The light hadron spectrum is calculated by setting to , and to either or depending on the quark content of the particle. The resulting hadron masses as a function of the lattice spacing are shown in Fig. 13. In the next section we discuss these results, focussing on what extent dynamical sea quark effects can be seen in comparison to the results from our simulation of quenched QCD with the standard action, plotted in Fig. 13 by open symbols.
9 Sea Quark Effects
9.1 effects on the light hadron spectrum
An interesting result which stands out in Fig. 13 is that the and masses from the full QCD simulation lie higher than those of the quenched results at finite lattice spacing, and that they extrapolate to values in the continuum limit considerably closer to experiment. If one makes a linear continuum extrapolation as shown by dashed lines, the difference from the experimental value is decreased by about 60% compared to quenched QCD. The expected leading scaling violation for the tadpole-improved SW quark action is . We also try such an extrapolation, which yields similar results.
The origin of the remaining difference from experiment is an interesting issue. One possible reason is that sea quark masses explored in the simulation () are still relatively heavy so that sea quark effects are only partly operative. We should also remember that our simulation treats only two quark flavours as dynamical. Therefore, another possibility is that at least part of the difference reflects the quenched treatment of the strange quark.
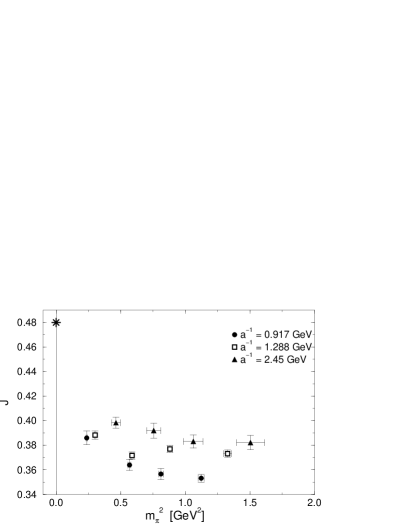
It is interesting to see in detail how the difference between quenched and full QCD arises as a function of the sea quark mass. The parameter at [24] is a measure of the meson hyperfine splitting around the strange quark. With the strange quark treated in the partially quenched approximation the derivative is evaluated at fixed sea quark mass by varying the valence quark mass only. Decreasing the sea quark from a large value down to the light quark mass interpolates between quenched and two-flavour full QCD.
In Fig. 14 we plot as a function of the sea quark mass (in the plot the mass squared of the pseudoscalar meson consisting of two sea quarks is used). We find the values to be approximately constant for moderate or large sea quark masses and roughly consistent with the quenched value 0.346(22) in the limit of infinitely heavy sea quarks. Only when the sea quark mass becomes close to the chiral limit the value of rises toward the experimental value of 0.48, resulting in an increase of the hyperfine splitting.
Sea quark effects on baryons are less clear. While scaling violation appears small for baryon mass results, the errors are still too large to reliably discuss continuum extrapolations and how the two-flavour results compare with those of quenched QCD. Furthermore there are two points that have to be kept in mind: (i) The spatial lattice size at the smallest lattice spacing turned out to be 1.9 fm compared to 2.5–2.6 fm at the two coarser lattice spacings. These are smaller than the size of 3 fm for our quenched simulation, and raises the question of finite-size effects. (ii) The smallest valence quark mass for full QCD corresponds to rather than for quenched QCD, possibly leading to systematic errors in chiral extrapolations of baryon masses. Further work matching these points is needed to clarify sea quark effects in the baryon mass spectrum.
9.2 static quark potential
In full QCD the string between a static quark and antiquark can break and one would expect to observe a flattening of the potential at large distances.

We extract the value of the potential between static quarks from smeared Wilson loops. At we also measure the mass of the static-light pseudoscalar meson with the light quark mass equal to the sea quark mass. In Fig. 15 these two quantities are compared for the lightest sea quark mass at . The linear increase of the potential continues beyond the crossing point with at around 1 fm. A similar situation is found also at other sea quark masses. We therefore see no indication for string breaking, similar to the findings of previous lattice simulations[7].
A possible explanation of this result is that the Wilson loop does not have a sufficient overlap with the state of a broken string. In [9] we argue, that in order to find the true ground state one would have to extract the potential from Wilson loops at a large time separation. This is difficult in practice because of the rapidly vanishing signal in the noise. One would have to use (an) operator(s) with a better overlap with a static-light meson pair state. This is also the essence of other recent proposals[25].
A quantity in which clear sea quark effects can be seen is the Coulomb coefficient . Here the full QCD results are larger than quenched, and they increase with decreasing sea quark mass. The magnitude of the shift from quenched to full QCD is consistent with expectations for [9].
10 Light Quark Masses in Full QCD
It has been known for some time that light quark masses calculated in two-flavour full QCD take significantly smaller values compared to those in quenched QCD[26]. Most recently the SESAM collaboration[27] reported MeV from their simulation with the standard action at GeV (). They furthermore pointed out that the ratio takes a large value in contrast to the value commonly quoted from chiral perturbation theory.
These results have been obtained with the VWI definition of the quark mass , where , the hopping parameter where the PS meson mass vanishes when valence and sea quarks have the same mass, is substituted for .
It has been suggested[28] that the use of the partially quenched critical value , defined by with fixed, resolves the problems described above. In two-flavour QCD however, the choice is the most natural one for the average and quark mass , since the sea quarks are identified with the degenerate and quark. Furthermore, and coincide in the continuum limit. If the difference between them vanishes sufficiently fast when approaching the continuum limit, then also the two will agree. Indeed, calculating in perturbation theory, we find that the difference between the two quark mass definitions vanishes as .
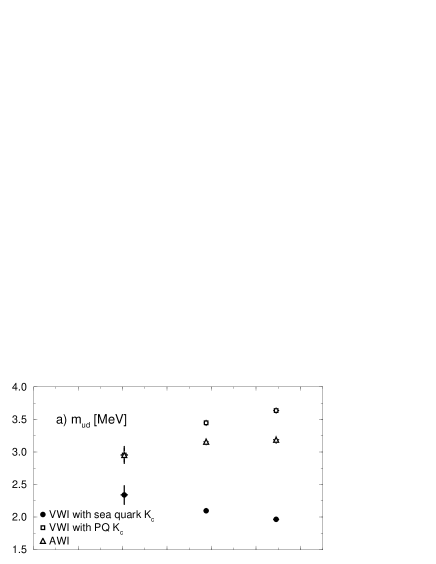
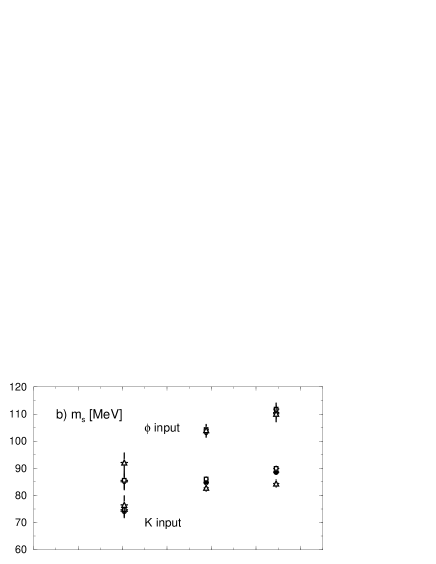
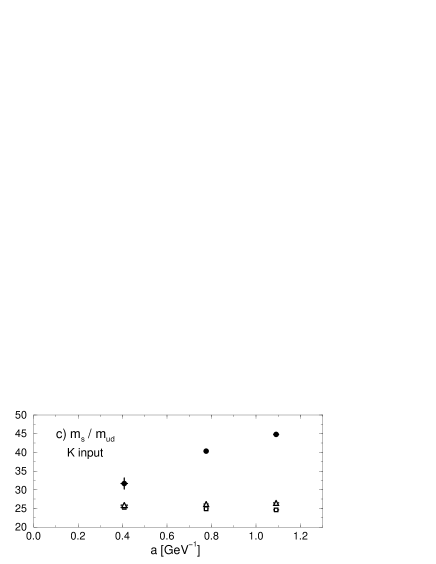
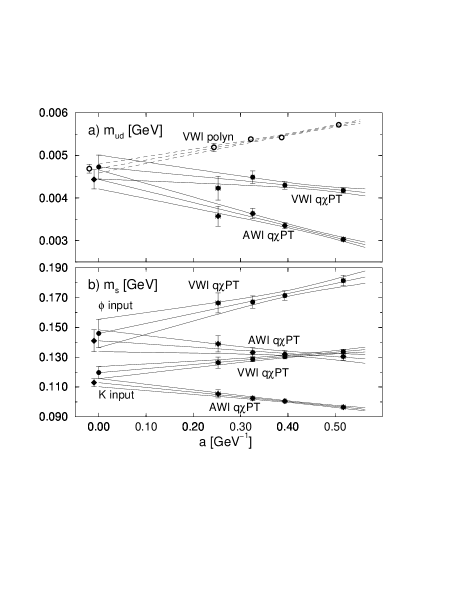
Figure 16a shows our results for in the scheme at GeV, calculated with tadpole-improved one-loop values of renormalization factors[11], as a function of the lattice spacing. The two definitions of lead to significantly different values at finite lattice spacings but as expected they converge towards the continuum limit. In addition the AWI quark mass also extrapolates to a similar value. The value reached is 2.5–3 MeV, which is about 40% smaller than the result obtained in quenched QCD. A theoretical argument for a decrease of quark masses by unquenching has been previously made from different running of the function[29].
Results for the strange quark mass are shown in Fig. 16b. The difference between various quark mass definitions is much smaller than for the light quark. The main uncertainty stems from the choice of the experimental input to fix . We find values in the continuum limit of about MeV ( input) or 80 MeV ( input). The discrepancy between these two values is smaller than in quenched QCD. The remaining difference might be due to the quenching of the strange quark or that the sea quarks are too heavy.
In Fig. 16c we show the ratio of strange to light quark masses as function of the lattice spacing. While for VWI masses with the choice the value is at the largest lattice spacing, it decreases toward the continuum limit and all definitions converge to , consistent with PT results.
11 Conclusions
In our extensive study of the quenched hadron mass spectrum, we found that the mass results show an overall consistency with qPT predictions, which led us to employ qPT mass formulae for chiral extrapolations in our final analysis. The spectrum in the continuum limit deviate systematically and unambiguously from experiment, on a level of about 10% (5). The terms specific to qPT, however, have a small magnitude of 2–3% of hadron masses, and are hence responsible only for a small part of the deviation. While chiral extrapolations differ, our main conclusion remains unchanged since Lattice 97.
Our study of full QCD is in a less advanced stage, attempting to systematically approach a realistic QCD simulation. Still, already several intriguing results are found. The discrepancy in the meson hyperfine splitting is reduced by about 60% and light quark masses are found to be around 40% smaller than in quenched QCD. In the future it will be interesting to look for sea quark effects also in other areas such as topology and heavy quark physics. Work in these directions has already started.
I would like to thank the members of the CP-PACS collaboration for their continuous help and support during the preparation of this overview. This work is in part supported by the Grant-in-Aid No. 09304029 of the Ministry of Education.
References
- [1] For recent reviews see R. Kenway, these proceedings; T. Yoshié, Nucl.Phys.B (Proc. Suppl.) 63 (1998) 3.
- [2] H. Hamber and G. Parisi, Phys.Rev.Lett. 47 (1981) 1792; D. Weingarten, Phys.Lett. 109B (1982) 57.
- [3] F. Butler, et al., Nucl.Phys. B430 (1994) 179.
- [4] CP-PACS Collab., Nucl.Phys.B(Proc.Suppl.) 63 (1998) 161; ibid. 60A (1998) 14.
- [5] T. Yoshié, CP-PACS collaboration, these proceedings.
- [6] M. Fukugita, et al., Phys.Rev. D36 (1987) 824; R. Gupta, et al., ibid. D44 (1991) 3272; SESAM Collaboration, Nucl.Phys.B (Proc.Suppl.) 63 (1998) 218.
- [7] For a review see S. Güsken, Nucl.Phys.B (Proc.Suppl.) 63 (1998) 16.
- [8] K. Kanaya, CP-PACS collaboration, these proceedings.
- [9] T. Kaneko, CP-PACS collaboration, these proceedings.
- [10] H. Shanahan, CP-PACS collaboration, these proceedings.
- [11] Y. Taniguchi, these proceedings.
- [12] For a recent review see S. Gottlieb, Nucl. Phys.B (Proc.Suppl.) 53 (1997) 155.
- [13] S. R. Sharpe, Phys.Rev. D41 (1990) 3233; D46 (1992) 3146.
- [14] C. W. Bernard and M. F. L. Golterman, Phys.Rev. D46 (1992) 853.
- [15] C. W. Bernard and M. F. L. Golterman, Nucl.Phys.B(Proc.Suppl.) 30 (1993) 217.
- [16] M. Booth, et al., Phys.Rev. D55(1997) 3092.
- [17] J. N. Labrenz and S. R. Sharpe, Phys.Rev. D54 (1996) 4595.
- [18] V. Bernard, et al., Z.Phys. C60 (1993) 111.
- [19] CP-PACS Collab., Nucl.Phys.B(Proc.Suppl.) 63 (1998) 221; ibid. 60A (1998) 335.
- [20] Y. Iwasaki, Nucl. Phys. B258 (1985) 141; Univ. of Tsukuba report UTHEP-118 (1983), unpublished.
- [21] B. Sheikholeslami and R. Wohlert, Nucl.Phys. B259 (1985) 572.
- [22] J. C. Sexton and D. H. Weingarten, Nucl. Phys. B380 (1992) 665.
- [23] A. Frommer, et al., Int. J. Mod. Phys. C5 (1994) 1073.
- [24] P. Lacock and C. Michael, Phys. Rev. D52 (1995) 5213.
- [25] I. Drummond, these proceedings; O. Philipsen and H. Wittig, ibid.; F. Knechtli and R. Sommer, ibid.; C. DeTar et al., ibid..
- [26] A. Ukawa, Nucl. Phys. B(Proc. Suppl.) 30 (1993) 3.
- [27] SESAM Collab., Phys.Lett.B 407 (1997) 290.
- [28] T. Bhattacharya and R. Gupta, Nucl.Phys.B (Proc.Suppl.) 63 (1998) 95.
- [29] P. B. Mackenzie, Nucl.Phys.B(Proc.Suppl.) 34 (1994) 400.