UTCCP-P-51
Sept. 1998
The static quark potential in full QCD
††thanks: talk presented by T. Kaneko
at Lattice98, Boulder, Colorado, USA, 13–18 July 1998.
Abstract
We report results on the static quark potential in two-flavor full QCD. The calculation is performed for three values of lattice spacing , and GeV on , and lattices respectively, at sea quark masses corresponding to –. An RG-improved gauge action and a tadpole-improved SW clover quark action are employed. We discuss scaling of and effects of dynamical quarks on the potential.
1 Introduction
Interest in the static quark potential calculated in full QCD is multi-fold, the foremost being the expectation that a flattening of the potential due to quark pair creation would be observed at large separations. An increase in the Coulomb coefficient of the potential at small separations is another effect expected from sea quarks. A number of studies have recently been reported exploring these aspects of the full QCD static potential [1, 2].
Recently the CP-PACS Collaboration has started a systematic effort toward a full QCD simulation with two flavors of dynamical quarks[3]. In this article we present results on the static potential calculated as a part of this program.
2 Simulations and measurements
The CP-PACS simulation of full QCD is carried out for three values of lattice spacing in the range – GeV and four different sea quark masses corresponding to –. An RG-improved gauge action and a tadpole-improved SW clover action are employed to reduce discretization errors. Light hadron masses are calculated at every fifth trajectories [4], while the static potential calculation uses a subset of the configurations as listed in Table 1 where other relevant run parameters are also given.
| lattice | conf | ||
|---|---|---|---|
| 0.1409 | 985 | 0.806(1) | |
| 0.1430 | 845 | 0.753(1) | |
| 0.1445 | 1063 | 0.696(2) | |
| GeV | 0.1464 | 680 | 0.548(4) |
| 0.1375 | 659 [375] | 0.805(1) | |
| 0.1390 | 690 [199] | 0.751(1) | |
| 0.1400 | 659 [169] | 0.688(1) | |
| GeV | 0.1410 | 492 [169] | 0.586(3) |
| 0.1351 | 250 | 0.800(2) | |
| 0.1358 | 269 | 0.752(3) | |
| 0.1363 | 322 | 0.702(3) | |
| GeV | 0.1368 | 253 | 0.637(6) |
We extract the static potential from smeared Wilson loops by an exponential fit over the range – fm, above which noise quickly dominates over the signal. The string tension and the Coulomb coefficient are determined by fitting the potential result to a form . Errors are estimated by the jack-knife method with a bin size corresponding to 50 HMC trajectories.
We also carry out a measurement of the potential with 100 configurations in quenched QCD at to compare with full QCD results obtained at .
At , we calculate the static-light meson propagator using an exponential smearing function for the source. The mass of the static-light meson is extracted by making fits over an interval – fm.
3 Scaling of
In Fig. 1 the lattice spacings determined from , the string tension (where we employ the value GeV) and the Sommer scale at each sea quark mass on the lattice are plotted as a function of . The values extrapolated quadratically in to the chiral limit are also shown. We observe that the three lattice spacings converge within 10% in the chiral limit. The consistency of scale observed here at fm holds also at larger lattice spacings.

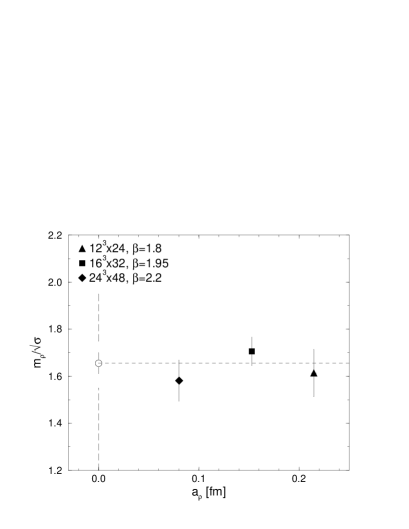
In Fig. 2 we plot the ratio in the chiral limit as a function of fixed by . With our choice of the clover coefficient for the quark action, the leading scaling violation is expected to be small[5]. The flat behavior of the ratio supports this expectation, and also suggests that the remaining higher order contributions are small as well. We then adopt a constant fit, and find as an estimate of the continuum value. If we employ GeV, this leads to GeV, which is now a prediction of our full QCD simulation. This value is about 5% larger than 0.44 GeV used in Fig. 1.
4 String breaking effect
In Fig. 3 the potential data are compared with twice the static-light meson mass on the lattice at the lightest sea quark mass. The potential result crosses at around 1 fm and continues to increase with . We find a similar behavior at other sea quark masses and lattice spacings. Thus our results do not show any indication of a flattening of the potential expected from a pair creation of quarks, similar to those of previous studies[2].
A possible interpretation of this result is that the overlap of the Wilson loop operator with the state of a static-light meson pair is small. In a simplified picture that the contribution of the meson pair to the Wilson loop is given by a static-light meson propagating along the loop, the overlap is given by a factor where with is the binding energy of meson. Hence the contribution of the meson pair dominates over that of the string state only for sufficiently large satisfying . For numerical parameters appropriate for Fig. 3, we find this condition to be met only for fm at fm, which is far too large for practical potential measurements. Devising an operator which does not suffer from the small overlap problem is needed to observe the string breaking effect.

5 Effect on the Coulomb coefficient
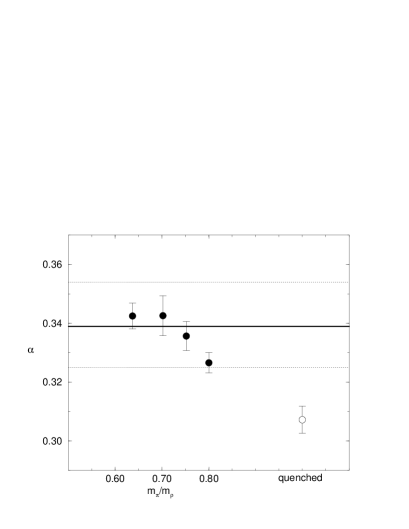
In Fig. 4 we plot results for the Coulomb coefficient obtained on the lattice as a function of sea quark mass using (filled circles). The right-most open circle is the result in quenched QCD at for which GeV fixed by GeV matches with the value GeV of the full QCD run. As expected, the full QCD results are larger than the quenched value, and they increase as the sea quark becomes lighter.
A simple estimate of the magnitude of shift of from quenched to full QCD may be made in the following way[6]: one starts with the quenched value, runs it from down to MeV using the 2-loop function with , and then runs back to with . The result shown by the horizontal line in Fig. 4 is consistent with the measured value. Dashed lines are uncertainties due to the error of the quenched value and the choice of the matching scale, which is varied over – MeV.
We thank I. Drummond and B. Petersson for useful discussions. This work is supported in part by the Grants-in-Aid of Ministry of Education (Nos. 08640404, 09304029, 10640246, 10640248, 10740107). GB, SE and KN are JSPS Research Fellows. HPS is supported by JSPS Research for Future Program.
References
- [1] For a review, see, J. Kuti, in these proceedings.
- [2] CP-PACS Collab., Nucl. Phys. B (Proc. Suppl.) 63 (1998) 221; SESAM and TL collab., ibid. 209; UKQCD Collab., ibid. 227.
- [3] For an overview, see R. Burkhalter for CP-PACS Collab., in these proceedings.
- [4] CP-PACS Collab., presented by K. Kanaya, in these proceedings.
- [5] S. Aoki, in these proceedings.
- [6] A.X. El-Khadra, et al., Phys. Rev. Lett. 69 (1992) 729.