Investigation of the Critical Behavior of the Critical Point of the Z2 Gauge Lattice
Abstract
We investigate, through Monte-Carlo simulations, the nature of the second order point in a (Bosonic) + gauge theory in four dimensions. Detailed analysis of the critical exponents point to the Ising universality class. Relevancy to extended models and possible Non-Gaussian behavior is discussed.
In the present paper we investigate the character of the critical point C (Fig 1) and show that the segment AC is mapped on the segment , of the usual Ising model. We find that the Ising critical exponents and the Ising universal function are reproduced to a very high precision.
I Introduction
The gauge system has been investigated using mean-field method [2], Monte Carlo simulations [3, 4] and exact solutions [5, 6]. The objective of these studies was to find the phase diagram from the action (equation 1), and to classify the order of the phase transitions.
A The Model
The action of the gauge lattice can be written as
| (1) |
where is the value of the link connecting the sites and and is the value of site . The first sum is over all sets of four neighboring links (plaquettes) and the second sum is over all nearest neighbor sites. Both and can obtain the values with . The free energy is then
| (2) |
with the partition function given by
| (3) |
and N is the number of sites in the lattice.
From the action Eq. (1) we look at two gauge invariant observables and define as
| (4) | |||||
| (5) |
where the averaging is over all sites and links of the lattice. The factors and are the ratios between the number of sites to the number of links and plaquettes in a four-dimensional lattice.
In this system, and can be used as order parameters replacing the standard magnetization which is not gauge invariant. They are order parameters in the sense that they exhibit singularities of the bulk thermodynamics. However they lack the property of a magnetization in that they never vanish (except at temperature zero) or zero.

The phase diagram is shown schematically in Fig. 1. The three transition lines experienced by and meet at the triple point(A) and split the phase space into three regions. This phase space includes two familiar limits. In the limit all plaquettes are forced to one. The gauge degrees of freedom therefore disappear and the system reduces to that of a normal four-dimension Ising model. Here experiences a second order transition while remains smooth. It has been shown [7] that the second order line is of Ising type all the way to the triple point.
On the axis the action reduces to a pure gauge theory and experiences a first order transition. This behavior continues all the way up to the triple point A with remaining smooth [8]. A line of first order in both and is then formed which ends with the critical point C.
II Numerical simulation on the lattice
We implemented a standard Monte Carlo procedure using a heat bath algorithm to generate the configurations of the lattice. In this paper we shall use the term iterationto represent an update of all links and sites in the lattice.
Even using this method, the simulations require significant computational resources restricting us to modest lattice sizes for our investigation. Therefore we used lattice sizes ranging from sites ( which other studies have shown to give good results [3, 4, 7]) up to , and at the critical point up to . In order to minimize surface effects a toroidal geometry was adopted.
Each simulation consisted of measurements of the observables along a line of points in the phase diagram. Many such lines were made in order to cover the parameter space and measure variations along different directions. At each point the system was allowed to evolve for at least 10,000 iterations, with mean values of the observables calculated after discarding the first 1000. In the vicinity of the critical point, the relaxation time and fluctuations increased dramatically requiring more iterations to give reliable results. In this region we generated up to 100,000 iterations.
Along the first order line , the behavior of is like a magnetization with two metastable states and . However, unlike the Ising model, these two states are not symmetrical about the origin. By evaluating the mid point between and . we can consider which is then symmetrical about zero. However can only be found along the line of first order where there are two stable states present.
Direct measurements of are further complicated by tunneling between and . This has the effect of blurring the first order nature of the transition making measurements of difficult. In order to reduce the effects of tunneling we work with . Due to fluctuations in , will never reduce to zero even though may become zero, however these fluctuations decrease as the lattice size increases.
In order to measure the critical exponents, the relevant parameterization of the phase space must be identified. We therefore require an expression for the temperature and external field like directions in terms of and .
In a magnetic system, a coexistence line occurs along the temperature axis. We therefore define the temperature axis for this system along the line of first order .
Along this line the reduced temperature is given by
The definition of the external field is less clear as there is no obvious preferred direction. In this work we used the definition used by Brézin and Drouffe [9] in their mean field analysis of the critical exponents.
The measurements of the critical exponents were carried out in two stages. Firstly we made a direct fit for L to the exponents. This method was applied for and .
III Numerical results and discussion
1 Determination of and
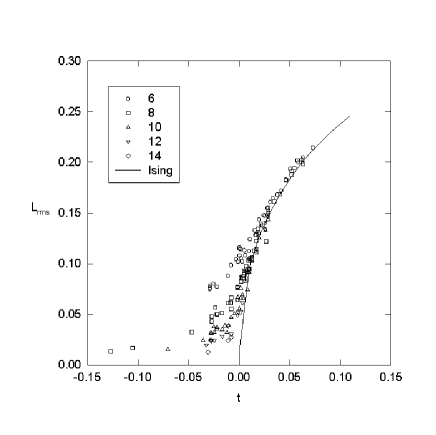
Figure 2 shows how changes with for the different lattices. After discarding points with small t (where differs significantly from ), the best fit gives . The solid line is the Ising value of .
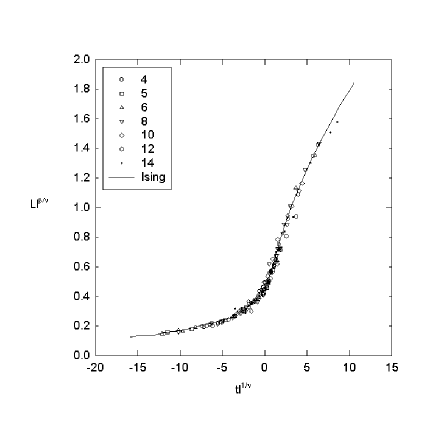
A more accurate measurement of was obtained from finite size scaling. Figure 3 shows these results and compares the data with simulations run in the Ising limit, (solid line). The values for the critical exponents used in this graph are those of a four dimensional Ising model, and . Deviation from a single curve was observed if or were varied by more that 0.02.
2 Determination of
Direct fits with were unreliable and depended strongly on the dimensions of the lattices we used.
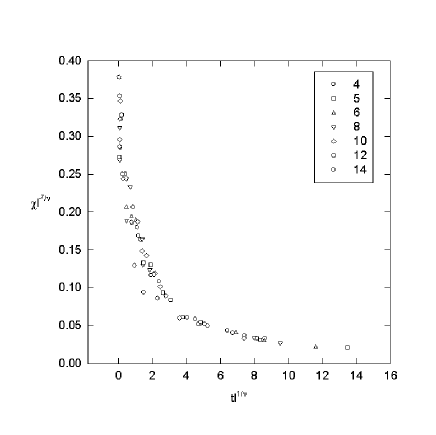
Results from finite size scaling proved to be much more consistent as shown in Fig. 4. Using the value of found earlier gives .
3 Determination of
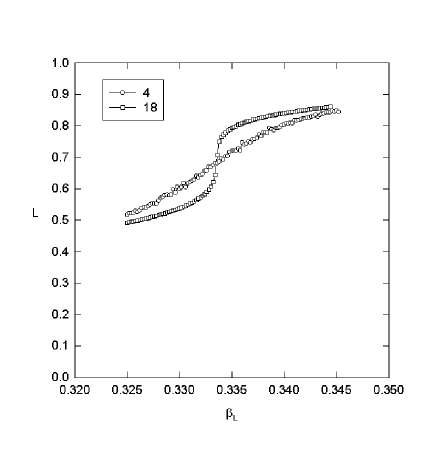
The measurement of is less straight forward. It proved to be sensitive both to the location of the critical point and to the lattice size (see Fig. 5). The main difficulty arises from the fact that is not symmetric under the operation generating different values either side of the temperature axis are 0.4 for , and for . Measurements of lattices with different sizes showed, that the shape of vs. becomes more symmetric as the lattice size increases.
The calculation of the range of values took place separately for each side around the zero of . The combined result is 1.1.
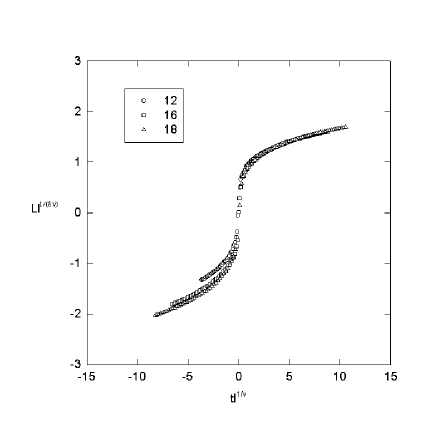
The asymmetry also affects finite size scaling. It proved impossible to collapse both and data onto a single curve simultaneously as shown in Fig 6. Treating each side independently gave and and and .
4 Universality
The measured values of the critical exponents show that the critical point in this model most likely behaves like a four-dimensional Ising model. The values of and fit the Ising values with very high accuracy, has the Ising value too, but the measurement is less accurate.
The only critical exponent that could be significant different from the Ising value is . We ascribe our difficulties in measuring to our definition of the external field direction . It is not obvious from the model which direction is relevant and we were unable to isolate it from our data. The direction we adopted may therefore be a combination of and , thus our measurement is probably contaminated with effects from .
IV Summary
This work is a numerically investigation of the behavior of the critical point in the gauge lattice. The critical exponents were measured using Monte Carlo simulations, and were calculated directly as well as through finite size scaling. Other measurements were made in the Ising limit of the system.
The calculated exponents had the four-dimensional Ising model values. The numerical measurements gave the same values as the theoretically calculated exponents of and . Two other critical exponents, and , that were measured, gave also the Ising values. The finite size scaling for created the same shape of curve as the one obtained from Ising data. The present high precision runs set a high precision standard for the estimation of the character of other interesting critical points, notably the vortex/monopole condensation points in mixed action gauge theories and analogue points in supersymmetric theories.
We would like to thank Professor G. Parisi for the helpful discussions. This work is supported in part by BSF – American-Israel Bi-National Science Foundation, and by the Israel Science Foundation founded by the Israel Academy of Sciences and Humanities – Centers of Excellence Program.
REFERENCES
- [1] Current address: School of Physics and Astronomy, Raymond and Beverly Sackler Facullty of Exact Sciences, Tel Aviv University, Tel Aviv 69978, Israel.
- [2] R.Balian, J. M. Drouffe, and C. Itzykson, Phys. Rev. D11, 2098 (1975).
- [3] M. Creuts, Phys. Rev. D21 (1980), 1006.
- [4] J. D. Stack G. A. Jongeward and C. Jayaprakash, Phys. Rev. D21 (1980), 3360.
- [5] E. Fradkin and S. H. Shenker, Phys. Rev. D19 (1979), 3682.
- [6] T. Banks, E. Rabinovici, Nucl. Phys. B160 (1979), 349.
- [7] M. Marcu T. Filk and K. Fredenhagen, Phys. Lett. B169 (1986), 405.
- [8] F. Wegner, J. Math. Phys. 12 (1971), 2259.
- [9] E. Brézin and J. M. Drouffe, Nucl. Phys. B200 (1982), 93.
- [10] E. Brézin and J. Zinn-Justin, Nucl. Phys. B257 (1985), 867.
- [11] M. E. Fisher and M. N. Barber, Phys. Rev. Lett. 28 (1972), 1516.