Two-Flavor Chiral Phase Transition in Lattice QCD with the Kogut-Susskind Quark Action††thanks: poster presented by A. Ukawa
Abstract
A summary is presented of a scaling study of the finite-temperature chiral phase transition of two-flavor QCD with the Kogut-Susskind quark action based on simulations on (=8, 12 and 16) lattices at the quark mass of and 0.01. We find a phase transition to be absent for , and also quite likely at . The quark mass dependence of susceptibilities is consistent with a second-order transition at . The exponents, however, deviate from the O(2) and O(4) values theoretically expected.
1 Introduction
The order of the two-flavor chiral phase transition is a basic question in finite-temperature lattice QCD. Earlier finite-size studies disfavored a first-order transition, indicating the chiral transition being second-order at a zero quark mass[3, 4]. This was also corroborated by a scaling analysis of Ref. [5]. To advance the scaling argument, we have pushed forward simulations toward larger spatial lattice sizes and smaller quark masses, where we found[6] exponents differing from the earlier results[5]. We have since completed our runs[7], and here present a summary of results. For recent similar attempts we refer to Refs. [8, 9].
2 Simulation
Our study is made with the plaquette gauge action and the Kogut-Susskind quark action on lattices of a size with at the quark masses . For each set , 10000 trajectories of unit length are generated by the hybrid R algorithm for a single value of close to the transition. The standard reweighting technique is employed to calculate the dependence of observables around the simulation point. The following susceptibilities are calculated at each trajectory:
| (1) | |||||
| (2) | |||||
| (3) | |||||
| (4) | |||||
| (5) | |||||
| (6) |
where denotes the lattice volume, the temporal component of the Kogut-Susskind operator, , and the spatial and temporal plaquette. Averages are taken over the last 8000 trajectories, with errors estimated through jackknife analyses with the bin size of 800 trajectories.
3 Finite-size scaling analysis

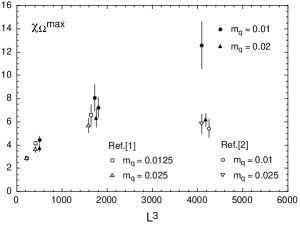

In Fig. 1 we plot the results for the spatial volume dependence of the peak height of the susceptibilities and . For the latter, results from previous studies are also shown for comparison (open symbols). For the two susceptibilities do not increase beyond the size , supporting the previous conclusion of an absence of phase transition down to [3, 4].
For an increase of the peak height continues up to in a linear manner. This result is quite different from that of an earlier work[4] which showed a flattening behavior for (see open circle for ). We may ascribe this underestimate to a smaller statistics (2500 trajectories[4] as compared to 10000 employed here).
A linear increase of susceptibilities is a behavior expected for a first-order transition. However, examining the time histories of chiral order parameter for shown in Fig. 2, we observe that metastability signals become weaker toward larger spatial sizes: a flip-flop behavior is most apparent for , while irregular fluctuations are more dominant for larger . Correspondingly, the histogram of clearly shows a double-peak distribution for , which is less evident for and hardly visible for . Furthermore, if we normalizes by the pion correlation length at zero temperature, we find the increase of susceptibilities at for being similar to that at for .
We conclude that the increase of susceptibilities for is probably due to insufficient spatial volume, and that a phase transition is also likely to be absent for .
4 Second-order scaling analysis
| O(2) | O(4) | MF | ||||
| 0.60 | 0.54 | 2/3 | 0.70(11) | 0.74(6) | 0.64(5) | |
| 0.79 | 0.79 | 2/3 | 0.70(4) | 0.99(8) | 1.03(9) | |
| 0.39 | 0.33 | 1/3 | ||||
| 0.42(5) | 0.75(9) | 0.78(10) | ||||
| 0.47(5) | 0.81(10) | 0.82(12) | ||||
| 0.47(5) | 0.81(9) | 0.83(12) | ||||
| -0.01 | -0.13 | 0 | ||||
| 0.21(4) | 0.28(7) | 0.38(7) | ||||
| 0.25(6) | 0.56(11) | 0.58(13) | ||||
| 0.22(6) | 0.52(10) | 0.55(12) | ||||
| 0.18(5) | 0.46(8) | 0.43(10) | ||||
| 0.20(5) | 0.51(9) | 0.50(12) | ||||
| 0.19(5) | 0.48(9) | 0.47(11) |
For a second-order transition, the critical coupling and susceptibilities are expected to exhibit a scaling behavior toward given by
| (7) | |||||
| (8) |
where the index labels various susceptibilities defined in (1–6). Our results for exponents obtained by a single-power fit are summarized in Table 1. For our values are consistent with those of Ref. [5] carried out for and .
Th exponent determined from the critical coupling is roughly consistent with the O(2) or O(4) value theoretically expected. All the other exponents exhibit a systematic increase with and deviate significantly from the predictions, particularly for and .
On the other hand, the hyperscaling relations and , which follow from the fact that all the exponents are determined by the basic thermal and magnetic exponents, are well satisfied for each spatial size .
We have also calculated the scaling function with . We find reasonable scaling if measured values of exponents are employed, while results are much worse with the use of the O(4) exponents.
We may summarize that our susceptibility data are consistent with a second-order transition, but that the exponents apparently take values different from those theoretically expected, at least in the range of quark mass .
5 Concluding remarks
This investigation has raised several issues which were not apparent in the previous studies[3, 4, 5]. While we feel a first-order transition being unlikely, a finite-size analysis is needed at a larger spatial volume to firmly establish the absence of a first-order transition at . The discrepancy of measured values of exponents from the theoretical expectations, especially from those of O(2), has to be clarified to confirm the second-order nature of the transition.
This work is supported by the Supercomputer Project (No. 97-15) of High Energy Accelerator Research Organization (KEK), and also in part by the Grants-in-Aid of the Ministry of Education (Nos. 08640349, 08640350, 08640404, 09246206, 09304029, 09740226).
References
- [1]
- [2]
- [3] M. Fukugita et al., Phys. Rev. Lett. 65 (1990) 816; Phys. Rev. D42 (1990) 2936.
- [4] F. R. Brown et al., Phys. Rev. Lett. 65 (1990) 2491; A. Vaccarino, Lattice 90, Nucl. Phys. B (Proc. Suppl.) 20 (1991) 263.
- [5] F. Karsch, Phys. Rev. D49 (1994) 3791; F. Karsch and E. Laermann, Phys. Rev. D50 (1994) 6954.
- [6] A. Ukawa, Lattice 96, Nucl. Phys. B (Proc. Suppl.) 53 (1997) 106.
- [7] JLQCD Collaboration, hep-lat/9708010; in preparation.
- [8] G. Boyd et al., hep-lat/9607046; E. Laermann, these proceedings.
- [9] C. DeTar, these proceedings.