Scaling Analysis of Chiral Phase Transition for Two Flavors of Kogut-Susskind Quarks††thanks: presented by M. Okawa
Abstract
Report is made of a systematic scaling study of the finite-temperature chiral phase transition of two-flavor QCD with the Kogut-Susskind quark action based on simulations on (=8, 12 and 16) lattices at the quark mass of and 0.01. Our finite-size data show that a phase transition is absent for , and quite likely also at . The scaling behavior of susceptibilities as a function of is consistent with a second-order transition at . However, the exponents deviate from the or values theoretically expected.
1 Introduction
Study of full QCD thermodynamics with the Kogut-Susskind quark action has been pursued over a number of years. A basic question for this system is the order of chiral phase transition for light quarks. For the case of two flavors, this question was examined by finite-size scaling studies carried out around 1989-1990[3, 4]. On lattices with the temporal size and the quark mass in the range , it was found that the peak height of susceptibilities increases up to a spatial lattice size , but stays constant within errors between and 16. The conclusion then was that a phase transition is absent down to 0.01, which was thought consistent with the transition being of second-order at as suggested by the sigma model analysis[5].
A more detailed study based on universality argument was recently attempted[6, 7]. Critical exponents were extracted from the quark mass dependence of the critical coupling and the peak height of various susceptibilities on an lattice with =0.075, 0.0375 and 0.02. It was found that the magnetic exponent is in reasonable agreement with that of the spin model expected from universality arguments[5], while the thermal exponent shows a sizable deviation from the value.
We have attempted to systematically extend the previous studies both regarding the spatial volume dependence and the quark mass dependence to further examine the universality nature of the transition. For this purpose we have carried out simulations on lattices of spatial size and at the quark mass of and in lattice units. In this article we report on results of scaling analyses based on these runs[8]. Studies similar to ours are being carried out by other groups[9, 10].
2 Simulation
The full QCD system we study is defined by the partition function
| (1) |
with the standard single-plaquette gauge action, and the Kogut-Susskind quark operator. Simulations are made on lattices with = 8, 12 and 16. For the quark mass , we employ = 0.075, 0.0375, 0.02 and 0.01 for each spatial lattice size . The hybrid algorithm[11] is adopted to update gauge configurations. In Table 1, we list the values of where our runs are made. To control systematic errors of the algorithm, we choose the molecular dynamics step size to be as listed in Table 1. For each run, 10000 trajectories of unit length are generated starting from an ordered configuration. Two runs are made for on a lattice since the first run at appears to be predominantly in the low-temperature phase (see Fig. 2 below). Critical exponents we obtain for using two runs separately, however, agree within our statistical errors. We therefore show results obtained with the first run in this article.
Inversion of the quark operator is made with the conjugate gradient algorithm, reducing the number of floating point operations by half through the even-odd decimation procedure. The stopping condition for the even part of the source vector is with the space-time volume .
Observables are calculated at every trajectory. For computing average values of observables we discard the initial 2000 trajectories of each run. The errors are estimated by the Jackknife method with a bin size of 800 trajectories. Values of observables in the region of around the simulation point are evaluated by the standard reweighting technique[12].
The numerical calculations have been performed on the Fujitsu VPP500/80 supercomputer at KEK.
| 0.02 | 0.01 | 0.005 | ||
|---|---|---|---|---|
| 8 | 5.306 | 5.282 | 5.266 | |
| 12 | 5.348 | 5.306 | 5.282 | 5.266 |
| 5.2665 | ||||
| 16 | 5.345 | 5.306 | 5.282 | 5.266 |
3 Observables
In the course of our simulation, we measure the following susceptibilities:
| (2) | |||||
| (3) | |||||
| (4) | |||||
| (5) | |||||
| (6) | |||||
| (7) |
where denotes the temporal component of the Dirac operator, , and the spatial and temporal plaquette.
Calculation of the fermionic susceptibilities , and is non-trivial because of the presence of disconnected double quark loop contributions. We use the volume source method without gauge fixing[13] to evaluate these susceptibilities.
Let us illustrate our procedure for . Performing quark contractions and correcting for the flavor factor arising from the four-flavor nature of the Kogut-Susskind quark field, we find
| (8) | |||||
| (9) | |||||
| (10) |
Let us define the quark propagator for unit source placed at every space-time site with a given color by
| (11) |
From , we calculate four quantities defined by
| (12) | |||||
| (13) | |||||
| (14) | |||||
| (15) |
It is then straightforward to show that
| (16) | |||||
| (17) | |||||
up to terms which are gauge non-invariant, and hence do not contribute to the average over gauge configurations. We note that contains connected contributions in addition to the dominant disconnected double quark loop contribution, and vice versa for . The terms and represent contact contributions in which the source and sink points of quark coincide.
4 Finite-size scaling analysis


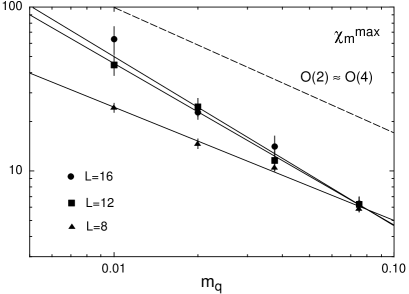
We start examination of our data with an analysis of spatial volume dependence of susceptibilities for each quark mass. Let be the peak height of as a function of evaluated with the reweighting technique. In Fig. 1 we plot the peak height as a function of the spatial volume.
For the heavier quark masses of and 0.0375 the peak height increases little over the sizes , clearly showing that a phase transition is absent for these masses. For an increase of the peak height is seen between and 12. The increase, however does not continue beyond 12; the peak height stays constant within errors between and 16. We conclude absence of a phase transition also for confirming the previous work[3, 4].
For the lightest quark mass employed in our simulation, we observe a large increase of the peak height between and 12. Furthermore, the increase continues up to . The size dependence is consistent with a linear behavior in spatial volume, which one expects for a first-order phase transition. Other susceptibilities exhibit a similar size dependence as the quark mass is decreased from to 0.01.
This behavior contrasts with the results of a previous study[4] which found that the peak height of susceptibilities for stays consistent with those for at [3]. It is likely that a smaller statistics (2500 trajectories[4] as compared to 10000 employed here) led to an underestimate of susceptibilities in ref. [4].
An important question is whether a linear increase seen in Fig. 1 could be regarded as evidence for a first-order phase transition at . We think that this is not so for several reasons. Looking at the time histories of the chiral order parameter shown in Fig. 2, we observe an apparent flip-flop behavior between two different values of for . However, the time histories for and 16 are more dominated by irregular patterns, and the width of fluctuation is smaller. These features are also reflected in the histograms. While we clearly see a double-peak distribution for , it is less evident for and barely visible for . Furthermore, the width of the distribution is smaller for larger lattice sizes and the distance between the position of two possible peaks is narrower.
These observations suggest the possibility that the increase of the peak height seen for up to is a transient phenomenon due to insufficient spatial volume, similar to an increase observed between and for . In order to check this point, we attempt to normalize the lattice volume by a relevant length scale, which we take to be the pion correlation length at zero temperature. Using a parametrization of available data for pion mass as a function of and by the MILC Collaboration[14], we find for and for . Hence the size for roughly corresponds to for , and to . When compared in this correspondence the histograms for and 0.01 are similar in shape. It is quite possible that the peak height for levels off if measured on a larger lattice, e.g., .
While a definitive conclusion has to await simulations on larger spatial sizes, we think it likely that a first-order phase transition is absent also at .
5 Analysis of quark mass dependence
5.1 Scaling laws and exponents
We have seen in the previous section that the spatial volume dependence of our data do not show clear evidence of a phase transition down to . In the present section we assume that the two-flavor chiral transition is of second-order occurring at . Various scaling laws follow from this assumption for the quark mass dependence of the susceptibilities, from which we can extract information about critical exponents.
For a given quark mass , let be the peak position of the chiral susceptibility as a function of the coupling constant and let be the peak height. These quantities are expected to scale toward as
| (18) | |||||
| (19) |
The peak height of other susceptibilities similarly scales as
| (20) | |||||
| (21) | |||||
| (22) |
We note that form three singular parts of the thermal susceptibility = with the energy density, and and form six singular parts of the specific heat . The leading exponents and for and are then given by and .
| MF | ||||||
| 0.60 | 0.54 | 2/3 | 0.70(11) | 0.74(6) | 0.64(5) | |
| 0.79 | 0.79 | 2/3 | 0.70(4) | 0.99(8) | 1.03(9) | |
| 0.39 | 0.33 | 1/3 | ||||
| 0.42(5) | 0.75(9) | 0.78(10) | ||||
| 0.47(5) | 0.81(10) | 0.82(12) | ||||
| 0.47(5) | 0.81(9) | 0.83(12) | ||||
| -0.01 | -0.13 | 0 | ||||
| 0.21(4) | 0.28(7) | 0.38(7) | ||||
| 0.25(6) | 0.56(11) | 0.58(13) | ||||
| 0.22(6) | 0.52(10) | 0.55(12) | ||||
| 0.18(5) | 0.46(8) | 0.43(10) | ||||
| 0.20(5) | 0.51(9) | 0.50(12) | ||||
| 0.19(5) | 0.48(9) | 0.47(11) |
For a second-order chiral phase transition, we expect the exponents to be expressed in terms of the thermal and magnetic exponents and ;
| (23) | |||||
| (24) | |||||
| (25) | |||||
| (26) |
Therefore two relations exist among the four exponents and , which we take to be
| (27) | |||||
| (28) |
The natural values to expect for the exponents are those of corresponding to exact symmetry of the Kogut-Susskind quark action at finite lattice spacing. Sufficiently close to the continuum limit, we may also expect the values as predicted by the effective sigma model analysis. The possibility of mean-field exponents arbitrarily close to the critical point has also been suggested[15].
5.2 Results for exponents
Our results for the exponents are tabulated in Table 2. The exponent that governs the scaling behavior of the critical coupling is extracted from the fit of form (18). We observe that does not have a clear size dependence within our error of about 10%, and that the values are similar to , or mean-field predictions, also listed in the Table, within one to two standard deviations.
Let us turn to the exponents determined from the peak height of susceptibilities. The values in Table 2 are extracted by fits employing a scaling behavior with a single power as given in (19–22). In Fig. 3 we illustrate the fit for the quark mass dependence of the peak height of the chiral susceptibility .
We observe in Table 2 that all the exponents and increase as we increase the spatial lattice size . The value of for the smallest size =8 is not so different from the and values. It deviates from the theoretical prediction for = 12 and 16, however, and takes a value about 20 % larger, which amounts to a two standard deviation difference.
For and various susceptibilities defined in (3)-(7) generally give consistent results. We observe, however, a % larger value of compared with the theoretical prediction already for , and the discrepancy increases to a factor two difference for and 16. The disagreement is more apparent for the exponent for which values in the range are obtained for larger sizes in contrast to a negative value for the and theories.
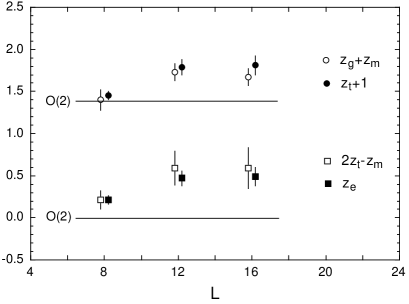
We have noted in Sec. 5.1 that the four exponents and should satisfy two consistency equations reflecting the fact that two relevant operators govern a second-order phase transition. In Fig. 4 we plot the two sides of the equations (27) and (28) using the values of exponents given in Table 2. For and we take an average over operator combinations since the values are mutually in agreement within the error. We observe that the consistency is well satisfied for each spatial volume even though values of individual exponents deviate from those of or mean-field theory predictions.
We have also attempted fits allowing for a constant term in the fitting function . We are not able to obtain reliable fits taking as a free parameter, since the errors of fitted values are too large. Fixing the exponent to the theoretical or values, we find that the quality of fit generally worsens compared with the single power fit. In particular, the fit tends to misses the point for the smallest quark mass for .
We are led to conclude that the exponents show deviation from or values, at least in the range of quark mass explored in our simulation.
5.3 Results for scaling function
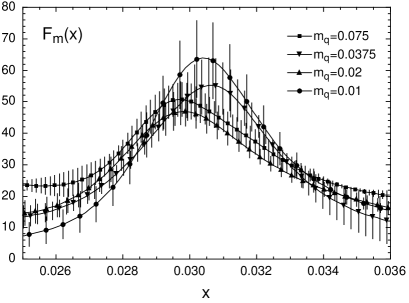
For a second-order phase transition, the singular part of the chiral susceptibility is expected to scale as
| (29) |
where is a function of scaling variable which we take to be
| (30) |
We show in Fig. 5 estimates of the scaling function using data for the size . Both and are normalized by the values for , and the measured values are employed for the exponents: , and . Given the magnitude of statistical error which increases from 10% to 20% as decreases from to , we find scaling with respect to quark mass to be reasonably satisfied.
We have also calculated the scaling function using the values for the exponents[18] , and the value of obtained with a fit of with the value for . We find that scaling worsens. In particular the curve for the smallest quark mass is too high in this case.
6 Conclusions
In this article we have reported results of our study of the two-flavor chiral phase transition with the Kogut-Susskind quark action on an lattice. Our analysis of the spatial volume dependence of the peak height of susceptibilities confirms the absence of a phase transition for as reported previously[3, 4]. At the peak height exhibits an almost linear increase over the sizes contradicting a previous work[4]. We have argued, based on an examination of fluctuations of observables and a consideration of spatial volume normalized by the zero-temperature pion mass, that the increase is a transient phenomenon arising from an insufficient spatial volume. We conclude that a first-order transition is likely to be absent also at .
We have also found that the quark mass dependence of susceptibilities is consistent with a second-order transition located at ; the critical exponents we have obtained satisfy required consistency conditions, and the susceptibility reasonably scales in terms of variable defined with the measured exponents. However, the values of exponents themselves deviate from either or mean-field theory predictions.
Further work is needed to elucidate the universality nature of the two-flavor chiral phase transition in finite-temperature QCD.
Acknowledgements
This work is supported by the Supercomputer Project (No. 1) of High Energy Accelerator Research Organization (KEK), and also in part by the Grants-in-Aid of the Ministry of Education (Nos. 08640349, 08640350, 08640404, 08740189, 08740221).
References
- [1]
- [2]
- [3] M. Fukugita, H. Mino, M. Okawa and A. Ukawa, Phys. Rev. Lett. 65 (1990) 816; Phys. Rev. D42 (1990) 2936.
- [4] F. R. Brown, F. P. Butler, H. Chen, N. H. Christ, Z. Dong, W. Schaffer, L. I. Unger and A. Vaccarino, Phys. Rev. Lett. 65 (1990) 2491; A. Vaccarino, Lattice 90, Nucl. Phys. B (Proc. Suppl.) 20 (1991) 263.
- [5] R. D. Pisarski and F. Wilczek, Phys. Rev. D29 (1984) 338; F. Wilczek, Int. J. Mod. Phys. A7 (1992) 3911; K. Rajagopal and F. Wilczek, Nucl. Phys. B399 (1993) 395.
- [6] F. Karsch, Phys. Rev. D49 (1994) 3791.
- [7] F. Karsch and E. Laermann, Phys. Rev. D50 (1994) 6954.
- [8] A preliminary account of the present work was reported in, A. Ukawa, Lattice 96, Nucl. Phys. B (Proc. Suppl.) 53 (1997) 106.
- [9] E. Laermann, these proceedings; G. Boyd, F. Karsch, E. Laermann and M. Oevers, BI-TP 96/27 (hep-lat/9607046).
- [10] D. Toussaint, these proceedings.
- [11] S. Gottlieb, W. Liu, D. Toussaint, R. L. Renken and R. L. Sugar, Phys. Rev. D35 (1987) 2531.
- [12] I. R. McDonald and K. Singer, Discuss. Faraday Soc. 43 (1967) 40; A. M. Ferrenberg and R. H. Swendsen, Phys. Rev. Lett. 61 (1988) 2635; 63 (1989) 1195.
- [13] Y. Kuramashi, M. Fukugita, H. Mino, M. Okawa and A. Ukawa, Phys. Rev. Lett. 71 (1993) 2387 ; 72 (1994) 3448.
- [14] T. Blum, L. Kärkkäinen, D. Toussaint and S. Gottlieb, Phys. Rev. D51 (1995) 5153.
- [15] A. Kocić and J. Kogut, Phys. Rev. Lett. 74 (1995) 3109; Nucl. Phys. B455 (1995) 229.
- [16] G. A. Baker, B. G. Nickel and D. I. Meiron, Phys. Rev. B17 (1978) 1365.
- [17] J. C. Le Guillou and J. Zinn-Justin, Phys. Rev. B21 (1980) 3976; J. Phys. Lett. (Paris) 46 (1985) L137.
- [18] K. Kanaya and S. Kaya, Phys. Rev. D51 (1995) 2404.