Phase Structure of Lattice QCD with Wilson fermion at Finite Temperature
Abstract
We review our attempt at understanding the phase structure of lattice QCD with the Wilson fermion formulation at finite temperature, based on a spontaneous breakdown of parity-flavor symmetry. Numerical results demonstrating explicitly the spontaneous breakdown of parity-flavor symmetry beyond the critical line at both zero and finite temperatures are reported. The phase structure and order of the chiral transition are reported for ,3, and 4 flavors, and the approach towards the continuum limit is discussed.
1 Introduction
Studying the finite-temperature QCD phase transition via the lattice regularization with the Wilson fermion formulation is known to be more difficult than with the staggered fermion formulation. This is because of absence of an order parameter due to explicit chiral symmetry breaking introduced by the Wilson term. A naive expectation for the phase structure in a vs. plane at finite temperature with fixed temporal lattice size , which was the basis of early studies of the phase transition[1], is sketched in Fig. 1.
At zero temperature the pion mass vanishes along a line , the critical line, which runs from in the strong coupling limit to in the weak-coupling limit. At finite temperature, which is realized at fixed where is a spatial lattice size, another critical line , the finite temperature phase transition line, should appear starting from , which corresponds to the deconfinement transition of pure gauge theory. The critical line, though rigorously speaking some part of the line may merely show cross-over phenomena, is expected to extend into the non-zero region from below and hopefully to merge with the critical line at some . The crossing point, if it exists, may be identified as the point of chiral phase transition, since at this point the finite temperature phase transition occurs in the presence of a massless pion, or equivalently massless quarks.
In Fig. 1 the region on the left of and below is in the low temperature phase, while the region on the right of is in the high temperature phase. The critical line in the high temperature phase is no more critical, since the pion mass does not vanish in the high temperature phase, as naively expected and confirmed by numerical simulations. Therefore in Fig. 1 a dotted line is assigned to the part of the line included in a high temperature phase, where the pion mass does not vanish.
Although the phase structure above seems plausible at first sight, several questions arise. First of all, what is the meaning of at finite temperature ? We define as a line of vanishing pion mass at zero temperature, but according to the phase structure above the pion does not become massless on in the high temperature phase. This suggests that a location of the line may depend on temperature if it is defined as a line of vanishing pion mass at corresponding temperature. A related question is the nature of the region above at small , where a question mark is assigned in Fig. 1. This region seems to belong to the low temperature phase since the pion can become arbitrarily light in the region near . If this is the case, the line should continue to exist beyond the chiral transition point in larger region, so that the low temperature phase above the can be separated from the high temperature phase. This should be numerically confirmed. A more fundamental question is how one can understand the existence of a massless pion at zero temperature without recourse to chiral symmetry.
In this talk we try to answer these questions, based on interpretation of the massless pion in the Wilson fermion formulation, using both analytic methods and numerical simulations.
2 Phase structure at zero temperature
2.1 Parity-flavor breaking scenario
In this subsection we briefly review our understanding of massless pions appearing at in the Wilson fermion formulation at zero temperature based on refs.[3, 4, 5].
Let us consider 2-flavor QCD. Since pions become massless at we expect the following behavior of the 2 point function for the corresponding operators ():
where the correlation length is related to the mass of the meson as , is some exponent, and is the space volume.
Since an existence of massless meson implies a divergent correlation length at , the operator corresponding to the meson is expected to develop a long-range order for so that . This non-zero condensation is possible for all in general, but using flavor symmetry we can make a change of variables such that only one develops a non-zero vacuum expectation value. Hereafter, without loss of generality, we assume that and .
This condensation spontaneously breaks both parity and flavor symmetry, and a second order phase transition from the parity-flavor symmetric phase to a parity-flavor broken one occurs at . Therefore a massless (neutral) meson corresponding to the operator can be interpretated as a massless mode associated with this second order phase transition, not a Nambu-Goldstone boson. This neutral meson becomes massless only at the transition point , while the charged mesons corresponding to the linear combinations of and operators stay massless in the broken phase since they are the Nambu-Goldstone bosons associated with the flavor symmetry breaking.
According to the above interpretation we expect near , with a critical exponent , where we define for later uses. Since low energy properties of mesons may be described by an effective 4-dimensional scalar field theory, we can expect the phase transition to be mean-field like up to logarithmic corrections and therefore , which reproduces the well-known PCAC relation where quark mass may be defined as .
On the other hand, if we define the current quark mass via the axial Ward identities[2]:
| (2) |
this automatically satisfies the PCAC relation at small . However, since this is not a tunable parameter, an existence of the chiral limit where becomes zero is not ensured. Our scenario explains why such a tunning is possible. Note that if .
This new scenario for the existence of the massless pion in the Wilson fermion formulation has been confirmed analytically in the strong coupling and expansions. See refs.[3, 4] for details.


2.2 Numerical evidence for the parity-flavor breaking phase
In this subsection numerical evidence will be given for the existence of the parity-flavor breaking phase in full QCD with Wilson fermions.
In order to examine if can develop a non-zero expectation value, we have to add a source term to the Wilson fermion action. The reason for this is as follows. Since changes its sign according to the sign of for an arbitrary configuration, it is easy to show, at on a finite lattice, that
without averaging over configurations. Therefore one can not see any signal of a non-zero value of from simulations with . This is in contrast to the case of the magnetization of the Ising model, where it takes non-zero values on a given configuration for zero magnetic field and may change its sign from configuration to configuration. To obtain the correct value of in the Wilson fermion formulation, one has to take limits in the following order:
This means that one should make an extrapolation to from a series of values at non-zero ’s on finite but sufficiently large lattices.
Fortunately, even in the presence of the source term, the Wilson fermion determinant is still real positive, so that the hybrid Monte Carlo method can be utilized.
In order to establish the parity-flavor breaking phase we have carried out a full QCD simulation with at , where analytic expressions for the order parameters are available for non-zero external field within expansion[3].
In Fig. 2, and are plotted as a function of at on a lattice with and on a lattice with , together with the analytic predictions with the corresponding in the strong coupling and large limits. Since the agreement between the numerical data and the analytic predictions is very good, it can be established at least in the strong coupling limit that the parity and flavor symmetry breaking phase transition really occurs at () and is non-zero in the limit at (). We have also shown that finite size effects on the order parameter is very small by comparing data on a lattice with those on a lattice or with the analytic predictions which correspond to the values in the infinite volume limit.


As a non-trivial check we have calculated susceptibilities , , and , which are defined by
We have plotted in Fig. 3 and , in Fig. 4, together with the analytic predictions. The agreement between the numerical data and the analytic predictions is reasonably good, except for deviations observed deep in the broken phase, where our analytic formula becomes inaccurate in the presence of massless Nambu-Goldstone charged pions. These results for the susceptibilities also support our conclusion about the existence of the parity-flavor breaking phase.
2.3 Phase structure at small
In the previous subsection we have numerically established that the parity-flavor breaking phase indeed exists in the strong coupling limit. This phase should continue to exist in the strong coupling region, since a strong-coupling expansion, which support an existence of the phase[3], is convergent around . However an understanding of the phase structure in the weak coupling region is particularly important, since the continuum limit can be defined only in this region. Therefore, in this subsection, we consider how the phase structure changes toward the weak coupling region.
In Fig. 5 we propose the expected phase structure of lattice QCD with 2 flavor Wilson fermions in the vs. plane, based on the reasoning mentioned later. At there are only two critical lines, while there are ten critical lines at , and 5 points where two lines meet at . At on can define the usual continuum limit where only a physical mode of the sixteen zero modes of the lattice fermion becomes light, while the continuum limits at other 4 points contains light doubler modes. For example 4 doubler modes, which has one of the momentum component near , appear as light fermions at . Note that the phase diagram is shown to be symmetric under the transformation.
There are several evidence for the existence of multiple critical lines in the weak coupling region. First of all, a phase structure similar to Fig. 5 has been found for the Gross-Neveu model in 2 dimensions in the large limit, regulated on the lattice using Wilson fermions[3, 5, 6]. The existence of a multiple structure of the critical lines has been also suggested from studies of eigen-value spectra of the Wilson fermion matrix on quenched configurations[7, 8] and on full QCD configurations[9].
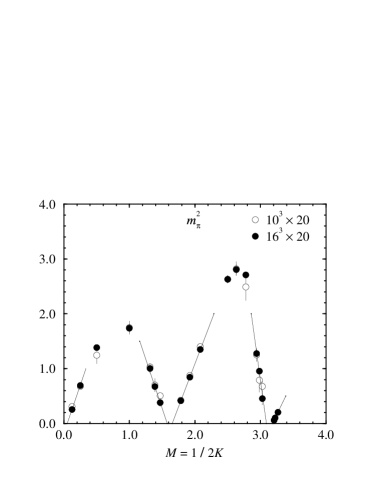
To establish the multiple structure of the critical lines we performed new simulation using quenched configurations without adding the external field . We have calculated the pion mass at on a and a lattice to find the location of multiple ’s. The pion propagator is averaged over – configurations.
We plot our results for the pion mass squared in Fig. 6 as a function of . A reasonable agreement of results for and spatial sizes shows that finite spatial size effects are not severe in our data. We observe that there exist four more critical values of vanishing pion mass in addition to the conventional one located at the right most of the figure. The existence of 5 critical points for at fixed supports the phase structure proposed in Fig. 5.
3 Phase structure at finite temperature
Since we now understand the phase structure of lattice QCD with the Wilson fermion formulation at zero temperature, we can extend our investigation to the case at finite temperature.
3.1 Expected phase structure at fixed

In this subsection, based on the finding at zero temperature, we propose the phase structure for a fixed temporal extension corresponding to finite temperature.
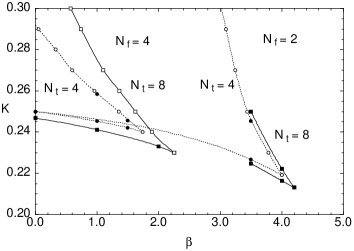
We first consider how the multiple structure of critical lines is modified for a finite . An important hint for the answer to this question again come from the Gross-Neveu model in 2 dimensions. In Fig. 7 we plot the critical line corresponding to on the plane for ,16,8,4 and 2 where and are the bare coupling and quark mass, respectively, the latter related to the hopping parameter through . The crucial feature revealed in Fig. 7 is that the three cusps of the critical line retract from the weak coupling limit for finite temporal lattice sizes, forming a single continuous line which shifts toward strong coupling as decreases. Thus, for a finite , the critical line is absent for sufficiently weak coupling.
The close resemblance of the Gross-Neveu model and QCD such as the asymptotic freedom and the spontaneous chiral symmetry breaking suggests that a similar behavior of the critical line will hold for QCD, except that the number of cusps should increase to five because of the difference in the number of dimensions, as seen in the previous section. For the finite temperature case, an apparent disappearance of the critical line toward weak coupling has been noticed in previous studies[10, 11]. This means that at finite temperature differs from at zero temperature, if we define the as a line of vanishing pion (screening) mass at the corresponding temperature.
In addition to the deformation of the critical lines at finite temperature, the thermal transition line , which is absent in the Gross-Neveu model, should appear in QCD. As discussed in the introduction, in order to define the unique point of chiral phase transition at fixed , the thermal line has to cross the critical line . However the line can not go into the parity-flavor breaking phase, since the massless pions exist in the phase so that it belongs to the low temperature phase. Therefore the line never cross the line defined at fixed . In other words the region close to the critical line has to be in the low temperature phase even after it turns back toward strong coupling. This means that the thermal line should run past the turning point of the critical line111Logically it may be possible that the line touches without crossing it. and continue toward larger value of , as sketched in Fig. 8. Although seems to cross as seen in Fig. 8, no special criticality associated with massless quarks occurs at the crossing point. Therefore, if the above phase structure is true, we can not assign an unique point to define the point of chiral phase transition.
3.2 Results for = 2 at =4
In this and the following subsections we review results supporting the phase structure proposed in the previous subsection. Here we report results for the 2-flavor case obtained for the temporal size with the standard one plaquette action for gauge fields.
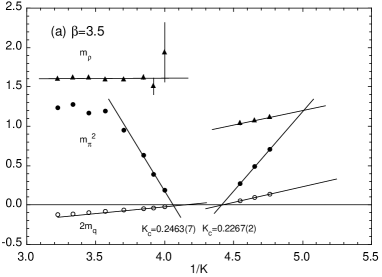
We first show evidence that the cusps of the critical line retract from the weak coupling limit for a finite as speculated in the previous subsection. For this purpose we have carried out hybrid Monte Carlo simulations of full QCD using the Wilson quark action with on an lattice[12]. In Fig. 9(a) we present our results for the and screening masses, measured on the periodically doubled lattice in the spatial directions , at as a function of . Also plotted is the quark mass defined via the axial Ward identity, eq.(2).
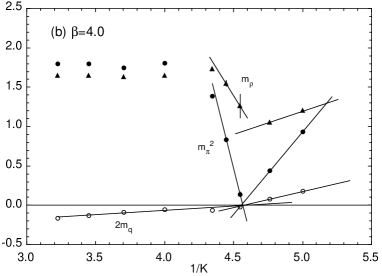
As usual the pion mass squared and the quark mass linearly vanish almost simultaneously at the conventional critical point , while another critical point at can be clearly observed from the behavior of the pion mass squared and the quark mass in the larger region. The existence of two critical points close to each other is quite analogous to Fig. 6 in quenched QCD at zero temperature. 222Although we have not carried out further simulations at larger to identify 3 more critical points, there is no reason to doubt their existence. On the other hand Fig. 9(b) shows how the behavior of these masses changes at . We observe that the gap between the two critical values has either become extremely narrow or disappeared. These results at two values are consistent with the expected deformation of the critical line at fixed as shown in Fig. 8.


Now one may ask whether the parity-flavor symmetry is indeed spontaneously broken in the region between two ’s at . In order to confirm this we have carried out new simulations with non-zero [13]. In fig. 10 we plot the parity-flavor breaking order parameter as a function of for ,0.1,0.05,0.02 and 0.01. Vertical lines mark the position of the critical points at . We clearly observe that the order parameter between the two critical values and tends to a non-vanishing value as the external field is reduced, while it decreases toward zero outside, supporting the spontaneous breakdown of parity-flavor symmetry between the two critical points.

We next examine if the thermal line run past the turning point of the critical line around and continue towards larger values of , so that the region close to the critical line is in the low-temperature phase even after it turns back toward strong coupling. For that purpose we have measured thermodynamic observables, the real part of the Polyakov line and quark and gluon entropy densities in lattice units, and plot them as a function of at in Fig. 11(a). The two vertical lines again show the position of the critical points estimated from the pion screening mass. Large values of these observables suggest that the system is in the high temperature phase for smaller values of . However they decrease as increases toward the critical point at , becoming roughly similar in magnitude to those on the other side of the conventional critical point at . Since the conventional critical point is in the low-temperature phase, a similarity of these thermodynamic quantities in magnitude support our expectation that the other critical point is also in the low-temperature phase.
Behaviors of thermodynamic observables at are shown in Fig. 11(b), together with the vertical line which marks the point where the two linear extrapolations of the pion screening mass squared in Fig. 9(b) cross each other. Since the thermodynamic quantities around the line stay small, the region around the “crossing point” is likely to be also in the low-temperature phase. On the other hand the increase of the three quantities across the line suggests that the thermal line runs very close to the critical line at . Within the resolution of our numerical simulation, however, we can not exclude the possibility that the thermal transition line touches the critical line around and run away again for larger .
Overall results in this subsection are consistent with our proposed phase diagram in Fig. 8. For definiteness, in Fig. 12, we draw the phase diagram of two flavor QCD for , mainly based on our finding. We estimate the location of the critical line (solid line) from the points of vanishing pion screening mass (solid circles) as usual, supplementing the points where the inverse of the number of conjugate gradient iterations in the runs is linearly extrapolated to zero(open circles). Here we assume that the turning point of the critical line is located at . The dotted line represents the thermal transition line estimated from previous works (open circles)[1, 10, 11]. Our drawing of the dotted line continues above the upper part of the cusp of , though its precise location can not be determined from our numerical data.
3.3 RG improved gauge action for =2
3.3.1 Evidence of the cusp structure of the critical line


From our data in the previous subsection the thermal transition around seems to be a smooth cross-over at , and this agrees with the prediction that the chiral phase transition is of second order for [14] if the effect of the chiral anomaly remains at . However it has been reported that the thermal transition becomes strongly first order around [10], where the thermal transition line comes very close to the zero temperature critical line. According to the phase diagram in the previous subsection, however, the critical line defined for fixed does not exist in the region where the first order transition is observed. In fact the pion screening mass never becomes small in the region of the first order transition. Therefore this first order transition has nothing to do with the chiral phase transition. Instead it is likely that it is a lattice artifact, and this view is indeed supported[15] by the fact that the strong first order transition disappears if one uses the renormalization group (RG) improved action for gauge fields[16].
One may wonder whether our findings such as the parity-flavor breaking phase, the multiple structure of the critical lines, the formation of the cusp of the critical lines at finite temperature, and the relation of the thermal transition line to the critical line, are universal, and not a lattice artifact like the first order transition at .
To partly answer this question, we have made a new run using the RG improved gauge action with 2 flavors of Wilson quark action[17]. In Fig.13 the pion screening mass squared and the quark mass are shown as a function of at (a) and (b) on an lattice, periodically doubled in one of spatial directions for mass measurements. These results show that there are two critical points at , whose gap then becomes very narrower or disappears at .
Therefore at least the multiple structure of the critical lines and the formation of the cusp of the critical line at finite temperature are common properties in both the standard gauge action and the RG improved one, and they may well be not a lattice artifact.

3.3.2 Scaling analysis
Assuming the chiral phase transition for 2 flavor QCD is of second order, the magnetization is expected to be described by a single scaling function,
| (3) |
where is the external magnetic field and is the reduced temperature. For 3 dimensional models, the critical exponents are given by and 0.2061(9) [18].
Due to the explicit chiral symmetry breaking of the Wilson quark, eq. (3) contains the finite lattice spacing errors, which may be reduced by the improved action. Indeed it has been reported that eq. (3) is numerically satisfied for the RG improved action[15] as follows.
Usually is identified as . For Wilson quarks, a proper subtraction is necessary to obtain the correct continuum limit. The properly subtracted defined via the axial Ward identity[2] as
| (4) |
is proposed to be used for , together with and , where is a free parameter[15]. Assuming that the scaling function is universal, and thus using the one obtained for an model [19], one can fit the data by adjusting and the scales for and , with the exponents fixed to the values. This works well with , as shown in Fig. 14(a). Since it is suggested that the QCD chiral transition might be described by the mean-field (MF) criticality[20], one may also test if the MF scaling function together with the MF exponents, and , is consistent with the data. Fig. 14(b) shows, however, that it gives no reasonable fit[15]. The success of this scaling test with exponents suggest not only that the chiral transition in the continuum limit is described by the criticality but also that the chiral transition is of second order for 2 flavors. It also shows that the RG improved gauge action indeed reduces the violation of the scaling relation, eq. (3).
3.4 Results for 3 and more flavors at


The thermal chiral transition is a smooth cross-over for 2 flavors of Wilson quark action, and hopefully it will show the criticality of the second order phase transition in the continuum limit. On the other hand, the chiral transition of QCD for is predicted to be of first order in the continuum[14]. Therefore, the thermal transition with 3 or more light quarks should also be of first order at least in the scaling region, even though the chiral symmetry is explicitly broken by the Wilson term.
Actually a strong first-order transition has been observed for at on an lattice[21]. Assuming the behavior of the critical lines at fixed is similar for and 3, their data also tell us that the tip of the cusp of the critical line, if it exists, is located around . Like the case the signal for the first order transition is only observed far away from this tip of the cusp. Therefore, in order to claim that the thermal transition with three light Wilson quarks is of first order at , one should find the first order signal near the tip of the cusp around . A more fundamental question is whether the phase structure we find for , such as the multiple structure of the critical lines and the formation of the cusp at fixed holds also for or more. Moreover if the thermal transition near the tip of the cusp is of first order as expected, we may determine the precise location of , so that the question whether the thermal line and the cusp of the critical line touch each other or not may be clarified, whereas it is difficult to answer it for a smooth cross-over like in the =2 case.
In order to answer these questions we have made a new run for QCD using the Hybrid R algorithm[17]. In Fig. 15 the pion mass squared and the quark mass are again plotted as a function of at on an lattice. The linear extrapolation of these quantities confirms the existence of two ’s. Like the case the multiple structure of the critical lines presents for . Although we have not made similar measurement at , we expect, from the data of previous study[21], that the critical line turns back toward the strong coupling limit, forming a cusp around .
As far as the finite temperature chiral transition is concerned, we observe that the strong first-order signal previously found around becomes weaker toward the stronger coupling, as is in the case of . To find a signal of the first-order transition near the tip of the cusp, we have made two sequences of runs varying and in accordance with relation that or , where is the critical line defined at , not at finite temperature. Two state signals very close to the tip of the cusp, which is expected to exist around (: ) and , are observed. In Fig. 16, we plotted the behavior of the Polyakov loop as a function of along the lines of or , together with the data previously obtained on the line of [21](, where the left most point may not be thermalized). The signals of the first-order transition are seen. Therefore the thermal transition around the tip of the cusp at may be of first order for 3 flavors, as expected from the continuum. It is noted, however, that this data is taken for fixed step size of the Hybrid R algorithm. Therefore more runs with a smaller is need to definitely claim the existence of the first order phase transition near the tip of the cusp.

Now we increase the number of flavors to 4. One of the advantage for =4 over the case is that the HMC method can be directly applied to it, and thus no extrapolation of is necessary. Our HMC runs for with are carried out on an lattice, and hadron masses are calculated on a periodically doubled lattice in one of spatial directions[13]. The location of the critical line is estimated from the screening pion mass squared and the position and order of the thermal transition is examined through the behavior of physical quantities.
In Fig. 17 we show the phase diagram for together with that for in Sec. 3.2. We find again a cusp structure similar to that of except for a shift of towards stronger coupling, which we qualitatively expect from a larger magnitude of sea quark effects for . We also find strong first-order signals across the thermal line away from the tip of the cusp as marked by solid squares. Similar to the cases of and 3, the transition becomes weaker towards the tip of the cusp, apparently turning into a smooth crossover at . The location of the crossover is indicated by open rectangles in Fig. 17.
One surprising thing is that no signal of the first order transition can be found so far near the tip of the cusp, contrary to our expectation. New runs are also made with an increased spatial size of . Results do not show any deviation from those on an lattice. Therefore it is unlikely that finite-size effects have rounded a first-order discontinuity into a smooth crossover on an lattice. To find the signal of the expected first order phase transition near the tip of cusp, as in the case of , simulations on the lines of should be performed. We reserve, however, this study for future investigations.
4 Approach toward the continuum limit
It is usually though that the continuum physics of finite temperature QCD can be extracted from the lattice simulations by the following procedure. For fixed the chiral transition point may be defined at the crossing point of and , and physical observables are measured at that point. One should repeat this for increased , which corresponds to the decreased lattice spacing as , to extract the continuum values of the observables.
Based on our understanding of finite temperature phase structures with Wilson fermion formulation, however, it now becomes clear that the thermal transition point at fixed in the presence of light quarks can be defined anywhere in the region around the tip of the cusp. Therefore, in principle, no unique definition of the chiral transition point exists at fixed . In practice, it is better to choose one definite prescription for the chiral transition point. For example, as shown in Fig. 18, the lower crossing point of and may be regarded as the chiral transition point, on which observables such as , etc have to be measured. To approach the continuum limit and to investigate the scaling behavior, one has to increase , repeat same measurements on the chiral transition point corresponding to increased .
One may choose freely another definition for the chiral limit, as the difference between two choices is and should disappear in the continuum limit. For example, the chiral limit may also be defined at the crossing point of and the line where the quark mass of eq.(2) vanishes. Note that but in general at finite temperature. In particular seems to run from the low temperature phase into the high temperature phase, so that it can cross .
In order to approach the continuum limit in this way, it is important to know how the cusp of the critical line moves when the temporal lattice size is increased. To get a hint for an answer to this question, we estimate the location of the critical lines on an lattice for and 4.
In Fig. 19 we plot the critical line estimated from the pion mass squared. Although the cusp is shifted toward weak coupling, the magnitude of shift is quite small both for and 4, so that the tip of cusp is still in the region of strong coupling for . The slow move of the tip has already been indicated in the previous studies for [21], whose data can be interpreted that the tip of the cusp is located at for and at even for . If this is indeed the case, a substantial increase in the temporal lattice size is needed for the tip of the cusp and the thermal transition line moving into the scaling region, which is usually though to start at for .
It should be noted that the slow move of the tip of the cusp has a significant impact also on spectrum calculations at zero temperature. Since the location of the tip of the cusp is controlled dominantly by the smallest extension of the lattice, the very large spatial size is necessary for an existence of the critical hopping parameter, thus an appearance of massless pions, in the scaling region. Otherwise the finite lattice size effect may become very large near the chiral limit at larger , or to say differently, it could happen that hadron masses are measured at some where the critical line is absent.
5 Conclusions
In this talk we have tried to present our understanding on the phase structure of QCD with Wilson fermion both at zero and finite temperatures, based on the spontaneous breakdown of parity-flavor symmetry. We have shown that so far all existing numerical data as well as analytic calculations are consistent with our understanding.
In future study it is intersting to investigate the phase structure of QCD with the improved Wilson fermion action (: clover action). Since we believe that the parity-flavor breaking mechanism to obtain massless pions is quite general for the Wilson fermion type action who looses the chiral symmetry, a similar phase structure is expected to exist. Furthermore it is important to see how fast the tip of cusp, if it exists, moves toward the scaling region as increases. Hopefully the improvement of the fermion action as well as that for the gauge action may overcome the problem of the slow move in the previous section.
Although a lot of things concerning the parity-flavor breaking mechanism still remain to be investigated, we think that no conceptual difficulty in Wilson-type fermion actions at finite temperature exists. So now it is a good time to start serious study, like the Kogut-Susskind quark action, to get real physical results from the lattice QCD with Wilson-type fermion action, but it may be necessary to use gauge and fermion improvements[16, 15, 22].
Acknowledgements
Numerical calculations for the present work have been carried out at Center for Computational Physics and on VPP500/30 at Science Information Center, both at University of Tsukuba. I thank my collaborators, Y. Iwasaki, K. Kanaya, T. Kaneda, S. Kaya, A. Ukawa, and T. Yoshié for useful discussions. I also thank Dr. G. Boyd for useful comments. This work is supported in part by the Grants-in-Aid of the Ministry of Education (Nos. 08640350, 09246206).
References
- [1] M. Fukugita, S. Ohta and A. Ukawa, Phys. Rev. Lett. 57 (1986) 1974; A. Ukawa, Nucl. Phys. B(Proc. Suppl.)9 (1990) 463. See also R. Gupta et al., Phys. Rev. D40 (1989) 2072; K. M. Bitar et al., Phys. Rev. D43 (1991) 2396.
- [2] M. Bochicchio et al., Nucl. Phys. B262 (1985) 331; S. Itoh et al., Nucl. Phys. B274 (1986) 33.
- [3] S. Aoki, Phys. Rev. D30 (1984) 2653; 33 (1986) 2377; 34 (1986) 3170; Phys. Rev. Lett. 57 (1986) 3136; Nucl. Phys. B314 (1989) 79.
- [4] S.Aoki and A. Gocksch, Phys. Lett. B231 (1989) 449; 243 (1990) 1092; Phys. Rev. D45 (1992) 3845.
- [5] S. Aoki, Prog. Theor. Phys. 122 (1996) 179.
- [6] T. Eguchi and R. Nakayama, Phys. Lett. 126B (1983) 89.
- [7] S. Itoh, Y. Iwasaki and T. Yoshié, Phys. Rev. D36 (1987) 527.
- [8] R. Setdoodeh, C.T.H. Davies, I.M. Barbour, Phys. Lett. B213 (1988) 195.
- [9] I.M. Barbour, E. Laermann, Th. Lippert, K. Schilling, Phys. Rev. D46 (1992) 3618.
- [10] C. Bernard et al., Phys. Rev. D46 (1992) 4741, 49 (1994) 3574, 50 (1994) 3377.
- [11] Y. Iwasaki et al., Phys. Rev. Lett. 67 (1991) 1494, 69 (1992) 21; Nucl. Phys. B(Proc. Suppl.)30 (1993) 327, 34 (1994) 314.
- [12] S. Aoki, A. Ukawa and T. Umemura, Phys. Rev. Lett. 76 (1996) 873; Nucl. Phys. B(Proc. Suppl.)47 (1996) 511.
- [13] S. Aoki, T. Kaneda, A. Ukawa and T. Umemura, Nucl. Phys. B(Proc. Suppl.)53 (1997) 438.
- [14] R. Pisarski and F. Wilczek, Phys. Rev. D29 (1984) 338.
- [15] Y. Iwasaki, K. Kanaya, S. Sakai and T. Yoshié, Nucl. Phys. B(Proc. Suppl.)42 (1995) 502; Y. Iwasaki, K. Kanaya, S. Kaya, S. Sakai and T. Yoshié, Nucl. Phys. B(Proc. Suppl.)47 (1996) 515; Y. Iwasaki, K. Kanaya, S. Kaya and T. Yoshié, Phys. Rev. Lett. 78 (1997) 179.
- [16] Y. Iwasaki, Nucl. Phys. B258 (1985) 141; Univ. of Tsukuba report UTHEP-118(1983), unpublished.
- [17] S. Aoki, Y. Iwasaki, K. Kanaya, S. Kaya A. Ukawa and T. Yoshié, in preparation.
- [18] K. Kanaya and S. Kaya, Phys. Rev. D51 (1995) 2404.
- [19] D. Toussaint, Phys. Rev. D55 (1997) 362.
- [20] A. Kocić and J. Kogut, Phys. Rev. Lett. 74 (1995) 3108.
- [21] Y. Iwasaki, K. Kanaya, S. Sakai and T. Yoshié, Z. Phys. C71 (1996) 337; Y. Iwasaki, K. Kanaya, S. Kaya, S. Sakai and T. Yoshié, Nucl. Phys. B(Proc. Suppl.)42 (1995) 499; Z. Phys. C71 (1996) 343; Phys. Rev. D54 (1996) 7010.
- [22] C. Bernard et al., Nucl. Phys. B(Proc. Suppl.)53 (1997) 446.