Field strength correlators in QCD at zero and
non–zero temperature
A. Di Giacomo,
E. Meggiolaro
and
H. Panagopoulos
Speaker at the conference.
Dipartimento di Fisica
dell’Università and I.N.F.N., Sezione di Pisa,
I–56100 Pisa, Italy.
Department of Natural Sciences,
University of Cyprus,
1678 Nicosia, Cyprus.
Abstract
We study, by numerical simulations on a lattice, the behaviour of the
gauge–invariant field strength correlators in QCD both at zero temperature,
down to a distance of 0.1 fm, and at finite temperature, across the
deconfinement phase transition.
1 INTRODUCTION
An important role in hadron physics is played by
the gauge–invariant two–point correlators of the field strengths in the
QCD vacuum. They are defined as
(1)
where is the field–stength tensor
and is the Schwinger phase operator needed to
parallel–transport the tensor to the point .
These correlators govern the effect of the gluon condensate on the level
splittings in the spectrum of heavy bound states
[1, 2, 3].
They are the basic quantities in models of stochastic confinement of colour
[4, 5, 6]
and in the description of high–energy hadron scattering
[7, 8, 9, 10].
A numerical determination of the correlators on lattice (with gauge group
) already exists, in the range of physical distances between 0.4 and 1
fm [11]. In that range falls off exponentially
What makes the determination of the correlators possible on the lattice,
with a reasonable computing power, is the idea [12, 13]
of removing the effects of short–range fluctuations on
large distance correlators by a local cooling procedure.
Freezing the links of QCD configurations one after the other, damps very
rapidly the modes of short wavelength, but requires a number of cooling
steps proportional to the square of the distance in lattice units to
affect modes of wavelength :
(3)
Cooling is a kind of diffusion process.
If is sufficiently large, there will be a range of values of in
which lattice artefacts due to short–range fluctuations have been removed,
without touching the physics at distance ; by lattice artefacts we
mean statistical fluctuations and renormalization effects from lattice to
continuum. This removal will show up as a plateau in the dependence
of the correlators on . This was the technique successfully used in
Ref. [11]. There, the range of distances explored was from
from 3–4 up to 7–8 lattice spacings at (),
which means approximately from 0.4 up to 1 fm in physical distance.
The lattice size was .
In Sect. 2 we discuss new results obtained on a lattice, at
between 6.6 and 7.2: at these values of the lattice size is still
bigger than 1 fm, and therefore safe from infrared artefacts, but
lattice spacings now correspond to physical distances of about
0.1 fm. Since what matters to our cooling procedure is the distance in
lattice units, we obtain in this way a determination of the correlators at
distances down to 0.1 fm [14].
All of the above concerns the theory at zero temperature.
In Sect. 3 we go further and determine the behaviour of the correlators at
finite temperature for the pure–gauge theory with colour group and in
particular we study their behaviour across the deconfining phase transition
[15]. The motivations to do that stem from Refs.
[16, 17, 18].
2 RESULTS AT
The most general form of the correlator compatible with the invariances of
the system at zero temperature is [4, 5, 6]
(4)
and are invariant functions of . We work in
the Euclidean region.
It is convenient to define a and a
as follows:
(5)
On the lattice we can define a lattice operator , which is
proportional to in the naïve continuum limit, i.e., when the
lattice spacing .
Making use of the definition (5) we can thus write, in the same limit,
(6)
Equations (6)
come from a formal expansion of the operator, and are expected to be modified,
when the expectation value is computed, by lattice artefacts, i.e., by
effects due to the ultraviolet cutoff. These effects can be estimated in
perturbation theory and subtracted [19].
Instead we remove them by cooling the quantum fluctuations at the scale of
the lattice spacing, as explained in the Introduction.
After cooling, and are expected to
obey Eqs. (6).
The typical behaviour of and of
along cooling is shown in Fig. 1.
Our data are the values of the correlations at the plateau.
Figure 1: A typical behaviour of
(diamonds; , , lattice )
and of (squares; , , lattice )
during cooling.
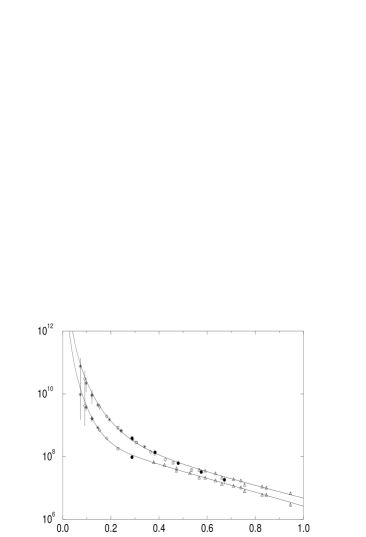
Figure 2: The functions (upper curve) and
(lower curve)
versus physical distance (in fermi units). Triangles correspond to the
data of Ref. [11]. The lines are the curves for
and obtained from the best fit of Eqs.
(10) and (11).
We have measured the correlations on a lattice at distances ranging
from 3 to 14 lattice spacings and at .
From renormalization group arguments,
(7)
where is the fundamental mass–scale of QCD in the lattice
renormalization scheme.
At large enough , is given by the usual two–loop
expression:
(8)
for gauge group and in the absence of quarks.
At sufficiently large one also expects that
(9)
where is given by Eq. (8) and terms of higher order in are
negligible.
In Fig. 2 we plot
and versus . In this figure we have also plotted the values
of the correlators obtained in Ref. [11], corresponding to
physical distances fm.
We have applied a best fit to all of these data with the functions
(10)
We have obtained the following results:
(11)
with . The continuum lines in Fig. 2
have been obtained using the parameters of this best fit.
With the value of
determined from the string tension [20] we obtain
(12)
The correlation length , which enters the non–perturbative
exponential terms of and , as well as the magnitude
of the coefficients and , are compatible with the values obtained
in Ref. [11].
We stress again that we have been able to observe terms
proportional to in the correlations because we have worked at
larger values of , where the distance between two points
(far enough in lattice units so that the correlation is not modified by
cooling before lattice artefacts are eliminated) is small compared with
in physical units. A larger lattice () has been
necessary to avoid infrared artefacts.
3 RESULTS AT FINITE
To simulate the system at finite temperature, a lattice is used of spatial
extent , being the temporal extent,
with periodic boundary conditions.
The temperature corresponding to a given value of is
given by
(13)
where is the lattice spacing, whose expression in terms of
is given by Eqs. (7) and (8).
At finite temperature, the space–time symmetry is broken down to
the spatial symmetry and in principle the bilocal correlators (1)
are now expressed in terms of five independent functions
[16, 17, 18] (instead of two as in the
zero–temperature case); two of them are needed to
describe the electric–electric correlations:
(14)
where is the electric field operator and
[].
Two further functions are needed for the magnetic–magnetic correlations:
(15)
where is the magnetic field
operator. Finally, one more function, , is necessary to describe
the mixed electric–magnetic correlations.
The five quantities , , ,
and are all functions of , due to rotational
invariance, and of , due to time–reversal invariance.
From the conclusions of Refs. [16, 17, 18],
one expects that is related to the (temporal)
string tension and should have a drop just above the deconfinement critical
temperature . In other words, is expected to be the order
parameter of the confinement.
Similarly, is related to the spatial string tension
[16, 17].
We have determined the following four quantities
(16)
by measuring appropriate linear superpositions of the correlators (14)
and (15) at equal times (), on a lattice
(, in our notation).
The critical temperature for such a lattice corresponds to
.
The behaviour of and is shown
in Figs. 3 and 4 respectively, on three–dimensional plots versus
and the physical spatial distance.
Due to the logarithmic scale, the errors are comparable with
the size of the symbols and the lines connecting the points are drawn as an
eye–guide. A clear drop is observed for and
across the phase transition, as expected.
Figure 3: The quantity
[defined by the first Eq. (16)] versus and the physical spatial
distance (in fm).
Figure 4: The quantity
[defined by the second Eq. (16)] versus and the physical spatial
distance (in fm).
On the contrary, no drop is visible across the transition for
the magnetic correlations and :
as an example, the behaviour for is shown in Fig. 5.
Figure 5: The quantity
[defined by the fourth Eq. (16)] versus and the physical spatial
distance (in fm).
Our results can be summarized as follows:
(i) In the confined phase (), until very near to the temperature of
deconfinement, the correlators, both the electric–electric type (14) and
the magnetic–magnetic type (15), are nearly equal to the correlators at
zero temperature [14]: in other words, and for .
(ii) Immediately above , the electric–electric correlators (14) have
a clear drop, while the magnetic–magnetic correlators (15) stay almost
unchanged, or show a slight increase.
More precisely, looking at the values for the difference
(17)
between the two quantities reported in Figs. 4 and 3 respectively, one
finds that the quantity does not show any drop across the
phase transition at . So the clear drop seen in the quantities
and across is entirely due
to a drop of alone. This result confirms the conclusion of
Refs. [16, 17, 18], where was related to
the (temporal) string tension .
Similarly, one can look at the following difference:
(18)
One thus
finds that does not show any drop across the transition and,
in addition, it is nearly equal to (). From the fact that the quantities
and stay almost unchanged (or even show a slight
increase) across , we conclude that the same must be true also for
. It was shown in Refs. [16, 17] that
is related to the spatial string tension .
Recent lattice results [21] indicate that is
almost constant around and increases for : this fact is in
good agreement with the behaviour that we have found for .
ACKNOWLEDGEMENTS
This work was done using the CRAY T3D of the CINECA Inter University
Computing Centre (Bologna, Italy). We would like to thank the CINECA for
having put the CRAY T3D at our disposal and for the kind and highly qualified
technical assistance.
We thank Günther Dosch and Yuri Simonov for many
useful discussions.
References
[1]
D. Gromes, Phys. Lett. 115B (1982) 482.
[2]
M. Campostrini, A. Di Giacomo and S. Olejnik,
Z. Phys. C31 (1986) 577.
[3]
Yu.A. Simonov, S. Titard and F.J. Yndurain, Phys. Lett. B354
(1995) 435.
[4]
H.G. Dosch, Phys. Lett. 190B (1987) 177.
[5]
H.G. Dosch and Yu.A. Simonov, Phys. Lett. 205B (1988) 339.
[6]
Yu.A. Simonov, Nucl. Phys. B324 (1989) 67.
[7]
O. Nachtmann and A. Reiter, Z. Phys. C24 (1984) 283.
[8]
P.V. Landshoff and O. Nachtmann, Z. Phys. C35 (1987) 405.
[9]
A. Krämer and H.G. Dosch, Phys. Lett. 252B (1990) 669.
[10]
H.G. Dosch, E. Ferreira and A. Krämer, Phys. Rev. D 50 (1994)
1992.
[11]
A. Di Giacomo and H. Panagopoulos, Phys. Lett. B285 (1992) 133.
[12]
M. Campostrini, A. Di Giacomo, M. Maggiore, H. Panagopoulos and E. Vicari,
Phys. Lett. 225B (1989) 403.
[13]
A. Di Giacomo, M. Maggiore and S. Olejnik,
Phys. Lett 236B (1990) 199;
Nucl. Phys. B347 (1990) 441.
[14]
A. Di Giacomo, E. Meggiolaro and H. Panagopoulos, Pisa preprint IFUP–TH
12/96 (1996); Cyprus preprint UCY–PHY–96/5 (1996); hep–lat/9603017.
[15]
A. Di Giacomo, E. Meggiolaro and H. Panagopoulos, Pisa preprint IFUP–TH
14/96 (1996); Cyprus preprint UCY–PHY–96/6 (1996); hep–lat/9603018.