Dirac Spectrum, Axial Anomaly and the QCD Chiral Phase Transition ††thanks: This work was done in collaboration with Dong Chen, Weonjong Lee, Robert Mawhinney, and Decai Zhu. The work was supported in part by the US department of Energy.
Abstract
The QCD phase transition is studied on and lattices both with and without quark loops. We introduce a new zero-flavor or quenched species of quark and study the resulting chiral condensate, as a function of the mass, . By examining for we gain considerable information about the spectrum of Dirac eigenvalues. A comparison of and 0.025 shows little dependence of the Dirac spectrum on such a light, dynamical quark mass, after an overall shift in is removed. The presence of sufficient small eigenvalues to support anomalous chiral symmetry breaking in the high temperature phase is examined quantitatively. In an effort to enhance these small eigenvalues, is also examined in the pure gauge theory in the region of the deconfinement transition with unexpected results. Above the critical temperature, the three phases show dramatically different chiral behavior. Surprisingly, the real phase shows chiral symmetry, suggesting that a system with one flavor of staggered fermion at will possess a chiral a phase transition—behavior not expected in the continuum limit.
1 INTRODUCTION
The spectrum of the Dirac operator is closely related to a number of important aspects of finite temperature QCD. First, a non-zero density of small eigenvalues is necessary for spontaneous chiral symmetry breaking[1]. Second, if the QCD phase transition is second order, one expects this eigenvalue spectrum to show critical behavior for . Third, the Dirac spectrum should be particularly sensitive to the effects of quark loops since the Dirac determinant for small quark mass strongly suppresses gauge configurations with small Dirac eigenvalues. Finally, the universality arguments which predict the order of the QCD phase transition[2], rely on the explicit breaking of the continuum symmetry by the axial anomaly. Such anomalous symmetry breaking requires a significant density of small eigenvalues.
Since it is difficult to obtain the information about the spectrum directly we choose to examine a less familiar quantity: the quenched or zero-flavor chiral condensate for an auxiliary quark field with mass . By studying the dependence on , we obtain interesting, qualitative information about the spectrum, which suggests unexpected behavior near the QCD phase transition.
We begin with a normal, full QCD simulation at finite temperature described by the partition function:
| (1) |
Here the integral is performed over all link matrices and the gauge action is given by
| (2) |
with the ordered product of the four matrices associated with the fundamental plaquette . We use the staggered fermion Dirac operator .
The determinant entering the partition function in Eq. 1 represents the effects of quark loops, for flavors of quarks of mass . We will refer to the corresponding lattice quark fields as . In this paper we introduce a second species of fermions, , with mass which will appear in observables but does not enter the quark determinant. These fermions may be thought of as quenched or quarks. We then compute the expectation value of the quantity in the thermal background specified by the partition function of Eq. 1. Thus,
| (3) |
where the average is calculated using the distribution of gauge fields in the QCD path integral. Although this quantity is no easier to compute than the normal chiral condensate , the mass can be varied without changing the mass which enters the Boltzmann factor and which must be fixed during a particular Monte Carlo run. Typically we study 25 values of .
This quantity is of special interest because it is a simple transform of the Dirac eigenvalue density. If we evaluate the propagator in Eq. 3 by inserting a complete set of eigenfunctions of , and averaging over , we find
| (4) |
Here we have exploited the symmetry which makes the Dirac spectrum symmetric about zero and introduced , the Dirac eigenvalue density per unit volume, averaged over the thermal distribution of Eq. 1. The function depends on and the dynamical quark mass .
Thus, is a transform of the Dirac spectrum, strongly weighted toward eigenvalues . Note the chiral symmetry for the quark field , present in the staggered fermion formulation, implies that should vanish as . Spontaneous breaking of this symmetry results if . In which case the explicit factor of in the numerator of Eq. 4 is compensated by the linear divergence of the integral as . The result is the Banks-Casher formula[1]:
| (5) |
Thus, we argue that the function is easy to compute, contains information about the spectrum of Dirac eigenvalues and is closely connected to spontaneous symmetry breaking. In fact, as we discuss below, the infrared behavior of also determines the character of anomalous chiral symmetry breaking, a quantity difficult to study directly with lattice fermions.
2 CHIRAL TRANSITION
2.1 Critical Behavior
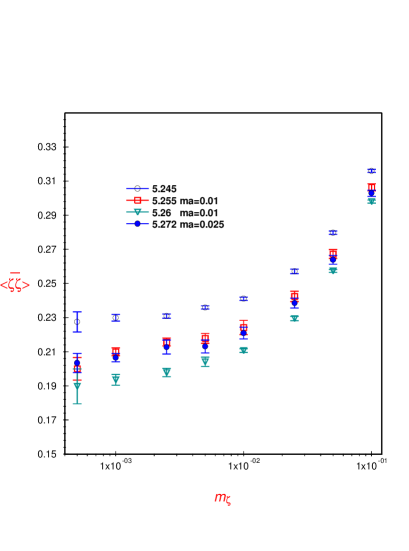
Figure 1 shows the quantity as a function of for a series of values of in the critical region. These results were obtained on a lattice with two degenerate flavors of dynamical fermions of mass . Note, this is a log-log plot showing six orders of magnitude variation in . As can be seen, the behavior is quite complex.
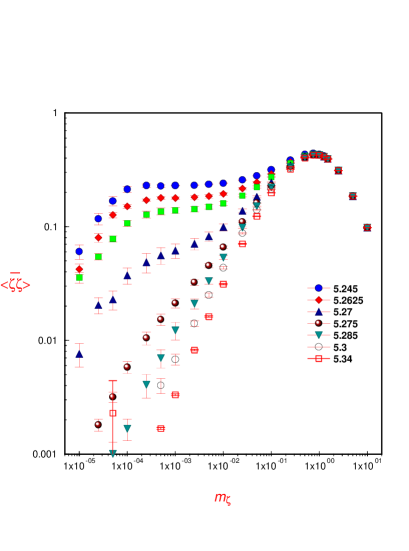
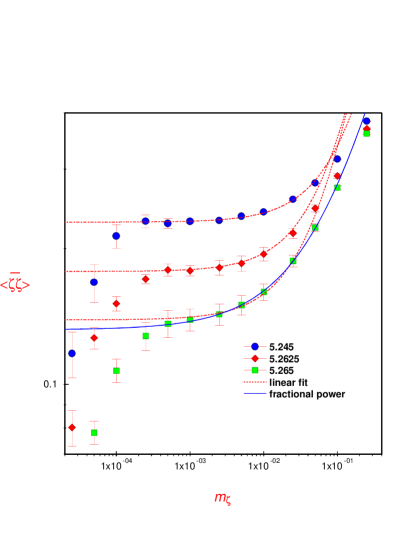
First consider in the low temperature, chirally asymmetric region, . For , shows a complex non-linear behavior much of which is certainly due to finite lattice spacing effects. (In the continuum limit a simple linear behavior is expected for large with a quadratically divergent coefficient.) For a constant plus linear fit works well, at least for those values of farthest from . For finite volume effects set in and approaches zero linearly as expected. It is interesting to note that a somewhat more elaborate fit, writing as the sum of a constant and fractional power, works well over a significantly larger mass range using a single value of . Such a fit merges nicely with a description which holds at , where only a fractional power, close to 0.6, is seen. Figure 2 shows our , 5.2625 and 5.265 data together with these constant plus linear and constant plus fractional power fits. For the smallest value, , the simple constant plus linear fit works nicely. However, for the more nearly critical , Figure 2 shows the constant plus fractional power working visibly better.
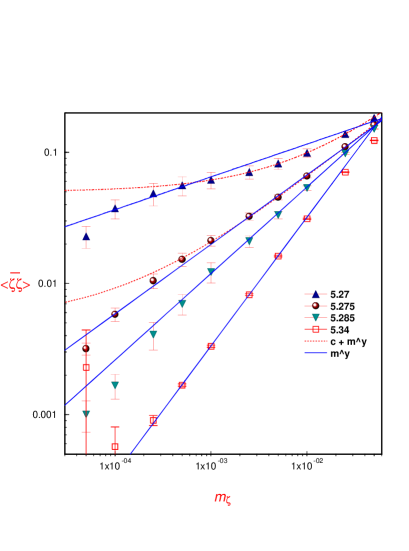
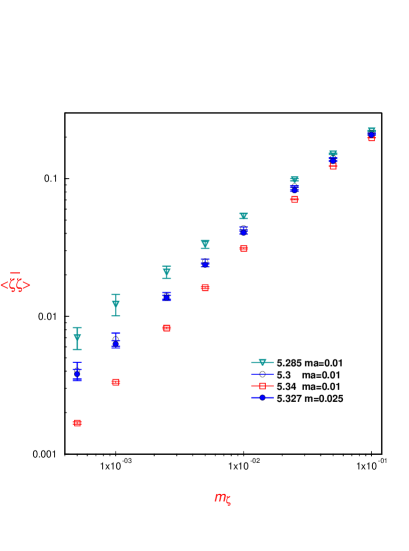
For , a fractional power, , begins to fit well with the power growing with increasing so that by the power is , very close to 1.0, the expected linear dependence on at high temperature. Figure 3 shows these fits for , 5.275, 5.285 and 5.34. For the smallest value, 5.27, a pure fractional power does not fit well—a constant term is also needed while for the larger values of a pure fractional power, with zero intercept, works quite well. At these larger values of the fits work at even lower masses suggesting that the region of small eigenvalues, , which may be distorted by finite volume effects, is less important.
If we attempt to study the critical behavior of as a function of the quark mass , there are many predictions of universality[3]. For example, at , one expects for . Of course, this singular behavior in the mass can arise from a combination of the dependence of on the quark mass as it enters both the propagator and fermion determinant. This dual role played by the quark mass can be seen explicitly by relating and :
| (6) |
Here the mass in the quark propagator explicitly entering the expectation value, , is often referred to as the valence mass, , while the mass in the fermion determinant, , used when computing is the sea quark mass, .
Thus, it is the dependence on that we are investigating when we examine as a function of . Only if the simulations do not depend in a critical way on the quark mass in the determinant, should we attempt to compare our exponent with .
2.2 The High Temperature Phase
The fact that appears to vanish with vanishing when is a bit surprising. The conventional picture assumes the presence of topological configurations that break the symmetry anomalously. This requires a significant density of small eigenvalues in the Dirac spectrum. For example, a dilute instanton gas, expected by some to describe the region above the critical point, would give a non-zero density of eigenvalues, . Recall, that it is only for the physical quantity that one expects the restoration of chiral symmetry. In the limit not only is the valence mass in the propagator, vanishing, but also the mass in the determinant, is going to zero. It is the added suppression of small eigenvalues, coming from the zero quark mass limit of the fermion determinant, that is presumably required for chiral symmetry restoration above .
Thus, a small sea quark mass should suppress the small eigenvalues associated with anomalous breaking of symmetry in the high temperature phase. Since in this calculation we do not set to zero, one might expect that anomalous breaking of symmetry will require , contrary to what we see. Of course, this non-zero value of will be suppressed by factors of . For that reason we will examine larger dynamical quark masses and even a quenched calculation below.
2.3 Anomalous Symmetry Breaking
Given the suppression of small eigenvalues that we see for it is natural to ask if we can see any evidence for anomalous symmetry breaking. This is an important question given the effects of such symmetry breaking on the order of the two-flavor phase transition.
Consider a continuum, two-flavor theory with flavor symmetry (in the limit of vanishing fermion masses) above the phase transition. The axial anomaly is expected to break the anomalous , forcing the two-point functions constructed from the operators and to be unequal. (Here is the continuum fermion field.) If these two-point functions are evaluated at zero momentum and subtracted, their anomalous symmetry breaking difference (here called ) can be written as follows:
| (7) |
We can compare this equation with our results for the behavior of as at fixed quark mass. In fact, the behavior of as for just above suggests that for which would suggest . However, the fermion determinant may well suppress the small eigenvalues, with vanishing as goes to zero.
We can relate directly to our quantity :
| (8) |
and attempt to study how it varies as . Figure 4 shows the quantity for a series of values of at and at for . Clearly is non-zero in this region and does not appear to decrease as decreases from 0.025 to 0.01 provided we adjust to remain a fixed displacement above . Thus, this calculation appears to show the presence of anomalous symmetry breaking for , in the high temperature phase, just above the transition.
3 EFFECTS OF QUARK LOOPS
In order to address the effects of the fermion determinant, let compare our and 0.025 results in greater detail. We find that even when comparing the quantity evaluated over the entire range of , the and simulations can be made to agree within a few percent if we allow for a quark-mass dependent shift in . In Figure 5 we show computed at , compared to a group of results. The quite precise 5-6% agreement with the , curve over the entire range is striking. Similarly, for higher temperatures, Figure 6 shows computed at , compared to results. Again, we see 5-6% agreement with the , curve over the entire range. Thus, in both the chirally symmetric and asymmetric phases, the change in dynamical quark mass from 0.01 to 0.025 can be quite accurately compensated by a simple shift in . No disparate effects on low or high eigenvalues are seen. The shift in of 0.027 needed in the high temperature phase is precisely the shift in that we identified earlier when comparing found in our 0.01 and 0.025 simulations.
It is interesting to note that the 0.017 shift in found in the low temperature regime is substantially smaller than the 0.027 shift needed at high temperature. Thus, it is clearly incorrect to describe the effects of quark loops as causing a simple shift in . At the least, that shift is itself -dependent.
4 QUENCHED CHIRAL TRANSITION
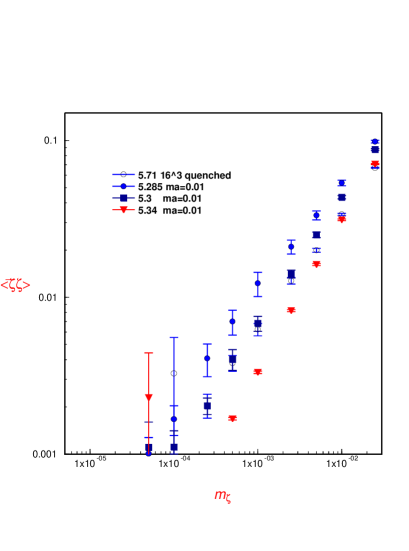
As has been discussed above, we have not seen the effects of small eigenvalues for in our , full QCD simulations to the extent expected, for example, from a model of dilute instantons. In an attempt to enhance such possible effects, we have repeated our calculation of for the pure gauge theory at and above the region of the deconfining phase transition. The results are summarized in Figure 7 where we plot the “quenched” chiral condensate, as a function of for a fixed mass value, .
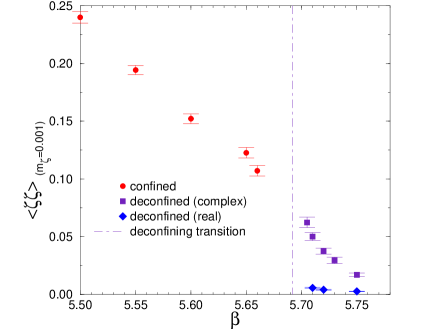
The results are quite surprising. Because of the lack of symmetry for the Dirac operator, shows dramatically different behavior in the three phases for . The two phases where the Wilson line has a complex expectation value (here called complex phases) show the same behavior for because they are related by complex conjugation. This complex phase shows spontaneous breaking of chiral symmetry, with values of that appear nearly continuous across the deconfinement phase transition. In contrast, the real phase has a vanishing value of in the limit and looks very much like the chirally symmetric phase seen in our full QCD simulations.
4.1 Real phase
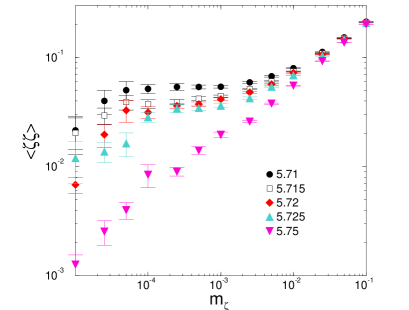
In Figure 8 we show in the real phase as a function of quark mass, . One sees a fractional power dependence , very much like the behavior seen for in the full QCD simulations. As can be seen by comparing the results from the and volumes, this behavior appears to characterize the infinite volume limit.
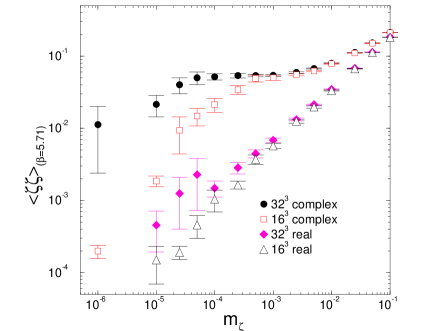
Figure 9 compares the dependence of in this real phase with that of our full , ma=0.01 simulations. The results are somewhat similar, showing perhaps a 15% variation. However, in contrast to the 0.01-0.025 comparison discussed earlier, there is a clear systematic difference between the quenched and full QCD results. As might be expected, the quenched results show an enhancement for small eigenvalues not seen in the , two-flavor calculation. Never-the-less, we can describe the major effect of the fermion determinant on QCD thermodynamics as selecting the real phase (the phase with fewer small eigenvalues) as the physical phase.
4.2 Complex phase
We see chiral symmetry breaking in the complex, deconfined phase as might be expected from a dilute instanton gas model. In Figure 8 we explicitly compare the dependence of on quark mass for and volumes. As can be seen, the presumed finite-volume “knee”, where abruptly begins to decrease with decreasing quark mass dramatically shifts to smaller quark mass on the larger volume. The shift by roughly the factor of 8 by which the volume has increased is exactly what is expected for such spontaneous symmetry breaking.
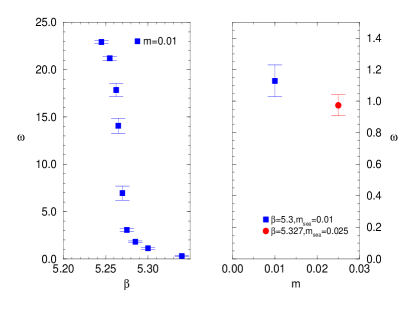
The variation of with is quite similar to that seen for in our two-flavor simulations. For smaller a constant plus linear fit to as a function of works quite well but as increases and the constant intercept decreases, a constant plus fraction power fit works significantly better. This effect is best seen on volumes and in Figure 10 we show versus for a series of values. This similarity with our , simulations suggests the possibility of a second, chiral symmetry restoring transition in for this complex, deconfined phase. In Figure 11 we plot the values from the constant plus fractional power fits, versus . Clearly we cannot rule out such a second phase transition although a continuous, rapid decrease in as increases above the first-order critical point appears the most natural interpretation of the data.

4.3 Inconsistent Phase Transition
Combining our results with this calculation suggests that the one-flavor phase transition may be quite different from that expected on theoretical grounds, at least for correspondingly coarse lattice spacings. Since the density of small eigenvalues found in the “real” deconfined phase for pure QCD is insufficient to support a non-zero value of , the high temperature phase, with increased suppression of small eigenvalues coming from the fermion determinant, should also show exact chiral symmetry with in the limit . Thus, for , is non-zero for strong coupling but may well vanish for weak coupling which would require that will show a phase transition. This is in conflict with the usual analysis which concludes that there is no transition because of the anomalous breaking of the theory’s chiral symmetry.
The failure to see the behavior expected for would be a serious cause of concern either about our understanding of continuum thermodynamics or about the coarse lattice spacings used in present-day lattice calculations.
5 CONCLUSION
It should be noted that we have adopted a new approach to the study of the axial anomaly using staggered fermions. Direct investigation of the axial anomaly is normally impeded by the absence of a conserved, flavor-singlet axial current defined on the lattice. For example, a quantity like the mass will receive contributions from both chirally-asymmetric lattice artifacts as well as the small Dirac eigenvalues of physical interest. By using operators with a different number of flavors than appear in the Dirac determinant (operators which obey an exact chiral symmetry on the lattice), we can study directly the effects of the relevant Dirac spectrum—a quantity determined solely by the number of flavors in the fermion determinant. The zero-momentum two-point function of Eq. 7 examined for and the four-flavor chiral condensate discussed for are examples of this strategy.
References
- [1] T. Banks and A. Casher, Nucl. Phys. B169 (1980) 103.
- [2] R. D. Pisarski and F. Wilczek, Phys. Rev. D29 (1984) 338.
- [3] For a recent review of this topic see C. Detar, Nucl. Phys. B (proc. suppl.) 42 (1995) 73.