UTHEP-313
August 1995
Finite-Temperature Phase Structure of Lattice QCD
with Wilson Quark Action
Abstract
The long-standing issue of the nature of the critical line of lattice QCD with the Wilson quark action at finite-temperatures, defined to be the line of vanishing pion screening mass, and its relation to the line of finite-temperature chiral transition is examined. Analytical and numerical evidence are presented that the critical line forms a cusp at a finite gauge coupling, and that the line of chiral transition runs past the tip of the cusp without touching the critical line. Implications on the continuum limit and the flavor dependence of chiral transition are discussed.
Elucidating the nature of chiral transition separating the high-temperature quark-gluon plasma phase from the low-temperature hadron phase has been one of the focal points of effort in recent numerical simulations of full lattice QCD including light dynamical quarks. Much of work in this direction has employed the Kogut-Susskind quark action since it retains a subgroup of chiral symmetry. On the other hand, studies with the Wilson quark action are less well developed in spite of the effort over the years[1, 2, 3]. In fact, two issues, which are fundamental for understanding the chiral transition with this action, have not been fully clarified to date. Both of the issues originate from the difficulty of identifying the chiral limit of massless quark due to the presence of explicit chiral symmetry breaking in the action, which is introduced to avoid the well-known species doubling problem.
For the case of zero temperature pion mass has been conventionally employed to deal with this problem. Let be the inverse gauge coupling and the hopping parameter which controls quark mass. There is much evidence from analytical considerations and numerical simulations of hadron masses that the pion mass vanishes along a line , the critical line, which runs from in the strong-coupling limit to in the weak-coupling limit. At finite temperatures, one is then naturally led to define the critical line in terms of the pion screening mass extracted from the exponential decay of pion propagator for a large spatial separation. The first issue in understanding the chiral transition is how the critical line thus defined behaves as a function of and the temporal lattice size , and how it is related to the critical line at zero temperature.
The second issue concerns the relation of the critical line and the line of finite-temperature chiral transition , the thermal line. Naively one would expect the thermal line to meet the critical line at some value . In this case, the region bounded by the thermal line and the critical line for represents the low-temperature phase and the other region the high-temperature phase. However, initial simulations[1] failed to find clear indications of such a behavior; the two lines appeared to run almost parallel toward the region of strong coupling, down to for the case of flavors. These results raised the question if the two lines meet at all, which has led to subsequent studies[2, 3]. In particular the QCDPAX Collaboration carried out simulations down to the strong coupling limit and concluded that the two lines meet at [2]. However, their result has not satisfactorily answered the question in our view since the nature of the critical line at finite temperatures we have addressed above has not been clarified in their work.
In this article we report results of our study on the two fundamental issues summarized above. Our analyses are based on the idea of spontaneously breakdown of parity and flavor as a characterization of the critical line, which has been put forward by one of us[4]. The phase structure we found exhibits some unexpected features which we substantiate with analytical arguments and hybrid Monte Carlo simulations of flavor full QCD with the Wilson quark action on an lattice. We shall also discuss implications of our results on the continuum limit of the chiral transition and extensions for the case of .
The starting point of our analysis is the Gross-Neveu model in two dimensions formulated with the Wilson quark action[5]. Except for confinement, this model has the features quite similar to those of QCD: asymptotic freedom, spontaneous breakdown of chiral symmetry and its restoration at a finite temperature. In the large limit, the pion mass in this model is analytically calculable in the saddle-point approximation. In Fig. 1 we plot the critical line corresponding to on the plane for the temporal lattice sizes and where and are the bare coupling and quark mass, the latter related to the hopping parameter through . The result for , which has been known for some time[4], shows that the critical line forms three cusps which touch the weak-coupling limit at and . The region outside of the critical line is a normal phase with , while the inside is the phase with spontaneous breakdown of parity characterized by . Conventionally one constructs the continuum limit of the model close to the point along the branch of the critical line extending over . The existence of additional branches converging toward and arises from a rearrangement of the doubler and massless fermion spectrum as is varied.
For understanding the phase structure at finite temperatures, the crucial feature revealed in Fig. 1 is that the three cusps of the critical line retract from the weak-coupling limit for finite temporal lattice sizes, forming a single continuous line which shifts toward strong coupling as becomes smaller. Thus, for a finite , the critical line is absent for sufficiently weak coupling. Also noteworthy is the fact that, even in the range of where the critical line exists, the position of the critical line depends on , albeit only slightly for large values of .
The close resemblance of the Gross-Neveu model and QCD suggests that a similar behavior of critical line holds for QCD except that the number of cusps should increase to five because of the difference in the number of dimensions. For the zero temperature case, the available evidence supporting this possibility is as follows: (i) In the strong-coupling limit, analytical results in the large limit for chiral observables such as and associated susceptibilities show spontaneous breakdown of parity and flavor for [4]. Results of a numerical simulation for the full QCD system show good agreement with the analytic predictions[6]. (ii) A quenched calculation of the number of conjugate gradient iterations needed for inverting the Wilson quark matrix over the range revealed the presence of three peaks in the region for [6]. (iii) A measurement of hadron masses at in quenched QCD on a lattice found clear evidence for three more values of beyond the conventional one at which pion mass vanishes[6]. The parity broken phase situated between two successive critical values is narrow, being of order .
For the finite temperature case, an apparent disappearance of the critical line toward weak coupling has been noticed in previous studies. In the results of the MILC Collaboration[3] on an lattice in the range , the pion screening mass initially decreases toward larger values of , but it increases beyond the thermal line . A similar behavior is seen in the data of the QCDPAX Collaboration at [2]. On the other hand, the conventional critical line has been shown to remain at and [2]. Therefore, confirming a structure similar to that of Fig. 1 for QCD requires evidence that the conventional critical line turns back toward strong coupling at some value of .
In order to examine this point, we have carried out hybrid Monte Carlo simulations of full QCD with the Wilson quark action on an lattice. Runs were made in the range and , which covers the region beyond the conventional critical line, typically in steps of and . The conjugate gradient method was employed for inverting the Wilson quark matrix with the stopping condition of with or with the lattice volume. In order to maintain the acceptance at the level of % or more, the hybrid Monte Carlo step size was decreased from to as is decreased or is moved closer to the critical line. Choosing the interval of or to be the unit trajectory, at least trajectories were generated after thermalization with local observables measured for each trajectory. At and hadron propagators were evaluated at every two trajectories by periodically doubling the lattice in spatial directions .
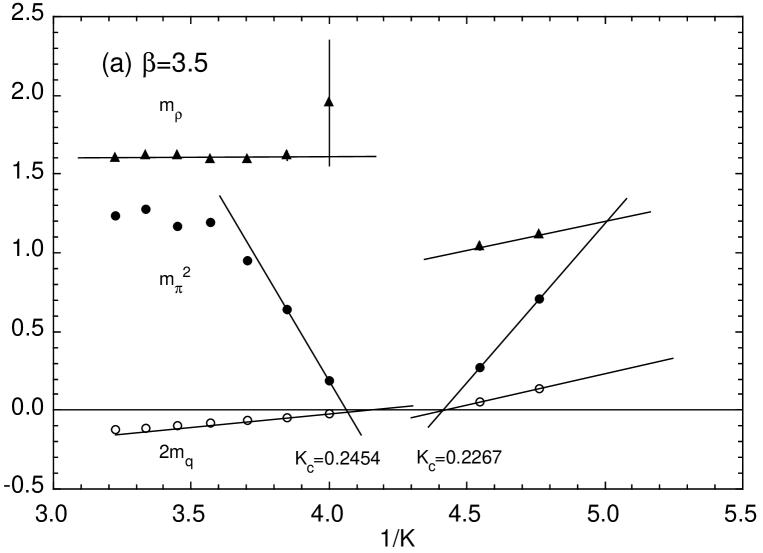
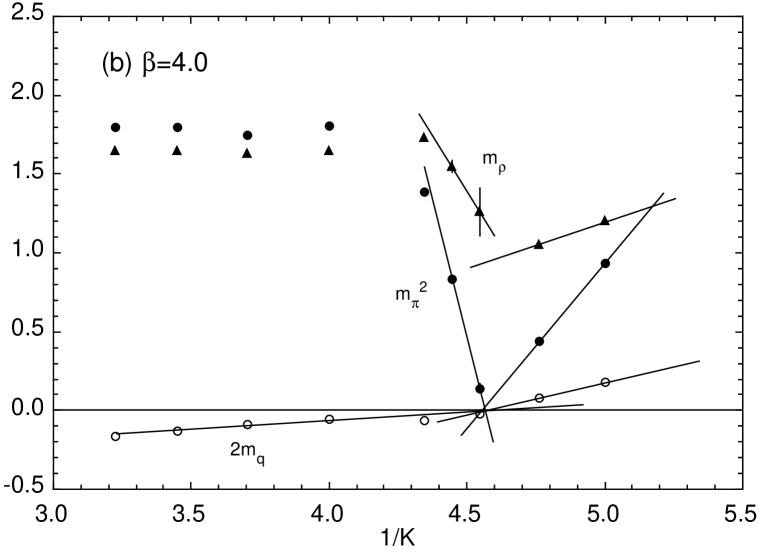
In Fig. 2(a) we present our result for and screening masses at as a function of . Also plotted is the quark mass defined via the axial vector Ward identity[7]. To the right of the figure is the low-temperature phase bounded by the conventional critical line at where the pion mass squared and the quark mass linearly vanish almost simultaneously. Clearly there exists another critical line at below which the pion and quark masses behave in a reverse manner. Fig. 2(b) shows how the behavior changes at . We observe that the gap between the two critical values has either become extremely narrow or disappeared. These results lead us to believe that we have identified one of the cusps of the critical line, with the turning point located in the vicinity of .
Let us now discuss the question whether the thermal line crosses the critical line . In the light of our results above, it should be clear that this can not happen with our definition of ; the part of the critical line beyond the crossing point, assuming it exists, should be in the high temperature phase, where we expect the pion screening mass to be finite, while it vanishes along the entire critical line by definition. In other words the region close to the critical line has to be in the low-temperature phase even after it turns back toward strong coupling. This means that the thermal line should run past the turning point of the critical line and continue toward larger values of .
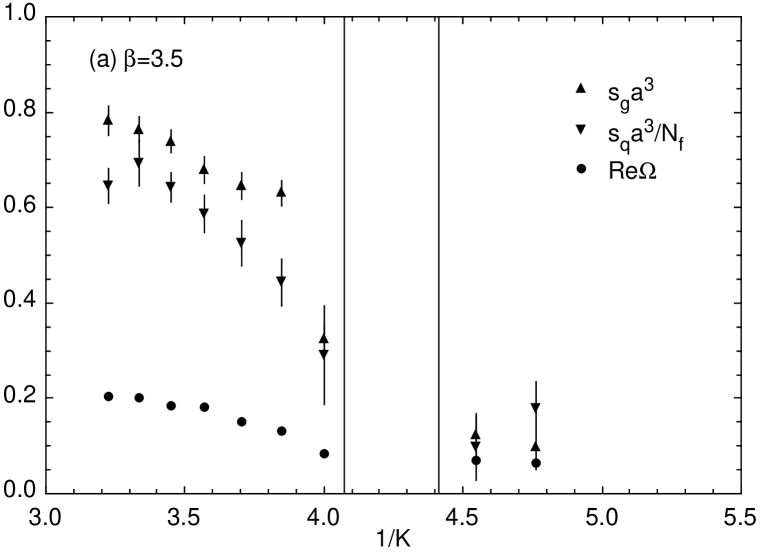
The validity of this consideration is confirmed through an examination of thermodynamic observables. In Fig. 3(a) we plot the real part of the Polyakov line and quark and gluon entropy densities in lattice units as a function of at . The two vertical lines show the position of the critical line estimated from the pion screening mass. For small values of the observables take large values typical of the high temperature phase. However, toward the critical line at , they decrease, becoming roughly similar in magnitude to those on the other side of the conventional critical line at , which is in the low-temperature phase.
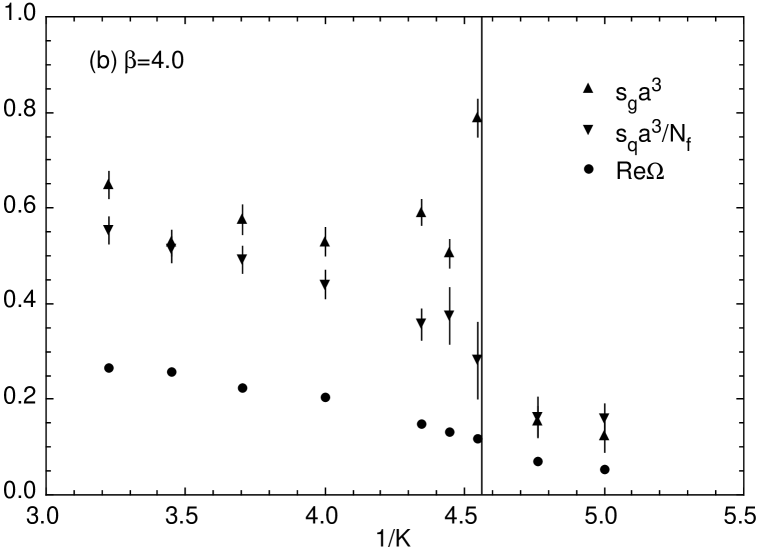
Results for are shown in Fig. 3(b). The vertical line marks the point where the two linear extrapolation of the pion screening mass squared in Fig. 2(b) cross each other. The increase of the three quantities across the line shows that the thermal line comes close to the critical line at .
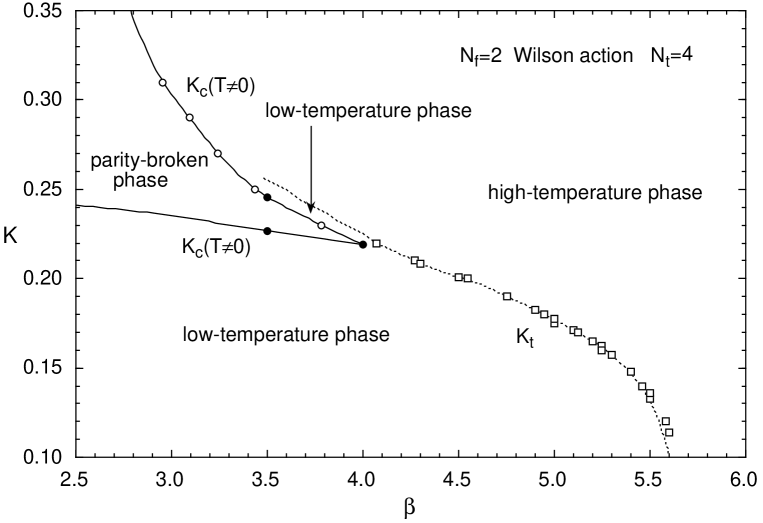
In Fig. 4 we summarize our findings for the phase structure of lattice QCD with two flavors of dynamical Wilson quarks on an lattice. Solid circles represent values of extracted from pion screening mass. We have tentatively assumed that the critical line turns back at . Open circles are estimates obtained by extrapolating the inverse of the number of conjugate gradient iterations in hybrid Monte Carlo runs to zero. The solid line, smoothly interpolating circles, represents one of the cusps of the finite-temperature critical line. (We expect the tip of the cusp to be actually rounded. See Fig. 1.) The thermal line is indicated by the dotted line, which is an interpolation of estimates from previous work (open squares)[1, 2, 3], continued toward larger values of following our results. As we have argued the low-temperature phase goes around the tip of the cusp and extends into the region close to the upper part of the critical line.
We emphasize that the zero-temperature critical line is absent from the point of view of finite-temperature partition function. For this reason we have not drawn the line in Fig. 4. We note, however, that available results indicate that this line practically forms a smooth continuation of the lower part of the finite-temperature critical line toward weak coupling.
Let us comment here on the report of the QCDPAX Collaboration that the thermal line crosses the critical line at [2]. In our terminology their result is based on simulations carried out along the zero-temperature critical line from weak toward strong coupling. In view of the smooth connection of the zero- and finite-temperature critical lines noted above, the thermal line has to cross the zero-temperature critical line, which is the phenomenon suggested by the QCDPAX Collaboration. In this sense their result is consistent with our phase diagram. However, we emphasize that this crossing point does not correspond to a singularity of the partition function for a finite temporal lattice size.
So far we have examined the case of . For larger values of , we expect the thermal line and the cusp of the critical line to move toward larger with the latter closely following the zero-temperature critical line. The distance between the thermal line and the tip of the cusp will diminish probably as . An important point to note is that the presence of explicit chiral symmetry breaking and simulation results including ours strongly indicate that the thermal line for the case is a continuous crossover and not a true phase transition[8]. Thus, a second-order chiral phase transition, as suggested by continuum sigma model analyses for this case[9], would emerge only in the continuum limit .
Another interesting question is how our results are modified for the case of . Previous simulations support a first-order chiral phase transition[2] in agreement with sigma model analyses. This implies that the thermal line turns into a line of first-order phase transition near the tip of the cusp. The line will not cross the critical line for a finite temporal lattice size since our reasoning for the case also applies for .
Let us finally add that we expect the qualitative features of the phase structure we found to hold for a wider class of Wilson-type actions including the clover action[10].
Acknowledgements
We thank Y. Iwasaki, K. Kanaya and T. Yoshié for showing us their unpublished data and for useful discussions. Numerical calculations for the present work have been carried out at Center for Computational Physics and on VPP500/30 at Science Information Processing Center, both at University of Tsukuba. This work is supported in part by the Grants-in-Aid of the Ministry of Education(Nos. 04NP0701, 06640372).
References
- [1] M. Fukugita, S. Ohta and A. Ukawa, Phys. Rev. Lett. 57 (1986) 1974; A. Ukawa, Nucl. Phys. B(Proc. Suppl.)17 (1990) 463. See also, R. Gupta et al., Phys. Rev. D40 (1989) 2072; K. M. Bitar et al., Phys. Rev. D43 (1991) 2396.
- [2] Y. Iwasaki et al., Phys. Rev. Lett. 67 (1991) 1491, 69 (1992) 21; Nucl. Phys. B(Proc. Suppl.)30 (1993) 327, 34 (1994) 314; preprint UTHEP-300, 304 (1995).
- [3] C. Bernard et al., Phys. Rev. D46 (1992) 4741, 49 (1994) 3574, 50 (1994) 3377.
- [4] S. Aoki, Phys. Rev. D30 (1984) 2653; Phys. Rev. Lett. 57 (1986) 3136; Nucl. Phys. B314 (1989) 79.
- [5] T. Eguchi and R. Nakayama, Phys. Lett. 126B (1983) 89.
- [6] S. Aoki, A. Ukawa and T. Umemura, in preparation.
- [7] M. Bochicchio et al., Nucl. Phys. B262(1985) 331; S. Itoh et al., Nucl. Phys. B274(1986) 33.
- [8] We consider that the first-order signal reported by the MILC Collaboration[3] on an lattice around is likely to be a lattice artifact.
- [9] R. D. Pisarski and F. Wilczek, Phys. Rev. D29 (1984) 338; F. Wilczek, Int. J. Mod. Phys. A7 (1992) 3911.
- [10] B. Sheikholeslami and R. Wohlert, Nucl. Phys. B259 (1985) 572.