October 1993 HLRZ 63/93
INTERFACE TENSIONS
AND PERFECT WETTING
IN THE TWO-DIMENSIONAL
SEVEN-STATE POTTS MODEL
B. Grossmann1 and Sourendu Gupta1,2
HLRZ, c/o Research Center Juelich, D-52425 Juelich, Germany
TIFR, Homi Bhabha Road, Bombay 400005, India.
Abstract
We present a numerical determination of the order-disorder interface tension, , for the two-dimensional seven-state Potts model. We find , in good agreement with expectations based on the conjecture of perfect wetting. We take into account systematic effects on the technique of our choice: the histogram method. Our measurements are performed on rectangular lattices, so that the histograms contain identifiable plateaus. The lattice sizes are chosen to be large compared to the physical correlation length. Capillary wave corrections are applied to our measurements on finite systems.
Phase transitions of interest to cosmology and colliders may well turn out to be of first order. For this reason there has been increased interest in first-order transitions. Among the parameters governing the dynamics of such transitions are the interface tensions. These are properties of the equilibrium system. There have been attempts to measure these on the gauge theories of relevance to high-energy physics. Recently, however, the control of systematic biases in these measurements have been questioned. Such uncertainties call for detailed tests of the methodology in models which are more tractable than gauge theories.
The two-dimensional Potts models are used very often for such purposes. They are also interesting because of connections with exactly solved two-dimensional models in statistical mechanics. They are defined by the partition function
| (1) |
The spins at each site of a lattice can take different values, and the notation denotes nearest neighbour pairs. There is an order-disorder phase transition in the models for all , with a singlet magnetisation as an order-parameter. This transition occurs at a coupling . For the transition is of first-order.
The coexisting phases can be characterised by the internal energy densities
| (2) |
where the angular brackets denote thermal expectation values and is the volume of the lattice. In the ordered and disordered phases at , the values of the internal energy densities will be denoted by and respectively. For the Potts models these values are known exactly [1]. Recall that as we obtain a pure ordered phase with . As the system is heated, its internal energy increases at constant . This is achieved by creating larger and larger volume fractions of the disordered phase. Coexistence of the two phases implies the creation of interfaces. Finally, when , a purely disordered phase is obtained and with additional heating increases with a decrease of . In the coexistence region, at , there is a non-extensive part of the free energy. This part can be used to define the interface tension.
A recent exact computation of the correlation length at in all Potts models with [2] has been identified with the correlation length in the disordered phase, , on the basis of a large- expansion [3]. A duality argument [4] then gives the interface tension between two different ordered phases, , as
| (3) |
Now making the assumption of perfect wetting,
| (4) |
one obtains the prediction
| (5) |
Since is exactly known, a measurement of would check the relation in eq. (5) and thus test the conjecture of perfect wetting in eq. (4). This assumption is for large by the proof of the opposite inequalities and [5]. A recent measurement at [6] has used the argument outlined here to verify that perfect wetting holds for that model.
The status of the model with is interesting. With the assumption of perfect wetting, the exactly known value of would predict . A first measurement using the so-called integral method gave [7]. A value in agreement, was obtained [8] by a different technique. The surprisingly large violation of perfect wetting led to criticism of these two techniques for the measurement of interface tensions. Two measurements using the histogram technique were then performed. The first gave [9] and the second [10]. Although they are in agreement with each other, they are in violation of perfect wetting by about seven standard deviations. The lattice sizes used in both these studies were not much larger than , and hence the results may require correction. This was also noticed in [11]. In this letter we report a study of the model by the histogram technique correcting for all sources of systematic errors.
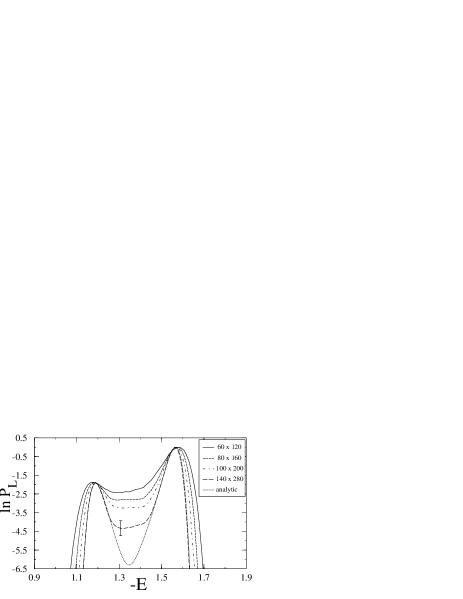
Consider a finite lattice of size (), with periodic boundary conditions imposed on the configuations. The histogram of the probability distribution of , , was first used for the extraction of an interface tension in [12]. has peaks at and , shifted through finite size effects. In an interval of bounded by these two values, there is a minimum, , and a nearly flat region around it. This region is due to two interfaces spanning the smaller direction, , and seperating an ordered from a disordered phase. The histogram method consists of a model for and the nearly flat plateau contained in the interval . Such a model contains as a parameter the interface tension of interest, which is then extracted by comparison with data.
In the region of interest, is independent of as long as the free energy is independent of the relative positions of the two interfaces. Fluctuations of the interface shapes are described by the capillary wave model [13]. For non-interacting interfaces, one obtains [14]
| (6) |
This contribution takes into account interfaces perpendicular to the -direction. For , interfaces parallel to the -direction give small corrections to this result. For the lattices we have chosen to work with, these corrections are negligible. In [15] it was shown that the formula in eq. (6) holds for two-dimensional systems even when the global condition that lies between the two pure-phase energies is imposed.
Whenever all the above conditions are fulfilled, one can extract the interface tension from either of the two quantities defined below. The pre-exponential factors in eq. (6) cancel in
| (7) |
where is the geometric mean of the maxima of corresponding to the ordered and disordered phases. Taking into account capillary wave fluctuations of the interfaces, we obtain the finite size scaling formula
| (8) |
As a cross-check one can also measure a second quantity from the histograms,
| (9) |
Capillary wave fluctuations of the two interfaces also yield the finite size scaling formula for this quantity—
| (10) |
We shall use both the quantities, and , along with their finite size scaling formulæ to estimate the interface tension.
Care is required to ensure that the relations above may be applied to the data obtained. A sufficient check is to confirm that indeed has a flat plateau at its minimum. In [16] it was found that the condition was necessary to obtain non-interacting interfaces. Previous studies of this model had used only square lattices. In this study we consistently use the value . It has turned out that the lattices need not be elongated further for a flat plateau in the histogram to develop. A second necessary condition is that the system break up into several domains. This requires . All our lattices satisfy this condition, whereas earlier studies were performed on much smaller lattices. Finally, we note that the capillary wave model of interface fluctuations has been applied successfully in other contexts, and is bound to be an improvement over the neglect of interface fluctuations.
The simulations were performed with lattices. Since the longest physical correlation length at is , the minimum value of used was 60. For we used a cluster update. For larger values of the performance of this algorithm was not satisfactory. Hence we used a multicanonical version of a two hit Metropolis algorithm in the form specified in [17]. The energy was measured every tenth sweep. Between 1000 and 5000 initial configurations were discarded for thermalisation. The couplings were chosen so that the canonical weights were roughly equal for the two phases. The second run on the lattice was an exception, since this was performed at . The data was reweighted to the canonical distribution at for each lattice. A cross-check on the statistics of our runs was that the weights of the two peaks at are in the ratio 1:7. For the lattice, the results presented later average over the two runs.
We show the histograms obtained in our computations in Figure 1. We would like to emphasise that flat plateaus are obtained over an interval between the two peaks for . In a criticism of the histogram method as applied to the ten-state Potts model on square lattices [11], it was argued that could be reproduced by an analytic computation which neglects all interfaces which span the lattice. This is not true for the lattice sizes and shapes we choose to work with. In Figure 1 we show our histograms and a comparison with a computation following the methods of [11]. The analytic computation strongly underestimates the probability in the intermediate region of . We also find that the discrepancy increases with increasing . This is evidence that interface contributions are important in this region of .
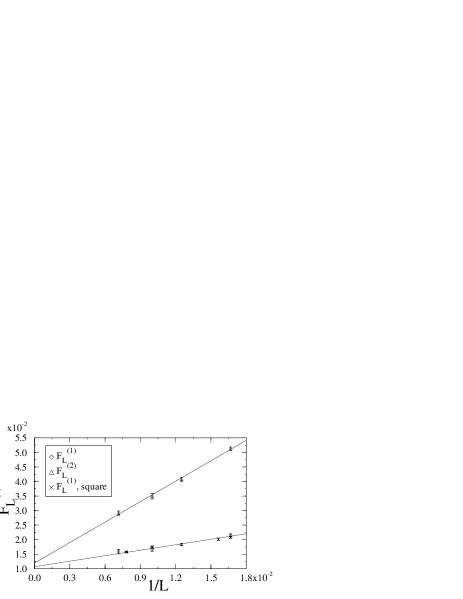
We extract and from the histograms. A jack-knife procedure is used for the estimates of the averages and errors. The results quoted were obtained using between 6 and 24 jack-knife blocks. We checked that the results were stable under change in the number of blocks. A finite size scaling analysis of each of these measurements is performed by fits to the data. Such an analysis gives
| (11) |
An overall estimate, obtained by averaging these two values, is
| (12) |
The data and fits leading to this result are displayed in Figure 2.
It is possible to perform an interesting exercise with the data on obtained in [9, 10]. Recall that this data was obtained through simulations in square lattices where the existence of the plateau due to interfaces was not clear. Nevertheless, a rough correction may be performed if one argues that the interfaces could be either parallel or perpendicular to the -direction, and hence the net result would be to multiply in eq. (6) by a factor of two. Applying this correction, one obtains from the square lattice results a value for surprisingly close to our result quoted in eq. (12). Note, however, that in the absence of a clear plateau around this result is accidental.
In summary, we have performed a measurement of the order-disorder interface tension, , in the two-dimensional seven-state Potts model and found a value in close agreement with the result expected on the basis of perfect wetting. The measurement technique used was the so-called histogram method. We have demonstrated that using rectangular lattices of shape where , one may overcome previous objections to this method and clearly obtain a plateau at the minimum of the histogram. This, and the use of capillary wave corrections to the interface shape are sufficient condition for a reliable application of this technique to the measurement of interface tensions.
We thank André Morel for computing the probability distributions for the seven-state Potts model for the lattice sizes used here, following the methods of [11]. We would also like to thank Alain Billoire, Robert Lacaze, and André Morel for interesting discussions. One of us (SG) would like to acknowledge the hospitality at TFT, Helsinki while this paper was being written. The computations were performed on the Cray Y/MP at HLRZ, Jülich.
References
- [1] R. J. Baxter, Exactly Solved Models in Statistical Mechanics, Academic Press, London, 1982.
- [2] E. Buffenoir and S. Wallon, J. Phys. A 26 (1993) 3045.
- [3] C. Borgs and W. Janke, J. Phys. (France) I 2 (1992) 2011.
- [4] L. Laanait, Phys. Lett. A 124 (1987) 480.
-
[5]
J. de Coninck et al., J. Stat. Phys. 52 (1988) 45;
R. Schonmann, J. Stat. Phys. 52 (1988) 61;
A. Messager et al., Comm. Math. Phys. 140 (1991) 275. - [6] Sourendu Gupta, HLRZ preprints HLRZ-22/93 and HLRZ-65/93.
- [7] J. Potvin and C. Rebbi, Phys. Rev. Lett. 62 (1989) 3062.
- [8] K. Kajantie, L. Kärkkäinen, and K. Rummukainen, Phys. Lett. B 223 (1989) 213.
- [9] W. Janke, Int. J. Mod. Phys. C 3 (1992) 1137.
- [10] K. Rummukainen, Nucl. Phys. B (Proc. Suppl.) 30 (1993) 273.
- [11] T. Bhattacharya, R. Lacaze, and A. Morel, Saclay preprint SPhT-93-022, 1993.
- [12] K. Binder, Z. Phys. B 43 (1981) 119.
- [13] V. Privman, Int. J. Mod. Phys. C 3 (1992) 857.
- [14] B. Bunk, Int. J. Mod. Phys. C 3 (1992) 889.
- [15] U. J. Wiese, preprint BUTP-92/37, 1992, to appear in J. Stat. Phys..
- [16] B. Grossmann and M. L. Laursen, HLRZ preprint, HLRZ-93-7, (to appear in Nucl. Phys. B).
- [17] B. Grossmann, M. L. Laursen, T. Trappenberg, and U.-J. Wiese, Phys. Lett. B 293 (1992) 175.