Edinburgh Preprint: 93/524
Southampton Preprint SHEP 92/93-16
May 27, 1993
The Light Hadron Spectrum and Decay Constants in Quenched
Lattice QCD
UKQCD Collaboration
C.R. Allton 111Present address: Dipartimento di
Fisica, Università di Roma La Sapienza, 00185 Roma,
Italy., L. Lellouch, C.T. Sachrajda, H. Wittig
Physics Department, The University, Southampton SO9 5NH, UK
R.M. Baxter, S.P. Booth, K.C. Bowler, D.S. Henty, R.D. Kenway,
C. McNeile222Present address: Dept. of
Physics & Astronomy, University of Kentucky, Lexington KY 40506,
USA, B.J. Pendleton, D.G. Richards, J.N. Simone, A.D. Simpson
Department of Physics, The University of Edinburgh, Edinburgh EH9 3JZ,
Scotland
We present results for light hadrons composed of both degenerate and non-degenerate quarks in quenched lattice QCD. We calculate masses and decay constants using 60 gauge configurations with an –improved fermion action at . Using the mass to set the scale, we find hadron masses within two to three standard deviations of the experimental values (given in parentheses): MeV (892 MeV), MeV (1020 MeV), MeV (938 MeV), MeV (1232 MeV) and MeV (1672 MeV). Direct comparison with experiment for decay constants is obscured by uncertainty in current renormalisations. However, for ratios of decay constants we obtain (1.22) and (1.22).
1 Introduction
Within the quenched approximation, it is currently possible to study lattice QCD numerically in a box of linear size around 2 fm, with a lattice spacing of less than 0.1 fm, corresponding to a cutoff above 2 GeV. Although extrapolation to the chiral limit is still a necessary ingredient when and quarks are involved, such lattices allow the direct simulation of hadrons containing quarks, at the cost of fixing one additional mass parameter. A significantly wider range of physical quantities thereby becomes calculable, with which to probe the reliability of lattice QCD.
In this paper, we extend an earlier study [1, 2] of light hadron masses and decay constants to include the effects of -flavour-symmetry breaking. The earlier study was based on 18 configurations, and the correlation functions were evaluated for hadrons composed of degenerate quarks, for five different values of the quark mass, using both the Wilson and the clover fermion actions. The results presented in this paper were obtained from our complete data set of 60 configurations, using the clover fermion action, for three of the five previously-used quark masses. In order to study flavour-symmetry-breaking effects, we construct mesons using all possible quark-mass combinations.
In the Wilson formulation, the bare quark mass, , is given in terms of the hopping parameter by
| (1) |
is the value of the hopping parameter at zero quark mass, which is taken to be the point at which the mass of the pseudoscalar meson, , vanishes and the quark and antiquark are degenerate. With each quark flavour, we need to associate a value of corresponding to its experimentally observed mass. It is a good approximation to take the physical light quark ( and ) masses to be zero, i.e. to set . Here we are interested in computing the effect of -flavour-symmetry breaking on the spectrum and decay constants, and so we need to associate a non-zero mass with the strange quark. The corresponding can be determined, for example, by first extrapolating the vector meson mass, , to and then fitting the data for the ratio to some function of the two quark masses, extrapolating in to and using to fix the ratio to the experimental value of . Alternatively, may be determined from the degenerate-quark data alone, avoiding the second chiral extrapolation, by using the ratio .
This procedure requires some assumption about how the hadron masses depend on the quark masses. In most previous calculations (see, for example, [2, 3, 4, 5, 6]), it has been assumed that the pseudoscalar meson mass obeys the PCAC relation
| (2) |
and that the vector meson mass obeys
| (3) |
The original work of Martinelli et al. [7] supported this assumption, albeit on the basis of rather limited statistics, by combining quark propagators computed for different values of . More recent studies of strange hadrons [8, 9] have similarly utilised non-degenerate quarks, and this is the procedure that we adopt here.
We fit our data for , , , etc., to the following function of the two quark masses, and ,
| (4) |
to test the assumption that in Equations (2) and (3). The expression (4), or its equivalent with , defines a plane through the data, as shown in Figure 1. By means of a combination of extrapolation and interpolation using such fits, we are able to calculate the masses and decay constants of the , and mesons and the mass of the baryon, in addition to those of the usual light hadrons.

In Section 2, we summarise our statistics and present details of our fitting criteria and procedures. Our main results are given in Section 3, where we describe the chiral extrapolations, the interpolation to the strange quark mass, and the masses and decay constants in physical units. Section 4 contains our conclusions.
2 Computational Details
2.1 Statistics
We have analysed 60 gauge field configurations at an inverse coupling on a lattice of size . The gauge configurations and quark propagators were produced on the 64-node i860 Meiko Computing Surface at the University of Edinburgh. The gauge fields were generated using the Hybrid Over-Relaxed algorithm, defined in reference [2]. The gauge configurations are separated by 2400 sweeps, beginning at configuration 16800. The quark propagators were calculated using an -improved clover action [10, 11]
| (5) |
is the standard Wilson lattice action,
| (6) |
and is a lattice definition of the field strength tensor. We have computed propagators at three values of , 0.14144, 0.14226 and 0.14262, using an over-relaxed minimal residual algorithm with red-black preconditioning and point sources and sinks. Although there are advantages to using smeared sources and/or sinks to extract ground-state properties from 2-point functions [12], constraints imposed by other parts of the UKQCD programme did not allow us this option.
We construct correlators for mesons composed of quarks of flavours 1 and 2 using the following local interpolating fields:
| (7) | |||||
| (8) | |||||
| (9) |
and correlators for baryons composed of degenerate quarks using
| (10) | |||||
| (11) |
For the vector meson, we average our correlators over the three polarisation states, for the nucleon we average the 11 and 22 spinor indices of the correlator, and for the we project out the spin- component and average over the four spin projections. Our quark propagators incorporate the rotations required to ensure that using these interpolating fields yields -improved correlators. This and our computational procedure are described in detail in reference [2].
Except where explicitly stated otherwise, the errors quoted in this paper are purely statistical and are calculated according to the prescription:
-
•
create 1000 bootstrap samples from the original dataset of 60 configurations by randomly choosing, with replacement, 60 configurations per sample;
-
•
for each bootstrap sample, perform all the mass fits and extrapolations as for the original data;
-
•
obtain the errors on a given quantity from the confidence limits of the corresponding bootstrap distribution.
2.2 Fitting Procedure
We construct 2-point meson correlation functions from quark propagators with all combinations of the three values. We perform least- fits to the zero-momentum, time-symmetrised time-slice correlators to single cosh functions. For the pseudoscalar channel, we fit over the time range to for all combinations. For the vector channel, we use the fitting range to for all except the heaviest degenerate- case, where we use to . For the baryons, we construct 2-point correlation functions only for the degenerate cases. We fit the appropriate average of the forwards and backwards, zero-momentum time-slice correlators to single exponential functions, choosing the time ranges to for the nucleon and to for the . We take account of time correlations in the least- fits.
We carried out an extensive investigation of the most appropriate fitting ranges, before arriving at the above choices. With reference to the effective mass plots in Figures 2 and 3, we fixed to be as large as possible and reduced until the dof showed a significant increase. In this way, we attempted to fit as many time slices as possible. We followed the reasoning of reference [13] in fitting our data as far out as possible to avoid contamination from excited states at earlier times.


In Figure 4 we show the variation of the degenerate-quark vector meson mass estimates and of the corresponding dof with the position of the first time slice, , in a variable window, fixing .
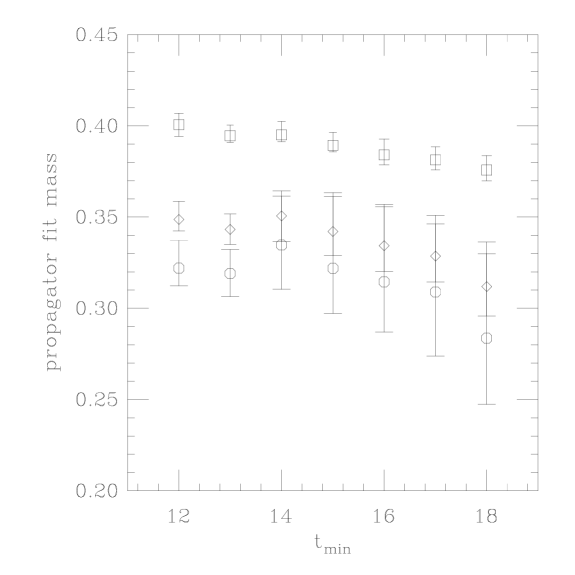

We observe a slow monotonic decrease from onwards, at all values, although there is no significant variation in dof from and the mass estimates agree within statistical errors for the two lightest values. The case of the heaviest value is more problematic given the small statistical errors. We adopt the compromise choice of for this, which is consistent with a wider range of other choices of . We attempt to quantify in Table 1 the systematic error arising from the choice of fit range, by taking the lowest and highest mass estimates from fits with values of acceptable according to the above criteria. We note that the monotonic decrease in our mass estimates with increasing is reflected in the asymmetry of the systematic error estimates towards lower mass values. However, beyond this, we feel unable to quote quantitative estimates of this error in our results.
| error | |||||
|---|---|---|---|---|---|
| statistical | systematic | ||||
| 0.14144 | 0.395 | 0.376 | 0.389 | ||
| 0.14226 | 0.351 | 0.312 | 0.343 | ||
| 0.14262 | 0.335 | 0.284 | 0.319 | ||
In Figure 5 and Table 2 we show the corresponding data for the nucleon. These provide convincing evidence of plateaux at all three values, beginning at for the heaviest and at for the two lightest masses. We note that the large upper error bars in the latter data at and 15 may indicate the sensitivity of the bootstrap sampling to the tail of the excited-state contributions. For this reason, we take for all three values. The systematic error estimates in Table 2 are well within the statistical errors, giving us confidence in our choice of fit range.


| error | |||||
|---|---|---|---|---|---|
| statistical | systematic | ||||
| 0.14144 | 0.573 | 0.568 | 0.573 | ||
| 0.14226 | 0.475 | 0.452 | 0.462 | ||
| 0.14262 | 0.392 | 0.372 | 0.372 | ||
We calculate the pseudoscalar decay constant from the ratio
| (12) |
fitting to the same time slice range as in the fit to the pseudoscalar correlator. We use the parameters from this latter fit to fix and the matrix element . We find that this particular ratio of correlators gives the cleanest signal from which to extract [12]. We determine by fitting to
| (13) |
Here, and are the factors required to ensure that the lattice currents obey the correct current algebra in the continuum limit [14, 15].
3 Results
3.1 Masses and Decay Constants in Lattice Units
In Table 3 we present the masses and decay constants of the vector and pseudoscalar mesons calculated from both degenerate-quark and non-degenerate-quark correlators. The dof are all satisfactory, being generally between 0.5 and 2. The degenerate-quark data may be compared with our results from the first 18 configurations, presented in [2], where our fit range was 12 – 16 for all hadrons. Our new estimates are within of the 18 configuration estimates. The errors are reduced by a factor of approximately 2.
| degenerate | non-degenerate | |||||
| 0.14144 | 0.14226 | 0.14262 | 0.14144 | 0.14262 | 0.14226 | |
| 0.14144 | 0.14226 | 0.14262 | 0.14226 | 0.14144 | 0.14262 | |
| 0.298 | 0.214 | 0.167 | 0.259 | 0.241 | 0.192 | |
| 8.7/7 | 6.9/7 | 7.2/7 | 6.3/7 | 5.3/7 | 6.9/7 | |
| 0.389 | 0.343 | 0.319 | 0.370 | 0.360 | 0.331 | |
| 13/7 | 7.8/9 | 4.0/9 | 12/9 | 9.1/9 | 5.4/9 | |
| 0.063 | 0.072 | 0.074 | 0.070 | 0.071 | 0.073 | |
| 0.0624 | 0.0512 | 0.0452 | 0.0567 | 0.0539 | 0.0482 | |
| 12/8 | 9.2/8 | 8.3/8 | 11/8 | 9.2/8 | 8.1/8 | |
| 0.314 | 0.345 | 0.356 | 0.332 | 0.336 | 0.350 | |
| 13/7 | 7.8/9 | 4.0/9 | 12/9 | 9.1/9 | 5.4/9 | |
As noted previously [1, 2], experimental data suggests that the hyperfine splitting, , should be only weakly dependent on the quark masses for light hadrons, and this we observed within large errors. Our higher-statistics results quoted in Table 3, are shown in Figure 6. The new data for both degenerate and non-degenerate quarks is entirely consistent with our earlier results, but with significantly smaller errors.

In Table 4 we present the masses of the nucleon and computed using degenerate quarks only. Again, the dof of the fits is acceptable. Our estimates for the nucleon mass are about below our estimates based on the first 18 configurations [2], with only slightly smaller errors. It is clear from Figure 5 that is not in the plateau region when using 60 configurations. We have used the increase in sample size primarily to reduce the systematic error in the mass due to contamination by excited states. However, this may not be the only effect. We observe increasing fluctuations in the nucleon mass with decreasing quark mass, and fluctuations which decrease the nucleon mass tend to dominate the statistical average. The influence of such fluctuations in the present analysis may be more pronounced because we fit the nucleon correlator further from the source.
| degenerate | |||
|---|---|---|---|
| 0.14144 | 0.14226 | 0.14262 | |
| 0.573 | 0.462 | 0.372 | |
| 6.5/5 | 5.9/5 | 3.2/5 | |
| 0.646 | 0.577 | 0.556 | |
| 0.7/4 | 1.1/4 | 1.7/4 | |
Apart from at the highest quark mass, where our new estimate is lower, our estimates for agree with our previous results. The errors have not decreased, probably because of the extended fitting range.
We have looked for evidence of correlations between successive configurations, by varying the bin size in a jackknife error analysis. This did not reveal any significant effects in the hadron time slice correlators.
In Figure 7 we show the Edinburgh plot for our degenerate-quark data. The corresponding mass ratios are given in Table 5. The apparently alarming fall of the data points may not indicate any discrepancy with experiment, as we shall see that the chirally-extrapolated value of is 1.07, within of the experimental value, as may be deduced from Table 10. Indeed, our higher-statistics results are only below our earlier result using local sources and sinks [1]. We attribute this difference to our new, lower estimates for the nucleon mass. We remark that were the systematic errors in the vector meson mass, discussed above, to be included somehow, the tendency would be for the upper and right-hand error bars to increase.

| 0.14144 | 0.77 | 1.47 |
|---|---|---|
| 0.14226 | 0.62 | 1.35 |
| 0.14262 | 0.52 | 1.17 |
3.2 Quark-Mass Dependences
We fit our lattice estimates for the meson masses, decay constants and their ratios, for all six quark-mass combinations, to the expression (4) with , the coefficient of , (A) unconstrained and (B) constrained to be zero. In Table 6 we present values for the fit coefficients. For all the quantities, the values obtained for in fit (A) are consistent with zero to within one or two standard deviations. The dof for all the fits are satisfactory, although mostly a little larger for fit (B), and in each case the two fits give completely consistent values for and . This is the numerical evidence that these physical quantities depend only on the sum of the quark masses. As there is no theoretical justification for , nor any support for this from our data, from hereon we use only the results of fit (B).
| fit (A) parameters | ||||
| dof | ||||
| 0.0 | 2.12 | 4.3/3 | ||
| 0.29 | 2.3 | 0.1 | 1.9/3 | |
| 0.041 | 0.53 | 4.8/3 | ||
| 0.38 | 0.0 | 1.2/3 | ||
| 0.142 | 0.5 | 3.1/3 | ||
| fit (B) parameters | ||||
| dof | ||||
| 0.0 | 2.12 | 0.0 | 9.5/4 | |
| 0.29 | 2.5 | 0.0 | 2.5/4 | |
| 0.040 | 0.53 | 0.0 | 7.1/4 | |
| 0.38 | 0.0 | 1.3/4 | ||
| 0.142 | 0.4 | 0.0 | 5.6/4 | |
3.3 Chiral Extrapolations
Firstly, we fit our estimates of the pseudoscalar meson mass for all six quark-mass combinations to the form in Equation (2), and obtain from extrapolating the fit in both ’s to . This gives
| (14) |
in good agreement with, although significantly more accurate than, our estimate from 18 configurations [2]. In Figure 8, we present the plot of versus from which we derive , defining an effective as
| (15) |
The fact that both the degenerate- and non-degenerate-quark data agree well with the fit is graphical evidence of our claim in the previous section that the pseudoscalar meson mass depends only on the sum of the quark masses, and confirms the observation of reference [7]. The chiral extrapolation of to using Equation (3) is also shown in Figure 8; again, we conclude from the good agreement between the data and the fit that depends only on the sum of the quark masses.


We present, in Figure 9, the chiral extrapolations of the nucleon and . It is evident that for the nucleon the quality of the linear fit is rather poor. This is supported by the fact that the dof for this fit is 5.1, compared to the value 2.4 obtained for the pseudoscalar meson fit and 0.63 obtained for the vector meson fit. Negative curvature of the nucleon has been observed before (see for example [9, 16]). A linear fit to our data for gives a smaller dof of 2.7, as well as a substantially smaller estimate for the nucleon mass in the chiral limit. However, because there is no theoretical justification for this choice of extrapolation, and because we cannot reliably compare different choices with only three data points, we quote results only from the linear extrapolation of , noting that there is significant uncertainty in this procedure. We see no such problem with the chiral extrapolation of , although the errors are larger.


The inverse lattice spacing, , in physical units, obtained from each of the , nucleon and masses, is given in Table 7. Throughout the remainder of this paper, we will use to set the scale. In so far as there is good agreement between the scales from the string tension and , our results in physical units are not especially dependent on the chiral extrapolation. The corresponding values for the nucleon and masses in physical units are given in Table 10.
| physical quantity | lattice value | (GeV) |
|---|---|---|
| 0.29 | 2.7 | |
| 0.31 | 3.0 | |
| 0.50 | 2.5 | |
| 0.161(3) | 2.73(5) |
3.4 Determination of the Strange Quark Mass
We calculate the value of from the fit to the ratio for all six quark-mass combinations, extrapolating to , and using to match the ratio to its experimental value, , giving
| (16) |
This value agrees well with that obtained from degenerate-quark data with smeared sinks in reference [2]. We note that lies between two of our quark masses, so that our strange-quark results are obtained by interpolation, an intrinsically more robust procedure than extrapolation.
Our value of corresponds, in the lattice regularisation, to a strange quark mass in physical units of
| (17) |
where we have used to determine the lattice spacing in physical units. From this we can determine the renormalised strange quark mass in the scheme at a reference renormalisation scale of GeV:
| (18) |
where we have used the perturbative value of the renormalisation constant relating and [17], together with the effective coupling defined in reference [18]. This result agrees with the conclusion from previous lattice evaluations of the strange quark mass (see reference [19] for a simulation with Wilson fermions and reference [20] for one with the clover action at ), that is at the lower end of expectations [21, 22]. The value given in Equation (18) can be compared to MeV quoted in reference [19] and MeV quoted in reference [20].
3.5 Spectrum and Decay Constants in Physical Units
We present the results for meson masses and decay constants, extrapolated/interpolated to the physical values, in Table 8, using the parameters of fit (B). As indicated in Table 8, the ratios of the decay constants need to be multiplied by renormalisation constants before they can be compared with experimental numbers. The perturbative estimates for these renormalisation constants [15], using the effective coupling, are
| (19) |
Incorporating these values for the renormalisation constants and using the lattice scale from in Table 7, we obtain the meson masses and decay constants in physical units presented in Table 9.
| 0.251 | |
| 0.326 | |
| 0.364 | |
| 0.075 | |
| 0.040 | |
| 0.048 | |
| 1.20 | |
| 0.380 | |
| 0.359 | |
| 0.337 | |
| 1.13 | |
| 1.06 | |
| 0.142 | |
| 0.165 | |
| 0.148 |
| lattice estimates | experiment | |
| 670 MeV | “686 MeV” | |
| 868 MeV | 892 MeV | |
| 970 MeV | 1020 MeV | |
| 0.53 (GeV)2 | 0.55 (GeV)2 | |
| 102 MeV | 132 MeV | |
| 123 MeV | 160 MeV | |
| 0.316 | 0.28 | |
| 0.298 | ||
| 0.280 | 0.23 | |
| 0.138 | 0.172 | |
| 0.160 | 0.208 | |
| 0.144 | 0.179 |
The results for , and , although below experiment, provide support for our determination of . However, they are open to the interpretation that the vector meson masses may be slightly underestimated relative to the pseudoscalar meson masses, as a result of the suppression of spin-splittings in the quenched approximation. Our result for is significantly more precise than that obtained with the standard Wilson action at by Lipps et al. [4] who quote MeV, and by Loft & DeGrand [9] who obtain MeV. It is comparable with the value 896(17) MeV obtained using a renormalisation-group-improved action by Iwasaki [8]. Lipps et al. and Iwasaki both use to determine , based on the assumption that the is pure , and so we are only able to compare our result for with that of Loft & DeGrand, who give 868(114) MeV. Loft & DeGrand determine from the , which is the hypothetical pure pseudoscalar meson, whose theoretically-expected mass of 686 MeV [4] agrees well with our calculation.
Martinelli and Maiani [5] noted that the ratio typically gives a value for the inverse lattice spacing which is lower than that obtained using other physical quantities. The ratio is estimated by assuming that and are linear in the sum of the quark masses, Equations (2) and (3), so that:
| (20) |
and
| (21) |
We obtain GeV, in good agreement with our low-statistics results [2]. This is consistent with the scales we obtain from other physical quantities, although it remains on the low side.
Our results for the pseudoscalar decay constants are below their experimental values. This has been noted recently in simulations using the standard Wilson action [23]. These authors argue that a smaller value of the decay constant is to be expected in the quenched approximation than in the full theory, as a consequence of the smaller wavefunction at the origin. The discrepancy may also be partly due to our use of the perturbative value for . Recent non-perturbative calculations at , and at a single value of the quark mass, put the value of [24], somewhat higher than the perturbative value. Thus, it may be hoped that a full non-perturbative evaluation of at will raise our estimates of the decay constants, bringing them closer to the experimental values. The uncertainty in the renormalisation constant is removed in the ratio , which agrees well with the experimental value of 1.22. This suggests that, although we are working in the quenched approximation, we obtain correctly the dependence on the strange quark mass. We cannot attribute the problem with the overall normalisation to quenching until we have a precise non-perturbative determination of the axial current renormalisation.
Experimentally, the ratio of the pseudoscalar decay constant to the vector meson mass is fairly insensitive to the -flavour-symmetry breaking. In Figure 10 we plot this ratio versus for both the degenerate- and non-degenerate-quark data. The slope agrees well with that of the experimental data and we note that an increase in of order 25% would give excellent agreement between the two.

Our estimates for the vector meson decay constants, and , given in Table 9, lie above the experimental values. This is shown for all our data in Figure 11. The discrepancy is small for the , but it becomes significant for the , although the slope of the data is consistent with experiment. The sign of the discrepancy is opposite to that expected from the suppression of the wavefunction at the origin by the quenched approximation, suggesting that other effects are important. The difference is less likely than in the case of the pseudoscalar decay constant to be due to our use of the perturbative value of the renormalisation constant, because at least at is known to be close to its non-perturbative value [24]. Thus, we suspect that significant discretisation and/or finite-volume errors are present.

For the baryon data in Table 4, we perform extrapolations and interpolations in the single value to obtain our predictions for the physical masses. The and baryons both have , so by interpolating our fits to we can obtain , as shown in Table 10. We are encouraged by the good correspondence between our computed values and the experimental masses presented in the table. However, the low confidence we have in the linear chiral extrapolation of the nucleon means that we cannot attach much significance to the comparison between the computed and experimental values for . The extrapolation of does not have this problem, and the interpolation to gives a value of very close to the experimental number. This indicates that our calculation of can be applied sensibly to the baryon sector. Our value for is to be compared with that of Lipps et al. [4] who quote MeV, Loft & DeGrand [9] who quote MeV, and Iwasaki [8] who quotes MeV.
| extrapolated values | experiment | ||
|---|---|---|---|
| lattice units | MeV | ||
| 0.31 | 820 | 938 MeV | |
| 0.50 | 1300 | 1232 MeV | |
| 0.62 | 1650 | 1672 MeV | |
| 2.0 | 1.78 | ||
Our determination of the spin- baryon mass provides us with an alternative means of determining , by interpolating our lattice data to the physical value of . Using to set the scale, we obtain in this way , MeV and MeV. Although there remains an implicit dependence of these estimates on the chiral extrapolation, through our use of , this can be avoided by, for example, taking the scale from the string tension. It is evident from Table 7 that this would give similar values. Thus, this method of determining depends only on the mild assumption that the baryon mass varies smoothly with quark mass close to the strange quark mass. The agreement, within the somewhat larger statistical errors, with the value of obtained from , in Equation (16), and with the corresponding mass estimates in Table 9, provides a further check on our determination of . Finally, we note that assuming that the is pure does not in practice permit the determination of from hadrons composed solely of quarks, because the numerical data for the ratio is only weakly dependent on .
4 Conclusions
Despite working in the quenched approximation, our simulations using the clover action at demonstrate good agreement for meson masses and decay constants with the dependence on light quark masses, including -flavour-symmetry breaking, expected from chiral perturbation theory. In particular, we find evidence from simulations with non-degenerate quarks that the dependences on the bare quark masses,
| (22) | |||||
| (23) |
hold at least for quark masses up to that of the strange quark. Our results for the strange-particle spectrum are encouragingly close to the experimental values, and the dependence of both the pseudoscalar and vector decay constants on is consistent with experiment. The only serious problem in the meson sector shows up in the actual values of the decay constants. For the pseudoscalar case, the sign of the discrepancy is consistent with the expectation that the wavefunction at the origin is reduced in the quenched approximation, but whether the magnitude is entirely attributable to this effect or is due in part to our use of the perturbative value for the axial current renormalisation is not known. Our results for the vector decay constants are more difficult to interpret, as the discrepancy is in the opposite direction, which may signal the presence of other effects. It is clearly important to calculate the current renormalisations non-perturbatively at for at least two values of the quark mass.
We have not explored -flavour-symmetry breaking in the baryon sector, but only present results for degenerate quarks. Compared with the chiral extrapolations for the other hadrons, a linear chiral extrapolation for the nucleon is not well supported by our data, and leads to a nucleon mass which is lower than is typical of quenched simulations to date, although in better agreement with experiment! On the other hand, our results for the and are less problematic. They are also in good agreement with experiment, and the result for the , along with our results for mesons, encourages us to believe that we have good control of the strange-quark physics that can be obtained from 2-point functions.
Acknowledgements
This research is supported by the UK Science and Engineering Research Council under grants GR/G 32779, GR/H 49191, GR/H 53624 and GR/H 01069, by the University of Edinburgh and by Meiko Limited. CTS and ADS thank SERC for financial support. We are grateful to Edinburgh University Computing Service and, in particular, to Mike Brown for his tireless efforts in maintaining service on the Meiko i860 Computing Surface.
References
- [1] UKQCD Collaboration (C.R. Allton et al.), Phys. Lett. B284 (1992) 377.
- [2] UKQCD Collaboration (C.R. Allton et al.), Quenched Light Hadron Mass Spectrum and Decay Constants: the effects of -Improvement at , Edinburgh preprint 92/507, February 1993.
- [3] F. Fucito, G. Martinelli, C. Omero, G. Parisi, R. Petronzio & F. Rapuano, Nucl. Phys. B210 (1982) 407.
- [4] H. Lipps, G. Martinelli, R. Petronzio & F. Rapuano, Phys. Lett. 126B (1983) 250.
- [5] L. Maiani & G. Martinelli, Phys. Lett. 178B (1986) 265.
- [6] F. Butler, H. Chen, J. Sexton, A. Vaccarino & D. Weingarten, Phys. Rev. Lett. 70 (1993) 2849.
- [7] G. Martinelli, C. Omero, G. Parisi & R. Petronzio, Phys. Lett. 117B (1982) 434.
- [8] Y. Iwasaki, Nucl. Phys. B (Proc. Suppl.) 4 (1988) 130.
- [9] R.D. Loft, T.A. DeGrand, Phys. Rev. D39 (1989) 2678.
- [10] B. Sheikholeslami & R. Wohlert, Nucl. Phys. B259 (1985) 572.
- [11] G. Heatlie, C.T. Sachrajda, G. Martinelli, C. Pittori & G.C. Rossi, Nucl. Phys. B352 (1991) 266.
- [12] UKQCD Collaboration (C.R. Allton et al.), Gauge-Invariant Smearing and Matrix Correlators using Wilson Fermions at , Edinburgh preprint 92/513, Phys. Rev. D (1993) in press.
- [13] Y. Iwasaki, K. Kanaya, S. Sakai, T. Yoshié, T. Hoshino, T.Shirakawa & Y.Oyanagi, Nucl. Phys. B (Proc. Suppl.) 30 (1993) 397.
- [14] M. Bochicchio, L. Maiani, G. Martinelli, G. Rossi & M. Testa, Nucl. Phys. B262 (1985) 331.
- [15] A. Borrelli, C. Pittori, R. Frezzotti & E. Gabrielli, New improved operators: a convenient redefinition, CERN preprint TH.6587/92 (1992).
- [16] APE Collaboration (S. Cabasino et al.), Phys. Lett. B258 (1991) 195.
- [17] E. Gabrielli, G. Heatlie, G. Martinelli, C. Pittori & C.T. Sachrajda, Nucl. Phys. B362 (1991) 475.
- [18] G.P. Lepage & P.B. Mackenzie, Nucl. Phys. B (Proc. Suppl.) 20 (1991) 173.
- [19] A. Abada et al., Nucl. Phys. B376 (1992) 172.
- [20] G. Martinelli, C.T. Sachrajda, G. Salina & A. Vladikas, Nucl. Phys. B378 (1992) 591.
- [21] 1992 Review of Particle Properties, Phys. Rev. D45 (1992) II.4.
- [22] C.A. Dominguez & E. De Raphael, Ann. Phys. (N.Y.) 174 (1987) 372.
- [23] F. Butler, H. Chen, J. Sexton, A. Vaccarino & D. Weingarten, Meson Decay Constant Predictions of the Valence Approximation to Lattice QCD, IBM preprint (1993).
- [24] G. Martinelli, S. Petrarca, C.T. Sachrajda & A. Vladikas, Non-perturbative renormalisation of two-quark operators with an improved lattice fermion action, in preparation.