Liverpool Preprint: LTH 303
Wuppertal Preprint: WUB 93–10
hep-lat/9304012
21/4/93
A comprehensive lattice study of SU(3) glueballs
UKQCD Collaboration
G.S. Bali, K. Schilling
Physics Department,
Bergische Universität, Gesamthochschule Wuppertal,
Gauss Strasse 20, 5600 Wuppertal 1, Germany
A. Hulsebos, A.C. Irving,
C. Michael, P.W. Stephenson
DAMTP, University of Liverpool, Liverpool L69 3BX, UK
We present a study of the glueball spectrum for all values at lattice spacings down to GeV () using lattices of size up to . We extend previous studies and show that the continuum limit has effectively been reached. The number of clearly identified states has been substantially increased. There are no clear signals for spin-exotic glueballs below 3 GeV. A comparison with current experimental glueball candidates is made.
Introduction
The extraction of reliable predictions for the glueball spectrum of QCD remains an important challenge for lattice gauge theory. As part of a recent programme to study non-perturbative pure SU(3) gauge theory closer to the continuum limit, we have obtained new data for glueball masses which confirm that results of relevance to continuum physics are indeed being achieved with currently accessible lattices. The low-lying spectrum for pure glue states below 3 GeV or so has become well established now and awaits progress with understanding the effects of light-quark mixing.
Glueballs are not particularly light — they start around 1500 MeV — and have no non-trivial flavour content. The extraction of a signal in the presence of vacuum fluctuations is therefore more difficult than for many other hadrons or for potentials. In this situation it is highly desirable to perform coherent measurements over a suitable -range, in order not to be lost in possible systematic effects. In this spirit we apply here the techniques used by and, in some cases, pioneered by Michael and Teper (MT) [1, 2, 3] and extend their analysis. They used lattices ranging from to , at values up to . In the meantime, there has been progress both in the available computing power and in the efficiency of updating algorithms. In this work we have used a hybrid [4, 5] of heat-bath and over-relaxation. The code was specifically developed for the Connection Machine and was run on an 8K machine at Wuppertal and a 16K machine at Edinburgh. The key parts of the code, including the group theory, were thus independent of previous work. We have concentrated on on — slightly larger in physical size than the largest size used by MT, but have also taken data at and where a direct comparison could be made.
Measurement procedures
The results presented in this letter were based on the measurement of 3220 configurations, each separated by ten sweeps. Every fifth sweep was a heat-bath step, the remainder being Creutz over-relaxation. The data was obtained in two parts, from hot and cold starts with at least 2000 sweeps used to equilibrate in each case. During the subsequent analysis, described below, a careful check was made that no residual equilibration effects were present, that both samples were consistent, and the measurement sampling rate was reasonable compared with the autocorrelation times. A direct measurement of the autocorrelation time gave sweeps for the correlators of interest. In order to allow greater flexibility in analysis and to allow further cross-checking, the in-line measurements were done in a rather general way. They were made on the lattice configuration obtained from an configuration by Teper fuzzing [6] with the link/staple mixing parameter . On each time slice, operator momentum transforms for a variety of oriented ‘shapes’ and for all cubic orientations were stored for this level of fuzzing, and for each subsequent level up to the maximum physically reasonable. The shapes were as noted in table 1 (see ref. [3] for details and a diagram).
| Links | Shapes | Orientations | Fuzz levels |
|---|---|---|---|
| 4 | plaquette | 3 | 1,2,3,4 |
| 6 | rectangle | 6 | 1,2,3 |
| 6 | chair | 12 | 1,2,3,4 |
| 8 | hand | 48 | 1,2,3 |
| 8 | butterfly | 24 | 1,2,3 |
Non-zero momentum operators were used only for the plaquette shape for which we considered where . Because of the initial fuzzing step before measurement, the space points summed over were spaced by 2 units so that the momentum eigenvalues were unique only up to modulo . For small momenta the contamination is expected to decay very fast in Euclidean time. By studying similar sized lattices in we did confirm this effect but found that the correlations, and hence ratios showed significant contamination from the high momentum piece. Because of the variational nature of the calculation (see below) this did not affect our spectrum results at all. The total time used to update the gauge configuration and make these primary measurements was of order 300 hours (16K CM-200 equivalent). The gauge update time was sec per link.
The operator sums for each time-slice were analysed off-line. We studied Euclidean time correlators for all representations of : , , , and for both values of parity and C-parity [7]. The relevant projection table is given, for example, in ref. [8]. In addition, we studied Polyakov line correlators (the torelon) as a cross check on the string tension. Further data acquired for smeared Wilson loops and for the topological susceptibility will be presented elsewhere [9]. In the off-line analysis of correlations, a variational approach was used [3] in which a matrix of correlators is formed using, as basis, the different relevant operator shapes and fuzzing levels. By diagonalising the transfer matrix and studying ratios of eigenvalues at consecutive Euclidean times, one obtains upper bounds on the effective mass (or energy for non-zero momentum) of the ground state in each channel. In principle, estimates of excited states can also be made.
There are two cross-checks on the reliability of the mass values so obtained. First, the overlaps for the various operators are obtained. For a stable determination, one would prefer large ‘wave-function’ components carrying the same sign rather than a delicate cancellation (as a result of a poor choice of basis). Indeed, we have checked the stability of our results to using smaller and differing samples of basis operators. The receives contributions from a broad range of shapes and fuzzing levels, while the remaining states receive dominant contributions from the maximum fuzzing level, mostly from the ‘hand’ shaped loops (see table 1). Second, one expects the ground state in each channel to dominate at large Euclidean time. We have monitored the difference between successive effective masses to find at which value this becomes statistically insignificant. For the determination of errors, we have always used the bootstrap sampling procedure where the data are organised in bins large compared with the measured autocorrelation length.111In fact, for test observables, we have used the bin size dependence of the measured variance to cross-check the direct measurements of the autocorrelation time quoted above. For the majority of states, the effective mass ‘plateau’ identified in this way starts at time ratio .
Results
Table 2 contains the measured effective masses of all ground state glueballs which can be studied on a hypercubic lattice. Where a significant signal was found, the chosen plateau value and its associated error estimate is indicated by bold face. Where larger time ratios gave higher masses or where the plateau was not particularly well established, the error was conservatively estimated from the next larger time ratio. In the final column of the table, the glueball masses are given in units of the string tension from Wilson loops. We find that the spectrum proposed by MT from the average of their large volume data at , and ( [3], table 7) is in agreement with our mass ratios. Our data at (on ) and at (on ) are themselves consistent with the corresponding results of [3]. Overall, we conclude that the new lattice measurements of the low-lying spectrum at do indeed represent useful information about continuum physics.
| Rep. | … | 0/1 | 1/2 | 2/3 | 3/4 | 4/5 | |
|---|---|---|---|---|---|---|---|
| 0.604(7) | 0.435(8) | 0.415(14) | 0.402(20) | 0.38(3) | 3.52(12) | ||
| 1.552(15) | 1.06(4) | 1.05(13) | 1.0(3) | — | 8.9(11) | ||
| 0.911(5) | 0.653(11) | 0.620(17) | 0.61(3) | 0.56(6) | 5.25(25) | ||
| 0.914(5) | 0.638(9) | 0.598(14) | 0.55(2) | 0.52(4) | 5.07(17) | ||
| 1.657(10) | 1.10(3) | 1.06(8) | 1.0(2) | 0.8(6) | 9.0(7) | ||
| 1.155(9) | 0.751(18) | 0.63(4) | 0.69(7) | 0.68(14) | 5.3(6) | ||
| * | 2.34(3) | 1.56(18) | 2.6(24) | — | |||
| 1.265(8) | 0.853(16) | 0.83(4) | 0.77(8) | 0.9(2) | 7.0(3) | ||
| 1.284(7) | 0.851(12) | 0.79(3) | 0.80(6) | 0.95(19) | 6.7(5) | ||
| * | 1.824(10) | 1.22(3) | 0.99(11) | 1.2(5) | — | ||
| * | 2.24(2) | 1.31(9) | 0.8(2) | 0.9(6) | — | ||
| 2.68(3) | 1.6(2) | 0.9(5) | — | ||||
| * | 2.090(18) | 1.23(5) | 1.2(2) | 0.5(4) | — | 10(2) | |
| * | 1.461(12) | 0.97(2) | 0.91(5) | 0.93(12) | 1.0(4) | 7.7(10) | |
| 1.188(5) | 0.837(13) | 0.78(3) | 0.82(7) | 0.92(14) | 6.6(6) | ||
| * | 2.24(3) | 1.55(14) | 1.4(6) | — | |||
| 2.70(3) | 1.5(2) | — | — | ||||
| 1.715(13) | 1.07(3) | 1.03(9) | 1.7(6) | — | 8.7(8) | ||
| 1.804(9) | 1.13(3) | 1.08(9) | 0.9(3) | — | 9.2(8) | ||
| 1.845(11) | 1.17(4) | 1.22(13) | 0.8(3) | 1.2(10) | 9.9(11) |
The restoration of symmetry provides an additional and more stringent test for continuum physics. The expected continuum content of the representations can be found, for example, in ref. [7]. In table 2, we indicate only the lowest possible . We confirm that the and ground states (that both contribute to in the continuum symmetry group) exhibit the expected degeneracy for all combinations. For this has been found previously in ref. [3] for . A related requirement is the restoration of the continuum dispersion relation i.e. Lorentz symmetry. We have been able to test this for the momenta . A one parameter fit222For technical reasons, we have not attempted a full correlated error analysis. of to
| (1) |
yields for the data with . The non-zero momentum results for the mass, though slightly higher than the zero momentum value given in table 2, agree well within errors. These two features give strong support to our statement that, for the low-lying states, our results are effectively measurements of the continuum glueball spectrum.
Different continuum states can contribute to a given representation. A priori their level ordering is not obvious. In fact we observe that the mass is definitely larger than the mass. By assigning the quantum number to the lattice state we have assumed the ‘natural’ ordering . However, the data at show the and to be approximately degenerate. This is not the naïve expectation since the lowest contributing values in each case are , and , , , respectively. One possibility is that the state is in fact lower than the and so gives a common lightest contribution to both lattice states. These higher mass states are difficult to observe cleanly at lower where is unhelpfully large. Indeed this possible degeneracy was not seen by MT at or . Our estimate of at 6.4 is consistent with the data of ref [3] at 6.2, and with both our 6.2 and 6.0 data. For the also, we have a reasonable signal at unlike at where an upper limit only was obtained [3].
According to table 2 we observe reasonably good signals for 10 states of different continuum contents. These are included as the solid circles in fig. 1. Moreover, we determine upper limits for the masses of the remaining 6 states with . These are also shown in the figure.
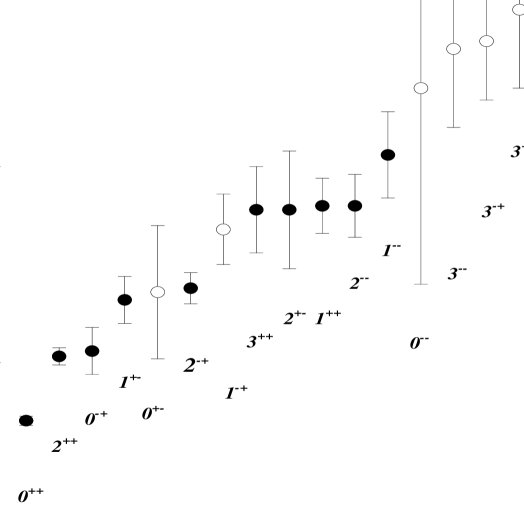
With our lattice resolution ( GeV) and statistics we are in a position to trace the signals over larger time separations and achieve more stringent upper bounds on masses than previously possible. This improves our capability to separate low lying glueball states and establish the spectrum order. The is separated by some 6 standard deviations from the lightest () glueball. Moreover, the glueball is found to be significantly heavier than the . Above the , five further states have been identified but their ordering cannot yet be determined.
Before proceeding with further interpretation of our results, it is useful to convert the continuum predictions in the last column of table 2 to an MeV scale. The extra scale displayed in fig. 1 was obtained by multiplying the latter numbers by a string tension value of MeV. Direct comparison with experiment is valid only within the following two assumptions: (a) that the glueball masses are, for some reason, insensitive to light quark mixing where this takes place and (b) that the physical string tension estimate based on a model for Regge trajectories is reliable for the pure glue sector. Some encouragement for this latter belief is provided by the fact that the scale for light hadron masses set in this way is very reasonable. A recent large scale quenched lattice study of the light meson and baryon spectrum at similar lattice spacings [11] shows excellent agreement with experiment, provided sufficiently small valence quark masses are used for extrapolations. Using the mass to set the scale at yields GeV which is quite consistent with GeV [12] and GeV [4] at as obtained from the string tension. Furthermore, values of deduced from independent studies of the heavy quark potential ( MeV [12] and MeV [5]) are compatible with the (unquenched) values found in experiment [13].
To set the scale in what follows, we have used string tension values extracted from Wilson loops measured on sufficiently large lattices: at [15]. at [15] at [14], at [12] and at [9]. It is interesting to note that the latter value is in good agreement with the effective string tension deduced from our Polyakov-Wilson line correlator (torelon)
| (2) |
One should remember that the latter is subject to a finite size correction of order [17] which on our size of lattice is small ().
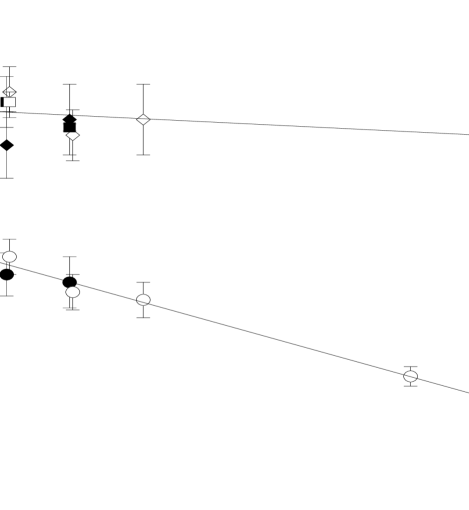
In fig. 2, we show a new compilation of scalar and tensor glueball masses, measured at various couplings. Since the lattice corrections to are expected to be of order , we display the physical masses as a function of where physical units on both axes have been set as described above. The present data is displayed with full symbols and previous data with open symbols ( [3], [16]). We are aware that the string tension results have been obtained by slightly different methods but, for present purposes, the ensuing uncertainties are small compared to the statistical errors from the glueball masses. It is clear that, at least for the scalar glueball, there appears to be little room for uncertainty in any reasonable extrapolation to . A linear fit is shown as an example. The fitted slope to the scalar glueball data suggests a systematic error of less than 5% in extrapolation from , which would be of the same order as the statistical error. Because of this, we henceforth use the results at as an adequate approximation to the continuum spectrum.
Phenomenological considerations
With the above scale ( MeV), the scalar glueball mass prediction from our data is
| (3) |
where the error here is purely statistical. This value is in agreement with previous lattice glueball calculations (e.g. refs. [7, 1, 2, 3, 18]). The status of the [19] as a glueball candidate has recently been considerably strengthened by its independent observation in [20] where a strong coupling to the , but not to the channel, is found. The total width is MeV. Clearly, the lattice calculation is quite consistent with this mass. However, the lattice state is not far from the broad state observed predominantly in but which also couples to (and ). Because of the influence of the and the channel to which they both couple, the width (a few hundred MeV) and indeed the very nature of the is difficult to establish. It seems not unlikely that this pure glue state will suffer mixing and be part of a complex system involving the above states. Future lattice studies of light quark mixing will be very illuminating on this point. Pioneering attempts to study this [21, 22] are hampered by the unphysically large quark masses currently accessible and the difficulty in acquiring sufficient statistics.
The above energy scale estimate puts the tensor glueball at
| (4) |
So far, only one experiment has provided evidence of a glueball candidate in this mass range [23]. A series of three states in the range 2010 to 2340 MeV with widths of 150 to 300 MeV have been seen but not yet independently confirmed. The next predicted glueball state, a pseudoscalar at around the same mass (table 2), has no suitable experimental candidates currently. The search becomes increasingly difficult at high masses where many states overlap and many channels are competing.
As pointed out previously (e.g. ref. [3]), the prediction of low-lying exotic states (i.e. non quark model states) would have interesting theoretical and phenomenological consequences. Michael [24] has recently reviewed the lattice and experimental evidence for glueball and hybrid states with these quantum numbers. Our results (table 2) confirm earlier predictions that no exotic glueball states are expected below about 3 GeV. On the lattice, each representation corresponding to an exotic : , , etc. can also receive contributions from higher, but non-exotic, so identification is unlikely to be straightforward in the absence of very precise data. The strongest exotic signal we have observed is in the channel. There is also some evidence of a signal in the channel. These could correspond to a exotic glueball at around GeV. However, the lowest non-exotic contributing to the would be ( for the ) and so no strong conclusion may be drawn. The and channels also show some sort of signal. These do not satisfy the above criteria for plateau identification and so we only quote these as upper limits. Experimental confirmation of exotic states in the above mass range is likely to be very difficult.
In conclusion, we have demonstrated that at we are effectively at the continuum limit for the quenched glueball spectrum below 3 Gev. To be specific, we observe clear signals for 10 different continuum states. Thus the ordering of the underlying spectrum is becoming established. Further improved studies of lattice glueballs are both practicable and desirable. In the near future, machines capable of sustaining 50 to 100 Gflops on QCD will allow a factor of or so reduction in statistical errors and hence greatly improved effective mass signals. The present work represents a reduction in lattice spacing by 25% and an increase in physical volume by 70% over previous studies. Our results show that there is no need to use larger lattices or smaller lattice spacings to probe the mass range which is likely to be of most experimental relevance i.e. below 3 GeV. However, higher mass states will require larger statistics and lattice spacings such that . In order to estimate the possible influence of mixing effects due to light quarks it will be vital to have increased precision of meson and glueball masses in quenched QCD. This is almost within our grasp.
Acknowledgements
We thank M. Teper for helpful conversations. This research is supported by the UK Science and Engineering Research Council under grant GR H01236 and the EC under grant SC1*-CT91-0642. We are grateful to the Edinburgh Parallel Computing Centre for access to the CM-200 which is supported by the Advisory Board to the Research Councils, and to the Deutsche Forschungsgemeinschaft for support of the Wuppertal CM-2 project (grant Schi 257/1-4).
References
- [1] C. Michael & M. Teper, Phys. Lett. 206B (1988) 299
- [2] C. Michael & M. Teper, Nucl. Phys. B (Proc. Suppl.) 4 (1988) 209
- [3] C. Michael & M. Teper, Nucl. Phys. B314 (1989) 347
- [4] G.S. Bali & K. Schilling, Phys. Rev. D46 (1992) 2636
- [5] G.S. Bali & K. Schilling, Phys. Rev. D47 (1993) 661
- [6] M. Teper, Phys. Lett. 183B (1986) 345; 185B (1987) 121
- [7] B. Berg & A. Billoire, Nucl. Phys. B221 (1983) 109
- [8] C. Michael, Act. Phys. Polon. B21 (1990) 119
- [9] UKQCD collaboration, G.S. Bali et al., in preparation
- [10] UKQCD collaboration, C. R. Allton et al., Phys. Lett. 284B (1992) 377
- [11] F. Butler et al., Nucl. Phys. B (Proc. Suppl.) Amsterdam
- [12] UKQCD collaboration, S. P. Booth et al., Phys. Lett. B (in press)
- [13] T. Hebbeker, Phys. Rep. C217 (1992) 69
- [14] S. Perantonis & C. Michael, Nucl. Phys. B347 (1990) 854
- [15] MTC collaboration, K. D. Born et al., Nucl. Phys. B (Proc. Suppl) 20 (1991) 394
- [16] P. De Forcrand, et al., Phys. Lett. 152B (1985) 107
- [17] P. De Forcrand, et al., Phys. Lett. 160B (1985) 137
- [18] R. Gupta et al., Phys. Rev. D43 (1991) 2301
- [19] D. Alde et al, Nucl. Phys. B269 (1986) 485
- [20] Crystal Barrel Collaboration, C. Amsler et al., Phys. Lett. 291B (1992) 347
- [21] K. M. Bitar et al., Phys. Rev. D44 (1991) 2090
- [22] Y. Kuramashi et al., Nucl. Phys. B (Proc. Suppl.) 26 (1992) 275
- [23] S. J. Lindenbaum, Comments on Nucl. & Particle Phys. 13 (1984) 285
- [24] C. Michael, Proc. of Aachen Workshop, ‘QCD 20 Years Later’, 1992, eds H. Kastrup & P. Zerwas, World Scientific (in press)