Phase diagram of QCD with 2+1 flavors of Wilson quarks at finite temperature and chemical potential
Abstract
The first results on lattice at finite temperature and chemical potential with 2+1 flavors of Wilson quarks are presented. We have studied the dependence of chiral phase transition and deconfinement phase transition on quark mass. Finite volume size analysis and Binder cumulants are used to determine the properties of phase transition. Phase diagram of QCD with 2+1 flavors of Wilson quarks are presented.
pacs:
12.38.Gc, 11.10.Wx, 11.15.Ha, 12.38.MhI Introduction
With the heavy-ion collision experiments at RHIC now running, it is much more important to understand the phase diagram of QCD at finite temperature and finite density. QCD predicts the existence of quark-gluon plasma(QGP) at high temperature and the existence of phase transition between the hadronic matter and the QGP. But there is no direct evidence yet. It is a very important work to locate the phase transition region and to investigate its properties.
The lattice gauge theory (LGT) is the unique nonperturbative method for the quantum gauge field. Lots of MC(Monte carlo) simulations for QCD on lattice were performed to study the quark mass spectrum,gluon ball mass spectrum,phase diagram and so on.
In the past, the most MC simulations for QCD at finite temperature and finite density were performed with staggered quarks owing to its preserving the continuous chiral symmetry . But staggered fermions formalism on the lattice does not completely solved the species doubling problem. For to reduce the fermionic degrees of freedom, MC simulation take the fourth root of the fermion determinant to thin the species doubling problem. The operation can arise the locality problem in simulations with non 4 taste fermions Neuberger:2004be . The Wilson fermion formalism preserves the flavor symmetry and has no the species doubling problem. It is also only known as a formalism that possesses a local action for any number of flavors and is well formalism for MC simulation on lattice.
In our previous workhschen:2005mq , the first phase diagram of QCD with 4 flavors() of Wilson quarks at small chemical potential and high temperature was presented by using imaginary chemical potential method. The critical line of first order phase transition was located at plane. presume that there are four degenerate quarks. But the physically relevant case should be two degenerate massless u,d quarks and one light S quark, which is so-called 2+1 flavors quarks. It is important to investigate the phase diagram of QCD with 2+1 flavor quarks for us to understand the actual state of high density star and the cosmic origin.
In this paper, we will present our results of MC simulations with 2+1 flavors of Wilson quarks at finite chemical potential and finite temperature by using the pure imaginary chemical potential method.
In section II, we will briefly instruct the latterly progress in this domain. In section III, we will presented the formalism used in this paper. In section IV, our detailed results of MC simulation were presented. At last, we will present the conclusion.
II General characteristic of the phase transition for QCD

Before starting our discussion, let us briefly review present understanding of the phase diagram structure. The phase diagram in the () Plane is shown in Fig.1. The () Plane is divided into three main parts, I, II, III. At I domain, where the temperature and chemical potential are below critical line, the QCD matter was formed as hadrons and the quarks are confined. At the II domain, because of extra high temperature and strong interacting, quarks are released and the strongly interacting QCD matter formed the quark-gluon plasma(QGP) and the quarks are deconfined. In the III domain, where the temperature is low and the density of quarks is very high, it is believe that two quarks on the fermion surface can be bound into an Cooper pair, which is so-called color superconductivity. That case is similar to the superconductivity in the electromagnetism. The solid line which end at the point A is the the first order critical line. The dotted line which start from the point A is the the second order critical line. The point A is the trecritical point. It is very important to accurately locate the trecritical point for searching and investigating the QGP.

According to the MC simulation result of the past on lattice, the nature of phase transition of QCD depends on the quantity of quark mass. At zero chemical potential , the schematic phase diagram is shown in Fig.2 in the (,) plane. For the pure gauge case, for which all the quark mass degenerate into infinitely large, a first order transition is expected in the quenched lattice gauge theory. For QCD with two degenerated light u,d quarks and a infinitely large s quark, which is so-called two flavors QCD, it is suggested that the chiral transition is of second order in the limit of vanishing quark massKarsch:1994hm . For three or more degenerate quarks, the transition is characterized as first order while the quantity of quark mass is less than some critical value deForcrand:2003hx . For the non-degenerate quarks, the strange quark is heavier than the u,d quark, one expects a critical line which separates the regime of first order phase transitions from the crossover regimeSchmidt:2002uk . In the other area, the transition is continuous. The structure of phase diagram is sensitive to the the non-degenerated quark mass.
III The Formalism in Lattice Gauge Theory
In the thermal field theory, the canonical partition function can be expressed as:
| (1) |
where is the gauge field action:
is the fermion field action:
where is the quark mass.
On lattice, the canonical partition function is:
| (2) |
where, is the quark mass parameter, is the lattice space, is chemical potential. The gauge field action is:
| (3) |
where is a plaquette on lattice. For QCD with Wilson fermions, the fermion action is :
| (4) |
where is the fermionic determinant:
For , is positive real, MC methods can be used to simulate the thermodynamics of QCD. But for , is complex, the standard MC simulation methods are invalid. Some improved MC methods can be introduced in simulation of QCD . In this paper, the pure imaginary chemical potential method is chosen, which is proper for low baryon density and high temperature.
QCD is a theory of asymptotic freedom. The strength of interaction between two static quarks could reflects on the state of quarks. Strong interaction indicate that quarks are isolated and deconfined. Polyakov loop
| (6) |
can tell us the strength of interaction between two static quarks, which can be used to determine the confinement-deconfinement phase transition. The chiral condensate
is the order parameter of chiral-symmetry breaking. At the chiral limit, non-zero of implied that the chiral-symmetry of QCD is spontaneously broken. According to the present understanding, the chiral transition point is same as the deconfinement transition one.
In this paper, several methods are used to locate the critical point of transition. A method is to search the location of rapid variety of order parameters. The second one is to search the peaks of the order parameter fluctuations at critical points. It is convenient to determine the universality class of transition by using the Binder cumulants of physical quantity at the transition point. The dimensionless fourth order cumulants of an arbitrary observable physical quantity is constructed as
| (8) |
where, is the value at critical point. Binder cumulants calculated on different size lattices will intersect at some value of the quark mass. At the infinite volume limit, these intersection points will converge to a universal value which is characteristic for the universality class. The universal value is quite different for different symmetric system. In , the chiral symmetry of QCD at critical point is like 3D Ising model, the intersection points converge to Schmidt:2001kq . In this paper, is used to determine the characteristic of chiral phase transition.
IV Simulation results for QCD with 2+1 flavors fermions
In this paper, MC simulation are performed with the standard algorithmGottlieb:1987mq . We have modified the MILC collaboration’s public codeMilc to fit the imaginary chemical potential and 2+1 flavor case. MC simulations are performed at lattice size and finite size scaling analysis was checked for some different lattice size in certain parameters. The parameter , which corresponds to parameter of quark mass, was scanned from to . The parameter , which corresponds the mass parameter of s quark and is heavier than quark, was fixed at which is much less than . The is . Each configuration runs 20 molecular steps with microcanonical step size . A configuration is token for measurement every other 20 configurations.
At First, we fix u,d quark mass parameter at , which is far from chiral limit. MC simulations are done by scanning the parameter for different . configurations are measured for every simulation. Polyakov loop and its susceptibility as function of are shown in Fig.3 and Fig.4. As one can see in Fig.3, with increased, raise from approximate zero to obvious non-zero. Especially at , the Polyakov loop show rapidly growth. Exactly at the same location, show sharp peaks for different in Fig.4. The points at the peaks of should be the critical points of deconfinement phase transition. At the same condition, the chiral condensate was also studied synchronously. The chiral condensate and the susceptibility are illustrated in Fig.5 and Fig.6. As is increased, show decrease in Fig.5. At the peaks of in Fig.4, show rapid drop and the susceptibility show sharp peaks too. The results implied that the deconfinement phase transition maybe coincides with the chiral phase transition. On the other hand, it is obvious in Fig.5 that the chiral condensate is nonzero while QCD is in the deconfinement phase. It is due to non-preserving the chiral symmetry for Wilson fermion action . That means the chiral condensate is not any more a good order parameter for the chiral transition of QCD with Wilson fermions. However, we can also find the chiral critical point by locating its rapid change and the sharp peak of its fluctuation.
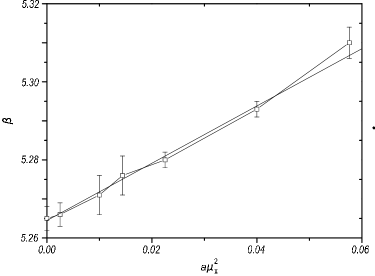
In Fig.4 and Fig.6, the critical points for different can be located approximately. All critical points can be collected into a critical line in plane. For small imaginary chemical potential, this critical line could be expand into Taylor series. From our simulation results, we obtain the critical line up to the quadratic term:
| (9) |
The fitted line is shown in Fig.7. By replacing with , the critical line (9) is transformed from imaginary chemical potential case to real chemical potential case:
| (10) |
According to the renormalization group relation between the lattice spacing and , the two loop perturbative expression gives
where is the lattice QCD scale. The temperature is related to and by . The critical line on the plane is shown in Fig.8.

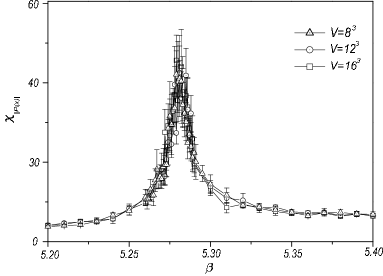
In order to determine the properties of the transition, the dependencies of the transition on the spatial volume of the lattice are studied. While the lattice volume is respectively and is fixed at , the results are shown in Fig.9. It is clear that the fluctuation of have no obvious dependence on the the lattice size and the location of critical points have not shown distinguishable shift. It suggests that the transition is just crossover while the u,d quark mass is far away from the chiral limit.
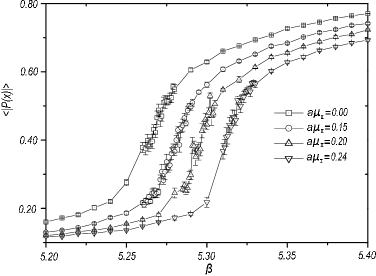
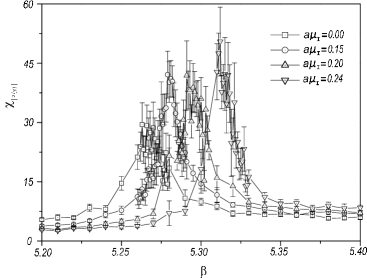
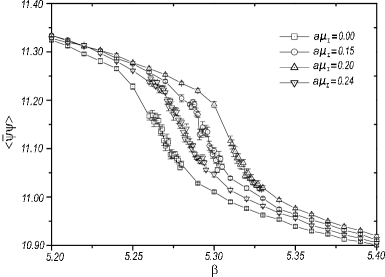
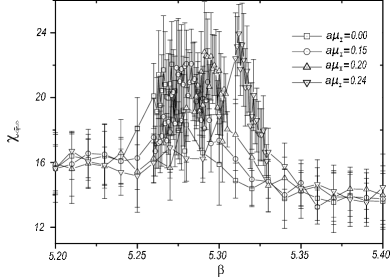
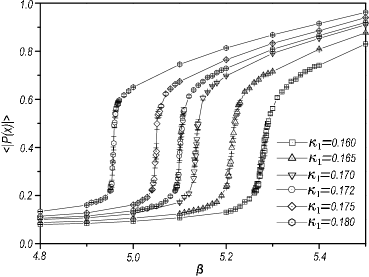
At the following, the dependences of phase transition on the quantity of u,d quark mass near the chiral limit are studied. Here, the chemical potential is fixed at , we scanned u,d quark mass parameter from to . As is increased, which correspond to decrease the quantity of quark mass, the results of MC simulation at the critical points show likewise change as above paragraphs. The detailed results of and versus were shown in Fig.10 and Fig.11.
.
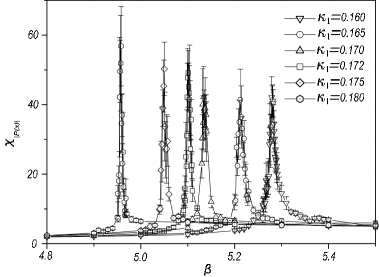
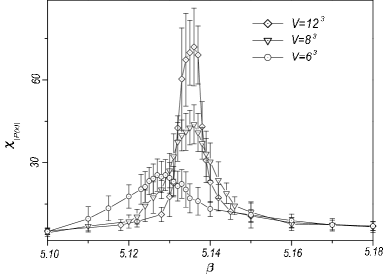
It is obvious in Fig.10, for large value of the ascending rate of the quantity of near the critical points are more steep and the peaks of in Fig.11 at the critical points are more sharp and higher. That implies that for tiny u,d quark mass the deconfinement phase transition could be of first order.
The finite volume size effects are checked in and . configurations are measured for every simulation. The as function of are shown in Fig.12. The peak value of is shown higher for greater lattice volume and the location of the critical point is shown obvious shift with different lattice volume size. For a second order transition, . Our results are fitted to , and we get . The result suggests that the transition is of second order in the situation.
As one can see in Fig.10, for the variety of at the critical points is very rapid. In and , the history of MC simulation is shown in Fig.13 and the histogram of the Polyakov loop norm is shown in Fig.14. Two plateaus at and alternately appeared in the history of MC simulation and two peaks respectively at and are distinguishable in Fig.14. Especially for tiny quark mass , the structure of two peaks in the histogram are shown more outstanding. The results suggest, while the quantity of quark mass is decreased to be close to the chiral limit and the s quark mass is large enough, the deconfinement phase transition should be of first order.


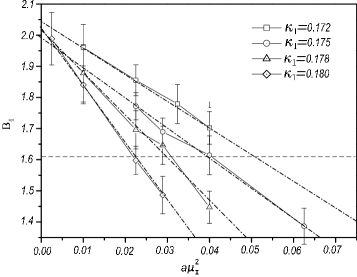
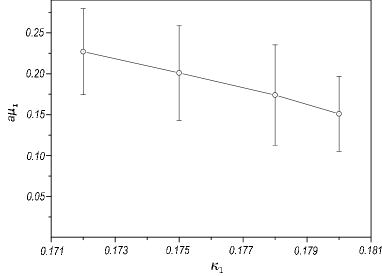
In order to investigate the universality class of the phase transition, Binder cumulants are calculated in different quark mass and chemical potential. For , MC simulation are performed by scanning . configurations are measured for every simulation. The results of B4 are shown in Fig.15. With increasing , B4 drops. For , . A second order point, which is chosen as the critical value of 3D Ising model, separate the first order from the crossover. The phase transition for should be of first order and for could be crossover. According to above results, the phase transition near should be of second order and for should be crossover, their exact border can not be located by traditional methods. From Fig.15, we got the second order critical cure in Fig.16 in the plane. For small , we can Taylor-expand the critical line in Fig.16 as:
From Fig.16, we get . By replacing by , the critical line is continued from imaginary chemical potential to real chemical potential:
| (12) |
According to (12), for small (large u,d quark mass) the critical point A in Fig.1 is more close to the T axis. Especially while , the critical point A will collide with T axis and disappear. The result coincides with deForcrand:2006pv .
V Conclusions
In this paper, we have used MC simulation on lattice with 2+1 flavors Wilson fermions to determine the structure of the phase diagram of QCD at finite temperature and small density. As we have discussed in the part of instruction, the operation that the fermionic determinant is token the fourth root to thin the species doubling problem in MC simulation with staggered fermions can arise the locality problem in simulations. Whereas the MC simulations with Wilson fermions on lattice have no this puzzled problem.
According to our results of MC simulation, the schematic expected phase diagram was shown in Fig.17. Below the chiral limit surface and above the surface , the space was separated into two parts by the phase transition interface. QCD is in hadronic matter phase inside the phase transition interface and in QGP phase outside the phase transition interface. The phase transition interface is separate into the first order and the crossover by a second order critical curve. The critical curve is just the critical point A in Fig.1 which is function of quark mass.

VI Acknowledgments
We thank M. D Elia, C. DeTar, P. de Forcrand, E. Gregory, and M. Lombardo for useful discussions. All simulations are performed on the HPCC of Linux PC cluster in SYSU and YZU. At last, I am very sorrowful to hear the death of my cooperator, Prof.Xiangqian.Luo.
References
- (1) H. Neuberger, arXiv:hep-lat/0409144, to appear in Phys. Rev. D.
- (2) H. S. Chen, X. Q. Luo, Phys. Rev. D 72, 034504 (2005).
- (3) F. Karsch and E. Laermann, Phys. Rev. D 50 (1994) 6954 [arXiv:hep-lat/9406008].
- (4) P. de Forcrand and O. Philipsen, Nucl. Phys. B 673 (2003) 170 [arXiv:hep-lat/0307020].
- (5) C. Schmidt, C. R. Allton, S. Ejiri, S. J. Hands, O. Kaczmarek, F. Karsch and E. Laermann, Nucl. Phys. Proc. Suppl. 119, 517 (2003) [arXiv:hep-lat/0209009].
- (6) C. Schmidt, F. Karsch and E. Laermann, Nucl. Phys. Proc. Suppl. 106, 423 (2002) [arXiv:hep-lat/0110039].
- (7) S. A. Gottlieb, W. Liu, D. Toussaint, R. L. Renken and R. L. Sugar, Phys. Rev. D 35, 2531 (1987).
- (8) http://physics.utah.edu/detar/milc/
- (9) M. D’Elia and M. P. Lombardo, Phys. Rev. D 67, 014505 (2003) [arXiv:hep-lat/0209146].
- (10) P. de Forcrand and O. Philipsen, JHEP 0701, 077 (2007) [arXiv:hep-lat/0607017].