Spectral Analysis of Excited Nucleons in Lattice QCD with Maximum Entropy Method
Abstract
We study the mass spectra of excited baryons with the use of the lattice QCD simulations. We focus our attention on the problem of the level ordering between the positive-parity excited state (the Roper resonance) and the negative-parity excited state . Nearly perfect parity projection is accomplished by combining the quark propagators with periodic and anti-periodic boundary conditions in the temporal direction. Then we extract the spectral functions from the lattice data by utilizing the maximum entropy method. We observe that the masses of the and states are close for wide range of the quark masses ( GeV) and for the physical point after the extrapolation in terms of the quark mass. The latter aspect is in contrast to the phenomenological prediction of the phenomenological quark models. The role of the Wilson doublers in the baryonic spectral functions is also studied.
, , ,
1 Introduction
The lattice QCD simulations have been shown to be a powerful tool to study the properties of hadrons from first principle. In particular, ground state hadron masses in the quenched approximation agree with the experimental values in 10% accuracy [1]. Furthermore unquenching of the dynamical quarks tends to improve the agreement [2]. On the other hand, studies of the excited hadrons are still in an exploratory stage in spite of their physical importance. (For a brief review, see [3] and references therein.)
In this paper, from the quenched lattice QCD simulations with Wilson fermions, we study excited nucleons with a special focus on the spectrum in the positive-parity channel (the Roper resonance) and that in the negative-parity channel .
The fact that the mass of the is smaller than that of the has been a long standing puzzle: Indeed, phenomenological quark models predict that because while and or [4]. As possible resolutions of this puzzle, exotic descriptions of the state and/or the state have been proposed such as the chiral quartet scheme [5] and the pentaquark picture [6] as well as the quark model with the effective flavor-spin interaction [7].
In principle, the lattice QCD simulation ought to give the final answer to this problem. However, definite conclusions have not been drawn yet even in the quenched lattice QCD studies because of several technical reasons: First of all, one needs to make appropriate projection and isolation of the excited states to differentiate the , and states. Furthermore, lattice artifact due to finite lattice volume becomes severer for the excited states than the ground state [8, 9].
To overcome these problems, (i) we adopt a technique to combine the quark propagators with periodic and anti-periodic boundary conditions in time for precise parity projection [10], (ii) we employ the maximum entropy method (MEM) [11, 8] for extracting the excited mass spectra, and (iii) we utilize a larger spatial size ( fm) with the lattice spacing fm ().
Our main conclusion is that and states are nearly degenerate within statistical errors in the wide range of the quark mass ( GeV). We found that, after the chiral extrapolation with an empirical “curve fit” formula, the masses of the and states are consistent with the approximate degeneracy observed in experiment. Also, we found a firm evidence of high-lying bound states composed of Wilson doublers.
This paper is organized as follows. In Section 2, we provide a brief introduction to the parity projection and MEM. After summarizing our simulation parameters in Section 3, we discuss the numerical results obtained from the MEM analysis of the spectral function in Section 4. The bound states of Wilson doublers which appear as high energy peaks in the spectral function are discussed in Section 5. A brief comparison with previous studies is given in Section 6. Section 7 is devoted to summary and concluding remarks.
2 Parity projection and MEM
The nucleon is described by the trilinear quark composite operator given by
| (1) |
which is composed of a local scalar-diquark operator and a spectator-like quark field. This local composite operator couples to both positive and negative parity states [12, 10]. The asymptotic form of the zero-momentum nucleon correlation, , may be expressed in finite temporal extent, , as
| (2) | |||||
with . The coefficient is for the periodic (anti-periodic) boundary condition in the temporal direction. is the ground state mass of the positive (negative) parity nucleon. The second and forth terms on the right hand side of Eq.(2) appear since the nucleon is a composite particle. Due to the presence of the third and forth terms corresponding to the primal reflections from the time boundary, the naive projection is insufficient to extract a contribution of the desired parity state. 111 The most primitive prescription to avoid the contamination from the opposite parity states is to analyze the data only up to about . A solution to this problem is to realize the free-boundary situation (), which can be achieved by using a linear combination of the quark propagators with periodic and anti-periodic boundary conditions in time [9, 10]. The linear combination in the quark level automatically fulfills the linear combination in the hadronic level and then manages the free-boundary situation up to the first wrap-round effect [9]. Adopting this procedure, one can project out the desired parity state by accurately without the contamination from the opposite parity state.
The baryonic correlation with the above parity projection has a spectral representation,
| (3) |
where is the Laplace integral kernel. The spectral function (SPF), , carries all the information of the hadronic states (both ground and excited states). The discretized version of Eq. (3) reads : We need values of for sufficient number of frequencies , typically of . The Monte Carlo data is, however, available only at some dozens of time slices on the lattice. This is a typical ill-posed problem, where the number of equations is much smaller than the number of unknown quantities. The maximum entropy method (MEM) introduced in Ref. [11] enables us to determine SPF uniquely by supplementing the lattice data with prior knowledge such as the positivity and the asymptotic behavior of SPF.
The conditional probability of given the Monte Carlo data and the prior knowledge is given by which is evaluated by using the Bayes’ theorem as
| (4) |
Here is the standard likelihood function and is given by the Shannon-Jaynes entropy:
| (5) |
Given , and , the most probably is obtained by the stationary condition, , which has a unique solution if it exists [11]. Also, the reliability of the solution can be tested by the second variation, . We have ( for meson (baryon)) in Eq.(5): This is called the default model in which the parameter may be fixed either by the perturbative asymptotic behavior of SPF at large , or by demanding that the resultant has smallest error bar. By evaluating the probability using the Bayes’ theorem, final form of the spectral function is obtained by averaging over with the weight factor . For more details on MEM techniques, see Ref. [11].
3 Simulation parameters
| (fm) | (fm) | hopping parameter | |||
|---|---|---|---|---|---|
| 5.8 | 0.136 | 3.3 | 0.1600, 0.1570, 0.1555, 0.1540, 0.1530 | 200 | |
| 6.0 | 0.093 | 1.5 | 0.1550, 0.1530, 0.1515 | 580 | |
| 0.093 | 3.0 | 0.1550, 0.1530, 0.1515, 0.1500 | 200 |
We have performed simulations in quenched QCD with the single plaquette gauge action and the Wilson fermion action. We utilized the Metropolis algorithm with 20 hits at each link update. The gauge ensembles in each simulation are separated by 1000 sweeps for , and 600 sweeps for . For the matrix inversion, we used BiCGStab algorithm [13] with the convergence condition for residues. We calculate the point-to-point nucleon propagator constructed by the point-to-point quark propagator so that the spectral function is assured to be positive semi-definite. Our calculation has been performed on a Hitachi SR8000 parallel computer at KEK (High Energy Accelerator Research Organization), using the extended code based on the Lattice Tool Kit (LTK)[14].
Our simulation parameters are listed in Table 1. Physical scale is set by the Sommer parameter fm [15]. Our main conclusion will be drawn from the data taken on the finest and largest lattice ( and ) in the Table 2. The case with coarser lattice spacing ( and ) is also studied to analyze the nature of the high-lying peaks of the spectral function associated with the Wilson doublers. A supplementary data with a smaller lattice size ( with ) are also taken to check the effect of finite lattice size on the excited nucleon spectrum. For each data, several hopping parameters are used to cover the range GeV.
4 and the Roper resonance
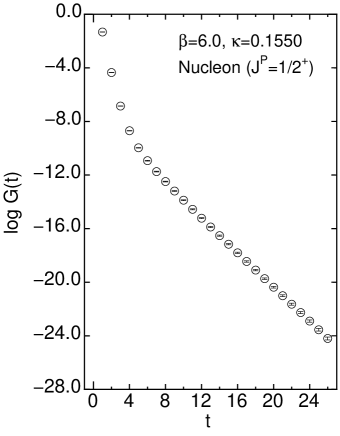
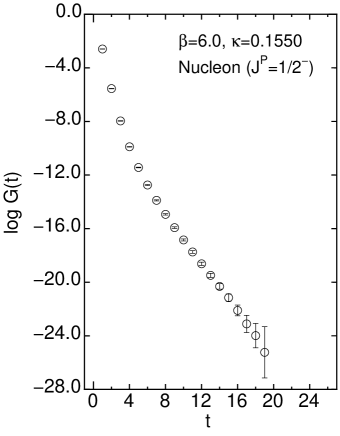


In Fig.1, we have shown examples of the correlation functions in the positive parity and negative channels for ( fm), ( GeV) and ( fm). Fig.2 show the dimensionless spectral functions, , obtained from the MEM analysis of in Fig.1. The default model in the MEM analysis for the nucleon channel is chosen to be about , which is deduced from the asymptotic form of the SPF at the one-loop level in the perturbative QCD in the continuum [8]. We have check that the final results are insensitive to the choice of around this value. The temporal interval of the Monte Carlo data , used in the MEM analysis, is chosen to be . Exceptions are for the negative-parity nucleon with light quark masses () in which is used because of the noisy signals for . Note that corresponds to a source location and is excluded in the analysis. It is worth mentioning that sufficiently large statistics makes the reconstructed image of SPF stable against variation of beyond some critical point around . In our MEM analysis, we have chosen the region, , to cover all the relevant states available on our lattice. We have carefully checked that changing the lower (upper) limit of to smaller (larger) values have no effect on the finial results.
The crossbars attached to the SPFs in Fig.2 are attached with the procedure given in [11]. First of all, we arbitrarily choose an interval in the frequency space so that it covers one of the peaks in SPF. The horizontal bar in the figure represent this interval and is not at all related to the uncertainly of the peak position. After setting the interval, the uncertainty of the peak height averaged over the interval can be calculated from the second variation of with respect to . The vertical bar in the figure represents error of such averaged peak height. Fig.2 shows that the peaks are statistically significant except for the marginal second peak in the lower panel. We identify the first (second) peak of the upper panel in the figure as (), and the first peak in the lower panel as .
Carrying out the MEM analysis in the meson and baryon channels for different values of and identifying the positions of low-lying peaks, we extracted the hadron masses as summarized in Table 2. The statistical errors in the parentheses are evaluated by the jack-knife method. Critical hopping parameter at which the pion mass vanishes reads for . Our simulations are done for quark masses which are not very close to the chiral limit so that a guidance by the chiral perturbation theory is no longer useful for the extrapolation of hadron masses down to the physical point. Furthermore, the leading chiral behavior of the excited baryon masses is not known at present. In this situation, adopting a simple formula, which can describe the observed dependence of the quark mass well, is a reasonable choice to make the chiral extrapolation. In this paper, we utilize the “curve fit”;
| (6) |
which does not include a term linear in , which is responsible for the leading chiral behavior for the nucleon in quenched chiral perturbation theory [16]. As reported in Refs. [17, 9], Eq.(6) gives a better fit to the data in the heavy-quark region than the linear fit. Note that we have not made exhaustive study on the chiral extrapolation in this paper, since the systematic errors stemming from the finite-size effect is more significant than those from the chiral extrapolation.
| 0 | 0.318(15) | 0.464(21) | 0.76(16) | 0.689(102) | |
| 0.1550 | 0.288(14) | 0.422(13) | 0.635(14) | 0.92(13) | 0.843(68) |
| 0.1530 | 0.420(7) | 0.505(4) | 0.791(9) | 1.09(8) | 1.030(56) |
| 0.1515 | 0.502(3) | 0.568(3) | 0.898(7) | 1.20(6) | 1.143(50) |
| 0.1500 | 0.578(2) | 0.630(5) | 1.000(6) | 1.31(6) | 1.236(49) |
As for the ground state in each quantum number, one may compare the MEM result and the conventional single exponential fit using . Shown in Fig.3 are the comparisons of the masses of the (the ground state in the positive-parity nucleon) and the (ground state in the negative-parity nucleon) in two approaches: The circles represent the mass evaluated by the single exponential fit, while the squares represent the position of the first peak obtained by the MEM analysis. They are consistent with each other within the statistical error for the whole range of the quark masses.


Let us consider the finite size effect on the peaks of the spectral functions. In Fig. 4, we compare the SPFs on a larger lattice ( fm) shown by the solid lines with those on a smaller lattice ( fm) shown by the dashed lines. Although the position of the (the first peak in the upper panel) has a minor shift, the positions of the (the second peak in the upper panel) and the (the first peak in the lower panel) have significant upward shifts as we decrease the lattice volume. This is consistent with an intuitive observation that the size of excited hadron is larger than that of the ground state and thus receives a large finite volume effect. Detailed analysis on the finite size effect on the and the by two of the present authors shows that the spatial size of about 3 fm is necessary to obtain reliable results even for relatively heavy quark masses ( GeV) [9]. With these observations, we will use the data for fm in this paper for final results.
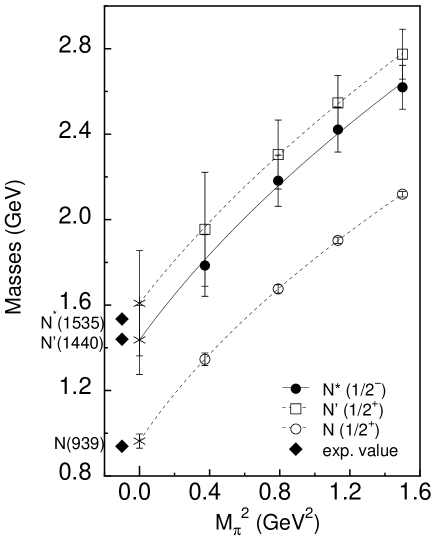
Now, we compare the position of the Roper resonance () and the negative parity nucleon (). Plotted in Fig. 5 are the masses of these resonances as well as the nucleon mass as a function of the pion mass squared in the physical unit. All the points are evaluated by the MEM analysis. The chiral extrapolations with the curve fit are also shown together with the experimental values. We find that the and states are almost degenerate within statistical errors in a wide range of quark masses, GeV, although the central values of the is slightly higher than the in this interval. In the chiral limit, we have the following mass ratios:
| (7) |
Our result here is in contrast to what is expected in the phenomenological quark models as mentioned in the Introduction, but is consistent with the experimental value. To make a firm conclusion on the precise level ordering between the and states, we need to increase the number of gauge configurations to reduce the statistical errors and also need to make simulations with smaller quark masses.
In relation to the physics in the vicinity of the chiral limit, we comment on the quenched artifact due to the ghost state in the nucleon correlator. It is pointed out in [18] that this ghost state affects the nucleon correlator significantly for GeV. If such effect is significant, the spectral function becomes negative and the standard MEM analysis assuming the positivity of the SPF is invalidated. In the present study, however, simulations are performed in the region GeV, and we have checked explicitly that the threshold is higher than the masses of the , and states in the this interval.
5 Bound state of doublers
In this section, we discuss the high-lying peaks of the SPF which could be the bound states containing Wilson doublers. This possibility was first pointed out by CP-PACS collaboration for the meson spectra [19]. Since the mass of the Wilson doublers is inversely proportional to the lattice spacing , studying the peak positions of SPF as a function of provides us with a useful information on the doubler bound states.


Shown in the left panel of Fig. 6 are the SPFs in the positive parity nucleon channel for GeV with (upper figure) and (lower figure). The lattice volume is taken to be fm. The MEM analysis is performed with for and 20 for . These values of are chosen so that the resulting images of SPF are stable enough. The number of configurations in both cases is .
Consider the two high-lying peaks whose positions in terms of are almost independent of the lattice spacing . Insensitivity of the peak positions in terms of is already an indication that they contain Wilson doublers, the pole mass of a free Wilson doubler is given by with being an integer. The bare quark-mass is defined by . Note that baryons at rest composed of Wilson doublers need to contain two doublers to satisfy the momentum conservation. Then one may write a simple mass formula for two high-lying peaks as
| (8) |
where corresponds to a binding energy between the two doublers and a physical quark. As far as , depends only weakly on the bare quark-mass .
In the right panel of Fig. 6, the positions of the highest two peaks for are plotted as a function of the bare quark-mass, . Results of fitting the data by Eq.(8) are shown by the dotted lines. We find that the mass formula reproduces the positions and the dependence of the highest two peaks well. As a result of this quantitative analysis, it is quite likely that the highest two peaks are the bound states containing Wilson doublers which eventually decouple from the physical spectrum in the continuum limit, .
It is worth mentioning that any prominent structure of SPF in the higher frequency region () is not found in the 4-dimensional model [20] and the 3-dimensional four-fermion model with staggered fermions [21]. These observations support that our observed high-lying peaks far beyond cutoff scale are associated with Wilson doublers.
6 Comparison to other approaches
| fermion | (GeV) | (GeV) | (fm) | B.C. | method (Ref.) |
|---|---|---|---|---|---|
| DWF | 2.1 | 1.5 | P+AP | correlator [10] | |
| clover | 2.9 | 1.6 | P | modified correlator [22] | |
| CID | 1.3 | 1.8 | AP | correlator [23] | |
| overlap | 1.0 | 2.4, 3.2 | AP | CCF [18] | |
| Wilson | 2.1 | 1.5, 3.0 | P+AP | MEM (this work) |
In this section, we briefly make a comparison among different approaches applied to analyze the excited nucleons. (See Table 3.) The methods to extract the excited spectra may be classified into three categories: (i) Diagonalization method using correlation matrix [10, 23], (ii) Subtraction method using modified correlator [22] and (iii) Bayesian methods such as the maximum entropy method ([8] and the present work) and the constrained curve fitting (CCF) [18].
In (i), one starts with the correlation matrix, , and solve the generalized eigenvalue problem where is fixed and . The -th largest eigenvalue of the transfer matrix may be given by with appropriate choices of and [24]. In Ref. [10], an unconventional operator, is utilized to construct the correlation matrix in addition to the conventional one as Eq.(1). On the other hand, in Ref. [23], they build up the correlation matrix with four operators, which correspond to four possible combinations to construct the nucleon operator from two sets of the smeared quark propagator. In (ii), a modified correlator, , is investigated instead of the original correlator , so that the sum of the first two states, , governs the leading-exponential decay of the modified correlator as [22]. In (iii), prior knowledge of the correlator is considered in addition to the Monte Carlo data. In MEM [11], the prior knowledge is introduced in the entropic form, while in CCF, it is introduced in the gaussian form [25].
In Refs.[10, 23, 22] (the first three works in Table 3), degeneracy between the and states has not been observed within the range of the quark masses where simulations are performed. On the other hand, in Ref.[18] and the present work (the last two works in Table 3), an approximate degeneracy of the and the are seen within the statistical errors, although it is not yet clear where and how the level switching between the and states really takes place as a function of the quark mass in our study. One of the major differences between the first three works and the last two works is the spatial lattice size.
As we have discussed in Section 4 and will be reported in detail in a separate publication [26], our simulation with a smaller lattice (fm) show that there is a sizable upward shift especially in the channel for and GeV. This lattice artifact increases the difference even for rather heavy quarks and may partly explain the reason why degeneracy have not seen in first three works.
7 Conclusion
In this article, we have studied the mass spectra of excited nucleons in the quenched lattice QCD simulations. We have focused our attention on the level ordering between (the nucleon excited state in the positive-parity channel) and (the nucleon excited state in the negative-parity channel) which has been a long standing puzzle. Indeed, it is difficult to be explained by phenomenological quark models in which the Roper resonance has much higher mass than the .
To attach the problem with a firm footing, we have utilized a technique to combine quark propagators with periodic and anti-periodic boundary conditions in time to eliminate the contamination of the opposite parity states in the baryonic correlator up to the first wrap-round effect. Also, we have used the maximum entropy method (MEM) to reconstruct the spectral function which contains not only the information of the ground state but also that of the excited states. Since the finite size effect is shown to be severe for excited nucleons [9], we have taken a large lattice size ( fm with ).
With all the above, we have extracted the masses of the , and states for GeV, which are summarized in Fig.5. Our results show that the masses of the and states are approximately degenerate within statistical errors for wide range of quark masses, although the central value of the is slightly higher than the . This tendency is valid also at the physical point after making chiral extrapolation with a curve fit, Eq.(7). The latter result is in contrast to the predictions of the phenomenological quark models but is consistent with similar finding in Ref. [18] which employs different lattice action and different way of data analysis. Whether level switching between the and states takes place at certain quark mass is an open question left for future studies. We have also studied the high-lying peaks of the SPF by carrying out simulations on a coarse lattice () with approximately the same lattice volume. From the analysis of the -dependence and the quark-mass dependence of these peaks, we found a firm evidence that the high-lying peaks correspond to the bound states composed of two Wilson doublers and one normal quark.
There are various directions to be explored in future studies: To increase the statistics to pin down the precise location of the level switching; To generalize the MEM to treat the negative SPF originating from the ghost state; To make systematic studies of the other excited baryons and mesons. The nucleon excited states at finite temperature are also interesting to be studied in connection with realization of chiral symmetry in baryons [27]. The MEM analysis also may be helpful to disentangle the pentaquark signal from a tower of the scattering states [28].
Acknowledgments
It is a pleasure to acknowledge A. Nakamura and C. Nonaka for helping us develop codes for our lattice QCD simulations from their open source codes (Lattice Tool Kit [14]). This work is supported by the Supercomputer Projects No.102 (FY2003) and No.110 (FY2004) of High Energy Accelerator Research Organization (KEK). T.H. and S.S. thank for the support by Grants-in-Aid of the Japanese Ministry of Education, Culture, Sports, Science and Technology (No.15540254 and No.15740137).
References
- [1] S. Aoki et al. [CP-PACS Collaboration], Phys. Rev. D 67, 034503 (2003).
- [2] T. Ishikawa et al. [CP-PACS Collaboration], Nucl. Phys. Proc. Suppl. 140, 225 (2005).
-
[3]
S. Sasaki,
Prog. Theor. Phys. Suppl. 151, 143 (2003).
G. S. Bali, arXiv:nucl-th/0502046.
D. B. Leinweber, W. Melnitchouk, D. G. Richards, A. G. Williams and J. M. Zanotti, arXiv:nucl-th/0406032. - [4] S. Capstick and W. Roberts, Prog. Part. Nucl. Phys. 45, S241 (2000).
- [5] D. Jido, T. Hatsuda and T. Kunihiro, Phys. Rev. Lett. 84, 3252 (2000).
- [6] R. L. Jaffe and F. Wilczek, Phys. Rev. Lett. 91, 232003 (2003).
- [7] L. Y. Glozman and D. O. Riska, Phys. Rept. 268, 263 (1996).
- [8] S. Sasaki, K. Sasaki, T. Hatsuda and M. Asakawa, Nucl. Phys. Proc. Suppl. 119, 302 (2003); ibid. 129, 212 (2004).
- [9] K. Sasaki and S. Sasaki, arXiv:hep-lat/0503026.
- [10] S. Sasaki, T. Blum and S. Ohta, Phys. Rev. D 65, 074503 (2002).
-
[11]
Y. Nakahara, M. Asakawa and T. Hatsuda,
Phys. Rev. D 60, 091503 (1999).
M. Asakawa, T. Hatsuda and Y. Nakahara, Prog. Part. Nucl. Phys. 46, 459 (2001). - [12] F. Fucito, G. Martinelli, C. Omero, G. Parisi, R. Petronzio and F. Rapuano, B 210, 407 (1982).
- [13] A. Frommer, V. Hannemann, B. Nockel, T. Lippert and K. Schilling, Int. J. Mod. Phys. C 5, 1073 (1994).
- [14] S. Choe, S. Muroya, A. Nakamura, C. Nonaka, T. Saito and F. Shoji, Nucl. Phys. Proc. Suppl. 106, 1037 (2002).
-
[15]
M. Guagnelli, R. Sommer and H. Wittig Nucl. Phys. B 535, 389 (1998).
S. Necco and R. Sommer, Nucl. Phys. B 622, 328 (2002). - [16] J. N. Labrenz and S. R. Sharpe, Phys. Rev. D 54, 4595 (1996).
- [17] M. Göckeler, R. Horsley, D. Pleiter, P. E. L. Rakow, G. Schierholz, C. M. Maynard and D. G. Richards, Phys. Lett. B 532, 63 (2002).
- [18] N. Mathur et al., Phys. Lett. B 605, 137 (2005).
- [19] T. Yamazaki et al. [CP-PACS Collaboration], Phys. Rev. D 65, 014501 (2002).
- [20] T. Yamazaki and N. Ishizuka, Phys. Rev. D 67, 077503 (2003).
- [21] R. Allton, J. E. Clowser, S. J. Hands, J. B. Kogut and C. G. Strouthos, Phys. Rev. D 66, 094511 (2002).
- [22] D. Guadagnoli, M. Papinutto and S. Simula, Phys. Lett. B 604, 74 (2004).
- [23] T. Burch, C. Gattringer, L. Y. Glozman, R. Kleindl, C. B. Lang and A. Schaefer, Phys. Rev. D 70, 054502 (2004).
- [24] M. Lüscher and U. Wolff, Nucl. Phys. B 339, 222 (1990).
- [25] G. P. Lepage, et al., Nucl. Phys. Proc. Suppl. 106, 12 (2002).
- [26] K. Sasaki, S. Sasaki and T. Hatsuda, in preparation.
-
[27]
C. DeTar and T. Kunihiro,
Phys. Rev. D 39, 2805 (1989).
A. Hosaka, D. Jido and M. Oka, Prog. Theor. Phys. Suppl. 149, 203 (2003). - [28] S. Sasaki, Phys. Rev. Lett. 93, 152001 (2004); Nucl. Phys. Proc. Suppl. 140, 127 (2005).