BNL-NT-04/32
QCD Thermodynamics on lattice
Abstract
I discuss recent developments in lattice QCD thermodynamics on the nature of the transition at finite temperature and density, equation of state, screening of static charges and meson spectral functions at high temperatures.
1 Introduction
It is expected that strongly interacting matter shows qualitatively new behavior at temperatures and/or densities which are comparable or larger than the typical hadronic scale. It has been argued by Hagedorn that production of hadronic resonances may lead to a limiting temperature above which hadronic matter can no longer exist [1]. The corresponding temperature can be estimated to be [2]. On the basis of asymptotic freedom one would expect that dominant degrees of freedom at very high temperature and/or densities are quarks and gluons which are no longer subject to confinement [3]. Such qualitatively different behavior of usual hadronic matter with confinement and chiral symmetry breaking and this new state of matter (usually called Quark Gluon Plasma) would suggest a phase transition at some temperature. The existence of such phase transition was first shown in the strong coupling limit of QCD [4], followed by numerical Monte-Carlo studies of lattice SU(2) gauge theory which confirmed it [5].
Since these pioneering studies QCD at finite temperature became quite a large subfield of lattice QCD (for recent reviews on the subject see Refs. [6, 7, 8]). One of the obvious reasons for this is that phase transitions can be studied only non-perturbatively. But even at high temperatures the physics is non-perturbative beyond the length scales ( being the gauge coupling) [9]. Therefore lattice QCD remains the only tool for theoretical understanding of the properties of strongly interacting matter under extreme condition which is important for the physics of the early universe and heavy ion collisions. In this review I will discuss recent developments on studies of the QCD phase transition at finite temperature and density, equation of state, the problem of in-medium modifications of inter-quark forces and meson spectral functions.
2 QCD transition at finite temperature
One of the basic questions we are interested in is what is the nature of the transition to the new phase or if there is one at all, what is the temperature where it happens 111I will talk about QCD finite temperature transition irrespective whether it is a true phase transition or a crossover and will always refer to the corresponding temperature. and what is the equation of state. In addition one may wonder what drives the transition in QCD, which I will discuss in section 5.
In the case of QCD without dynamical quarks, i.e. SU(3) gauge theory most of these questions have been answered. It is well established that the phase transition is 1st order [10]. Using standard and improved actions the corresponding transition temperature was estimated to be or [7] (assuming for the string tension). RG-improved actions gave similar estimates for [11]. When is expressed in units of the Sommer scale comparison between different action can be done in a quite transparent way and gives [12]. The equation of state of SU(3) gauge theory were also extrapolated to the continuum limit [13, 14].
The situation for QCD with dynamical quarks is much more difficult. Not only because the inclusion of dynamical quarks increases the computational costs by at least two orders of magnitude but also because the transition is very sensitive to the quark masses. Conventional lattice fermion formulations break global symmetries of continuum QCD (e.g. staggered fermion violate the flavor symmetry) which also introduces additional complications.
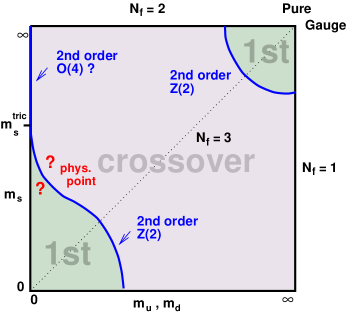
Since simulations at the physical value of the quark masses are extremely expensive one usually studies the QCD phase diagram on the mass plane of u,d and s-quarks. This is schematically shown in Fig. 1. As mentioned before for infinitely heavy quarks there is a deconfinement transition which is well known to be 1st order. The 1st order nature of the transition persists for finite values of the quark masses and terminates with a critical line which belongs to universality class at quark masses corresponding to pseudo-scalar meson mass of about [15]. For the case of three flavors of light quarks universality arguments suggest a 1st order chiral transition which was indeed observed in lattice simulations with both standard and improved (p4) staggered fermion actions [16, 17]. The region of the 1st order transition ends at some critical line which belongs to universality class [16, 17]. Note, however, that standard and improved fermions give different estimates for the value of quark (pion) mass where the 1st order region ends, for standard action [17] and for p4 action [16]. The transition temperature in the chiral limit for was estimated to be [18].
For two massless flavors one expects a 2nd order transition with universality class. Simulations with staggered fermions (both standard and improved) did not confirm this expectations. On contrary a recent analysis with standard staggered action on large lattices suggests that transition maybe weakly 1st order [19]. On the other hand simulations with Wilson fermions show finite size scaling consistent with exponents [20]. Despite these disagreements the chiral critical temperature for two flavor QCD turns out to be consistent for Wilson and staggered formulations: for Wilson fermions one has [20], while for improved staggered (p4) [18] ( both refer to lattice). First attempts to study the finite temperature transition in two flavor QCD with chiral fermions which have all the symmetries of continuum QCD have been done in Ref. [21].
The most interesting question is about the nature of the transition in the physical case of two light and one heavier quarks and where the physical point in Fig. 1 is located. Simulations for this case have been performed using standard [22, 23] and improved staggered formulations [24, 25, 26, 27]. The most recent calculations with standard staggered fermions were performed on lattices and quark masses very close to physical ones corresponding to the lightest pion mass of about ( ). Calculations with improved staggered (Asqtad) action were done using three different lattice spacings () and several quark masses, with lightest quark mass being only 2.5 times heavier than the physical value. Both studies have found no evidence for a true phase transition but only a crossover. The crossover temperature was estimated to be (the errors is only statistical and was assumed) for standard staggered action [23] and for Asqtad [25]. The later is an extrapolated value. The continuum and chiral extrapolation was done with Ansatz with motivated by scaling. The coefficient turns out to be quite small as expected; in Asqtad action the anomalously large corrections are removed. The second error is the estimate of is the uncertainty in the scale (lattice spacing) [25]. If expressed in units of the Sommer scale both standard action and Asqtad action give a consistent estimate for . When using the most recent value [28] and rescaling the results one gets the value for the standard action.
It seems that different fermion actions give very similar estimate for the transition temperature, which interestingly enough appears to be very close to the old prediction from the resonance gas model. Why are there so large discrepancies concerning the order of the phase transition? As mentioned before staggered fermions violate the flavor symmetry. This results in the fact that there is only one Goldstone pion, the other pions remain massive in the chiral limit for any finite lattice spacing. For typical lattice spacings used in thermodynamic studies () the splitting between Goldstone and non-Goldstone pions can be quite large, so the lightest non-Goldstone pion turns out to be heavier than the kaon. Clearly it is important to improve the flavor symmetry of staggered fermions when one wants to make statement about the nature of the transition at the physical point. This is usually done by introducing fat links in the fermion hopping term (see e.g. Refs. [18, 24]) . Typically the fat links which are used are the sum of a single link and staples and are not elements of the SU(3) group. In staggered HYP action the fat links are elements of SU(3) gauge group [29]. It has been shown that projecting the fat links onto SU(3) group substantially improves the flavor symmetry [29]. Finite temperature simulations with HYP actions gave a number of interesting results [29]. For QCD with four light flavors using standard staggered action the transition was found to be first order in accord with universality arguments [30, 31]. The only problem is that the critical quark mass where the transition turns into crossover was found to be strongly dependent on the lattice spacing [31], it decreases by more than a factor of three when going from to . In Ref. [32] it was found that introducing unprojected fat links make the transition weaker, while with the use of HYP smeared fat links the first order transition is washed out completely. In fact for HYP action, no first order transition was observed even for very small quark masses both for and lattices [32]. There are also simulations with HYP action at in flavor as well as at and in flavor QCD which indicate that the crossover is much smoother than for standard staggered action for the same quark mass and same lattice spacing [33, 34]. Can improvement of flavor symmetry in the staggered fermion action smoothen the transition and eventually wash out any phase transition for the quark masses where standard action predict a phase transition? In this respect it is interesting to study the smoothness (sharpness) of the crossover as function of the lattice spacing. Typically susceptibilities of order parameter like quantities, e.g. chiral condensate , show a pronounced peak for a rapid crossover. For a true phase transition the height of the peak diverges in the thermodynamic limit, while for a crossover it approaches a finite value. The MILC collaboration has calculated the susceptibility of the chiral condensate for three flavor QCD at three different lattice spacings [24, 25, 26, 27]. The results are shown in Fig. 2. One can see a pronounced peak for , however, the peak height relative to the low temperature value of the chiral susceptibility decreases with increasing . This means that as the flavor symmetry gets restored by going to finer lattices (smaller ) the crossover becomes smoother. Note that the chiral susceptibility in Fig. 2 is given in lattice units. To convert to physical units, say units of the data should be multiplied by which will make the chiral susceptibility look very different for different .
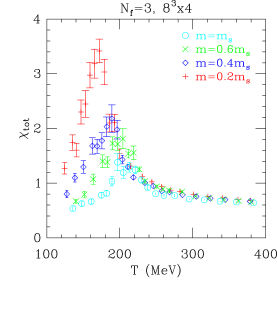
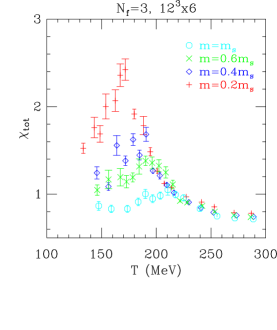
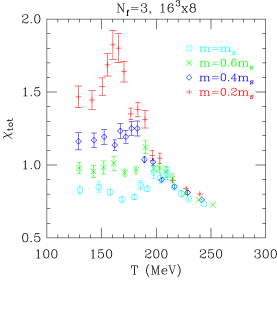
Thus it is likely that the first order transition observed so far with staggered action is just a lattice artifact.
3 Phase diagram at
For a long time there was no considerable progress in studying the phase diagram of QCD at finite chemical potential. This is because the complex fermion determinant makes importance sampling based simulations impossible. The multi-parameter re-weighting method by Fodor and Katz was a partial breakthrough which allowed to study the phase diagram of QCD also at finite chemical potential [35, 36]. Soon after also other methods based on Taylor expansion around [37, 38] and analytic continuation to imaginary chemical potential [39, 40, 41] were suggested. All three methods were discussed in detail by S. Katz at Lattice 2003. Therefore I will emphasize mostly the most recent results leaving technical details aside.
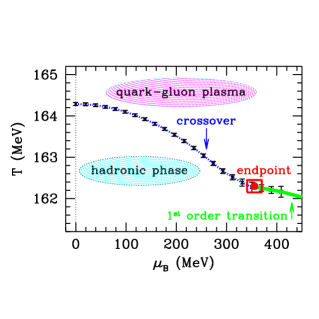
In the previous section we have seen that all available lattice data suggest that there is no phase transition in real QCD but only a smooth crossover. In this case a very interesting phase diagram in the plane of temperature and chemical potential has been conjectured. At large chemical potential a 1st order transition is expected and thus if there is a crossover at the phase transition line should end at some critical point . The important question is whether we can locate this end-point on the lattice. The first attempt has been made by Fodor and Katz using multi-parameter re-weighting [36]. At each value of the pseudo-critical point in the gauge coupling was located using Lee-Yang zeros, zeros of the partition function for complex which are closest to the real axis. In the crossover region Lee-Yang zeros have non-vanishing imaginary parts in the thermodynamic limit. For a true phase transition, on the other hand, the imaginary part of Lee-Yang zeroes vanishes in the infinite volume limit. Thus inspecting the finite size scaling of the imaginary part of Lee Yang zeros one can determine whether there is a phase transition and eventually determine its order; the real part of Lee-Yang zero gives the location of the critical (or equivalently the temperature). Using this procedure with standard staggered action, quark masses about three times larger than the physical one and lattices they estimated the location of the critical end-point at [36] (note that the baryon chemical potential with being the quark chemical potential). Very recently they extended their studies by including larger lattice volumes and values of the quark masses very close to the physical ones [23]. The result of their new analysis is summarized in Fig. 3. The endpoint was found to be located located at . It is evident that the end-point is very sensitive to quark mass. Calculations using the method of analytic continuation in 2+1 flavor QCD [39] with the same quark masses as used in Ref.[36] give results which are in very good agreement with findings of Fodor and Katz for the position of the pseudo-critical line. There are also calculations based on Taylor expansion in 2 flavor QCD with somewhat heavier quark masses which gives qualitatively similar results. In the case of 3 flavor QCD using re-weighting with Taylor expansion the critical endpoint was estimated to be for [16].
4 Equation of state
Lattice calculations of the equation of state are difficult for at least two reasons. First, the calculation of the energy density and pressure needs subtraction of the zero temperature (vacuum) part. This makes computational expenses grow with lattice spacing as compared to growth for other quantities. The second reason is that the equation of state more than any other quantity is sensitive to high momentum modes and therefore to cut-off effects. Indeed calculations with standard staggered action as well as Wilson (clover) action show large dependence on the lattice spacing () [42, 43]. Using improved staggered fermions cut-off effects in thermodynamic quantities can be greatly reduced [44]. In Ref. [45] pressure and energy density have been calculated with p4 action for and different number of flavors and for quark masses corresponding to pseudo-scalar (pion) mass of about . When expressed in units of both pressure and energy density turn out to be much larger than in SU(3) gauge theory reflecting the presence of additional degrees of freedom (quarks). An interesting question is what is the energy density at the pseudo-critical point. Calculations with both Wilson and p4 staggered actions yield consistent estimates, [46], which is in turn not too sensitive to the quark mass and flavor. Assuming that this holds down to physical quark masses and taking the most recent value one can estimate the (pseudo)critical energy density to be .
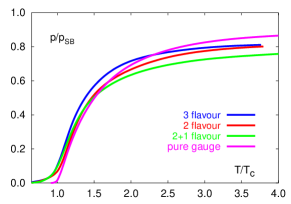
In Fig. 4 we show the pressure normalized by continuum Stefan-Boltzmann limit for different number of quark flavors. One can see almost no flavor dependence in for , i.e. the flavor dependence of the pressure in the high temperature phase can be well described by flavor dependence of . Note that the pure gauge result was extrapolated to the continuum limit. This means that if the approximate flavor independence is true the p4 action results at are already close to the continuum limit. Nonetheless one should keep in mind that the above calculations were done at fixed and not along the lines of constant physics. It has been shown in Ref. [47] that keeping fixed instead of keeping the quark mass constant in physical units can reduce the pressure by at .
Recently the pressure has also been calculated at non-zero chemical potential using both the Taylor expansion technique [38] and multi-parameter re-weighting [47]. More precisely one calculates the baryonic contribution to the pressure . The ratio , where is the ideal gas limit of , is almost independent of the chemical potential [38, 47]. This means that the dependence of the pressure on the chemical potential is well described by that of ideal quark-gluon plasma. Taylor expansion method with p4 action gives similar result [38] which will be discussed in the next section. Here we only note that despite the similar behavior of in the two methods there is a problem of cut-off dependence, in. Ref. [47] is calculated for lattice , while in Ref. [38] the continuum value for was used.
5 Comparison with the resonance gas model
The QCD transition has two aspects : deconfinement and chiral symmetry restoration. In absence of quarks in the fundamental representation an order parameter (the expectation value of the Polyakov loop) and a symmetry () can be linked to the deconfinement transition. In the more general case it is more meaningful to define the deconfinement transition as rapid increase of degrees of freedom. The chiral symmetry restoration is linked to the behavior of the chiral condensate and lightest hadrons with increasing temperature. The interconnection between chiral and deconfinement aspects of the QCD transition is subject to intensive discussion in the literature [48]. There are at least two question which can be addressed in this respect. Does the mass of the lightest excitation (e.g. pion) determines the value of the transition temperature? What drives the QCD transition? The answer to the first question is probably “no” and can be explained using several reasonings. First, if the mass of the lightest excitation determines the value of the transition temperature it would be difficult to understand why the transition temperature in the SU(3) gauge theory, where the lowest excitation is the scalar glueball of mass of about is only larger than the transition temperature in full QCD where pions of mass are the lowest excitations. Second in terms of functional integral the finite temperature system can be viewed as a zero temperature system in a slab of extension ( being the temperature). The non-perturbative features of the vacuum (causing confinement and chiral symmetry breaking) are obviously lost when the size of the slab becomes too small. There is no obvious connection between the “critical” size of the slab where the relevant non-perturbative features are lost and the mass of the lowest excitation 222I thank J. Kuti for bringing up this point..
In the following we are going to discuss the resonance gas model which provides an answer to both questions raised above in terms of physical degrees of freedom. Despite being a model it can explain many features of the available lattice data and can provide a standard reference for bulk thermodynamic properties in the low temperature phase similarly to the ideal quark-gluon plasma case ( Stefan-Boltzmann limit) which serves as a reference in the high temperature phase.
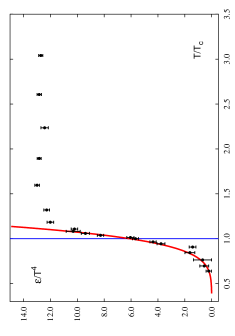
In the resonance gas model the partition function is a sum of one- particle partition functions of all mesons, baryons and their resonances [49]. In Fig. 5 I show the lattice data for the energy density (obtained with action) in comparison with the resonance gas model which includes about degrees of freedom corresponding to resonances with masses below . Since lattice calculations are done at unphysical quark masses the masses of experimentally know resonances have been extrapolated upward in quark mass to take this into account [49]. Note that pions contribute only to the energy density at the transition temperature [49]. As one can see the resonance gas model can described the lattice data very well till temperatures of about .
One immediate consequence of the resonance gas model is the factorization of the baryonic pressure
| (1) |
which holds as long [50]. On the lattice one can calculate the pressure at finite chemical potential in form of the Taylor expansion
| (2) |
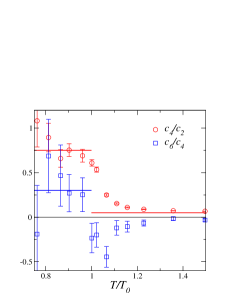
The factorization formula has important consequences for the baryonic pressure and its derivatives. The ratio of the baryonic pressure and its derivatives with respect to (quark number and quark number susceptibility) are function of only [50]. The ratios of the expansion coefficients in Eq. (2) are those of : , . These predictions can be compared with lattice data [51] as shown in Fig. 6. The figure clearly shows that the resonance gas model works quite well at low temperatures.
Now we can return to the question what drives the transition in QCD. The energy density at the pseudo-critical point can be estimated to be (see previous section). Assuming that this critical energy density is independent of the quark mass and number of flavors, as suggested by the existing lattice data, one can study the mass and flavor dependence of the transition temperature . This is shown in Fig. 7 which shows that the resonance gas at fixed energy density of seems to explain the quark (pion) mass dependence of as long as .
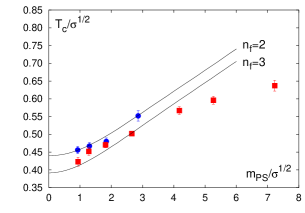
For larger pseudo-scalar masses the discrepancies can be explained by the fact that at such large quark mass glueball states become important. It has been shown that inclusion of glueball states with thermal mass reduction can account for this discrepancy [49].
Thus we see that deconfinement happens once the energy density reaches a value of about and does not depend strongly on the details of the spectrum but only on its exponential rise at large resonance masses. The fact that space gets (over)populated by hadron resonances near also means that there is little space left for the non-perturbative vacuum if one assumes a simple MIT-bag motivated picture where the vacuum inside a hadron is perturbative. This may lead to the decrease of the average value of chiral condensate. Also production of resonances increases the entropy, and the Polyakov loop, which can be related to the additional entropy generated by a static meson (see next section, for entropy increase due to adding an extra baryon into the system see [52] ), therefore rapidly increases near .
6 The free energy of static quarks
It is customary to study in-medium modification of inter-quark forces, e.g. screening in terms of the free energy of static quarks separated by some distance . Following McLerran and Svetitsky the partition function of the system with static quark anti-quark pair () normalized by the partition function of the system without static charges can be expressed as correlation function of temporal Wilson lines [53]
| (3) |
| (4) |
is usually referred to as Polyakov loop. Taking the logarithm of the above expression gives the free energy difference of the system with static quarks and without them at fixed temperature . Since the quark and anti-quark can be either in color singlet or color octet state one should separate those contributions using the appropriate projection operators which gives the following expressions for the singlet and octet free energies [54, 55]
| (5) | |||
| (6) |
One can define also the color average free energy which is the thermal averaged of the free energies in color singlet and octet channels [53, 55]
| (7) |
The normalization constant in the above equations will be defined below. The color averaged free energy is explicitly gauge invariant, while the others need gauge fixing or the Wilson line to be replaced by the gauge invariant Wilson line as this was done in Ref. [56]. The results to be presented here were obtained using the Coulomb gauge as in this gauge a transfer matrix can be defined and the free energies have a meaningful zero temperature limit. In fact it was shown that the Coulomb gauge and gauge invariant definition of the singlet free energy give numerically the same result [56].
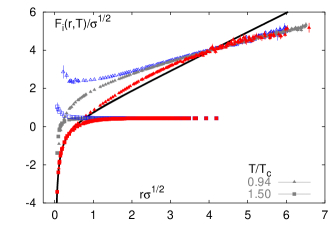
In Fig. 8 we show the singlet, octet and averaged free energies in gauge theory [57, 58, 59]. The normalization constant was chosen such that the singlet free energies coincides with the zero temperature potential at the shortest distance. Below the deconfinement temperature all free energies are linearly rising, indicating confinement. The string tension, however, is smaller than in the vacuum. Above deconfinement all the free energies approach the same constant value at asymptotic distances indicating the screening in plasma phase. Thus the free energies of static pair provide a true test of confinement. If this free energy is finite at infinite separation the system is deconfined and otherwise it is confined. Usually the expectation value of the Polyakov loop is considered to be an order parameter for deconfinement and it is said that it is related to the free energy of a static quark . This quantity, however, does not have a meaningful continuum limit; for any temperature it vanishes in the continuum limit. One can define a renormalized Polyakov loop as with being the asymptotic value of the free energy at infinite separation [57]. This provides an order parameter which is cutoff independent and has a well defined continuum limit [57].
While in the deconfined phase it is not difficult to accept the concept of the octet free energy, what it means in the confined phase is not quite clear. The construction in Eq. (6) fixes only the relative color orientation of static charges, e.g. being in octet state. In order for such object to exist in the confined phase the net color charge must be compensated by gluons. Such an object can be identified with excited state of the string or hybrid potential [60, 61]. In Ref. [62] the definitions of the singlet and octet free energies were applied in the zero temperature limit. It was found there that the definition of the octet free energy does not project onto the string excitation as expected. This is because the amplitudes in the spectral decomposition of the correlators have non-trivial -dependence [62]. At short distances where the -dependence of is likely to vanish and the octet free energy in (6) could give the hybrid potential.
Notice that at short distances the singlet free energy coincides with the zero temperature potential in a certain distance range and is temperature independent, reflecting the fact that medium effects are not important at short distances. This fact motivated our choice of the renormalization constant. To study the onset of medium effects and characterize the strength of interaction in the plasma it is convenient to introduce the effective running coupling constant [63] which is shown in Fig. 9.
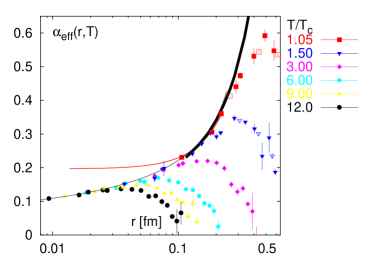
At short distances the scale which determines the running of the coupling constant is given by the distance and running follows the 3-loop beta function. At larger distances the fast running of the coupling constant mimics the presence of the linear term in Cornell parameterization of the zero temperature potential and therefore is of non-perturbative origin. It is interesting to note that this non-perturbative feature of the running coupling constant survives also in the deconfined phase as shown in Fig. 9. The effective running coupling starts to deviate from the zero temperature result at some distance and eventually decreases indicating the onset of medium effects and screening. The distance where it happens is obviously temperature dependent. Note that at distances where screening sets in, the singlet free energy does not have a simple screened Coulomb form expected in finite temperature perturbation theory. Only at somewhat larger distances the singlet free energy can be fitted by the form motivated by perturbation theory [63]. This defines then a coupling constant which depends on the temperature and not on the distance. In other words the running of the coupling at finite temperature is controlled by the distance for small and by the temperature for .

The results presented so far refer to gauge theory. Very recently the study of the static free energies was extended to two and three flavor QCD [64, 65, 66]. The results for the singlet free energy in 3 flavor QCD are shown in Fig. 10. As in the case of pure gauge theory at short distances the free energy is temperature independent and coincides with the zero temperature potential. However, the free energy reaches a constant value also at low temperatures, it flattens at distances of about . This is usually interpreted as string breaking.
The free energies of static quark anti-quark pairs are often called and interpreted as potentials. They have been used in potential models to predict the pattern on suppression [67]. However, one should be aware that in fact one deals with free energies which contain an entropy contribution. Having the partition function in the presence of static pairs one can also calculate the entropy and the internal energy difference between the system with and without static charges
| (8) |
| (9) |
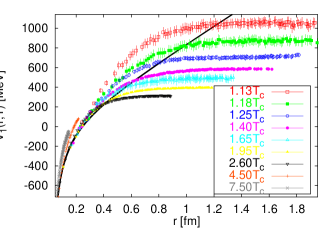
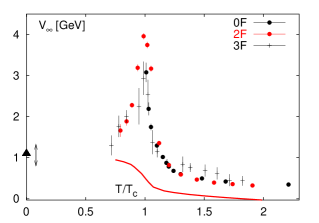
The free energy is decreasing with temperature (see e.g. Fig. 10). This implies that the entropy contribution is negative (c.f. equation above). In Fig. 12 we show the internal energy at different temperatures. It is obvious that the internal energy is larger than the free energy (compare with Fig. 8 ). If one would interpret the internal energy as potential it would lead to the conclusion that the remains bound till [68, 69]. One may wonder to which extent such interpretation is correct. In Fig. 11 we show the asymptotic value of the internal energy as function of the temperature. One can see a large increase of in the vicinity of the transition. Such large increase is difficult to interpret in terms of modification of inter-quark forces and it is probably due to many body effects.
7 Meson spectral functions
Lattice QCD can provide information about imaginary time correlation functions. On the other hand to make contact with observable quantities (e.g. masses and widths of hadron resonances in the medium) one should deal with correlators in real time
| (10) |
or equivalently the spectral function
| (11) |
For example the rate of emission of thermal dileptons can be expressed in terms of the spectral function of the correlator of the vector current [70].
| (12) |
Here we consider correlators of point meson operators , with for scalar, pseudo-scalar, vector and axial-vector channels. We will also restrict the discussion to the case of zero spatial momentum. The imaginary time correlator is an analytic continuation of the real time correlator . Using this and periodicity in the imaginary time (also known as Kubo-Martin-Schwinger condition) an integral representation for in terms of the spectral function can be derived
| (13) | |||||
| (14) |
This relation is valid in the continuum. It is not obvious that it holds also for the correlators calculated on the lattice. However, it was shown that an integral representation like in Eq. 14 can be also defined for the lattice correlator in the limit of the free field theory [71]. The only modification is that the upper integration limit becomes finite [71]. The cutoff dependence of the correlators is contained in the spectral function [71]. The obvious problem is that we have to reconstruct several hundred degrees of freedom (needed for a reasonable discretization of the integral in Eq. (14)). with data point on . This ill-posed problem can be solved using the Maximum Entropy Method (MEM) [72]. The method has been applied to study meson spectral functions at zero [72, 73, 74] as well as finite temperature [75, 76, 77, 78, 79, 80, 81].
The studies of meson spectral functions at zero temperature reproduced the properties of ground state mesons but on the other hand revealed structures (lattice artifacts) whose position scales like [73, 81, 74]. The cutoff effects in the meson spectral functions extracted from the interacting theory have little to do with those in the free theory.


First I will discuss finite temperature meson spectral functions for heavy quarks. This is of particular interest as it was suggested by Matsui and Satz that existence or non-existence of heavy quarkonia in the plasma reflects the screening properties of the plasma and can be used as signal for deconfinement and quark gluon plasma formation [82]. Different calculations based on screening and potential models have estimated that will dissolve around [67, 83]. Calculations of quakonium spectral function using MEM were performed only recently. Calculations have been done using anisotropic as well as fine isotropic lattices in quenched approximation [79, 80, 81]. Whatever approach is used several spatial lattice spacings are needed to check the cutoff dependence of the result. To demonstrate this in Fig. 13 we show charmonium spectral functions below deconfinement at two different lattice spacings from Ref. [81]. The pseudo-scalar and vector channels correspond to and states, while the scalar and axial-vector channels correspond to and states. One can see that while the ground state peaks reproduce the expected masses the positions of the other peaks scales roughly as , i.e. these peaks are lattice artifacts. Thus point operators can provide information only about the properties of the ground state for a given channel.
Now let me discuss what happens at finite temperature. In this case the reconstruction of the spectral function becomes more difficult as not only the number of available time-slices is reduced but also the extent of the imaginary time direction may be quite small (see discussion in Ref. [79] on this point). While the former limitation can be relaxed using larger anisotropies the later will always remain. Therefore it is useful to inspect the temperature dependence of the correlators at the first step. The temperature dependence of the correlators is due to the explicit temperature dependence of the corresponding spectral functions and the temperature dependence of the integration kernel in Eq. (14). To factor out the trivial temperature dependence of the correlator due to periodicity in the time direction we construct the following model correlator
| (15) |


with being some temperature below deconfinement. If the spectral function has no temperature dependence also above deconfinement we would expect no temperature dependence in and . In Fig. 14 we show for different channels. As one can see for temperatures this ratio is not very far from unity for the pseudo-scalar and vector channels, while for the scalar and axial-vector channels large changes are visible already at . This suggests that ground state charmonia may survive deconfinement with little modifications of their properties, while excited charmonia states are dissolved or strongly modified by the medium right after deconfinement. To study the problem more in detail one needs to reconstruct the spectral functions which are shown in Fig. 15. The figure confirms the expectation based on the analysis of the correlator, seems to exist up to temperatures , while the states is dissolved at . The situation is similar for the pseudo-scalar and axial vector spectral functions. The results for the states (, ) are confirmed by calculations done on anisotropic lattices, though there is some controversy about the temperature where dissolves and the way it disappears. In Ref. [80] it was found that the charmonia abruptly disappear at , while the spectral functions shown above suggest a gradual dissolution.


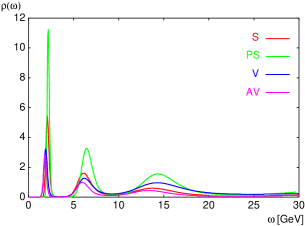
Meson spectral functions at finite temperature were also studied in the case of light quarks. In particular in Ref. [75] the first attempt to calculate vector spectral functions and the thermal dilepton rate was made using isotropic lattices. Then meson spectral functions for scalar, pseudo-scalar, vector and axial-vector channels were calculated using anisotropic lattices [80]. One should keep in mind, however, that unlike in heavy quark case here no study of possible systematic effects was done so far. One common expectation that the pseudo-scalar and scalar correlators should become degenerate at high temperatures due to effective restoration of symmetry. The same is true for the vector and axial-vector correlators. Explicit calculations confirm these expectations [76, 78]. An interesting feature of the light meson spectral function above deconfinement is that they do not show any continuum like structures which one could identify with freely propagating quarks but peaks. In Fig. 16 I show the meson spectral functions at which demonstrates this feature. While the second and third peak are likely to be lattice artifacts (though not yet shown by a detailed analysis) the first peak is likely to be physical and its existence is quite bizarre. Note that the spectral functions in Fig. 16 also show the degeneracy of opposite parity channels as expected from the analysis of the correlators, moreover the masses in all four channels appear to be roughly the same.
Acknowledgment
This work has been authored under the contract DE-AC02-98CH10886 with the U.S. Department of energy. I would like to thank Z. Fodor and F. Karsch for careful reading of the manuscript and many valuable comments.
References
- [1] R. Hagedorn, Nuovo Cim. Suppl. 3 (1965) 147
- [2] G. F. Chapline et al., Phys. Rev. D 8 (1973) 4302.
- [3] J.C. Collins and M.J. Perry, Phys. Rev. Lett. 34 (1975) 1353
- [4] A.M. Polyakov, Phys. Lett. B72 (1978) 477; L. Susskid, Phys. Rev D 20 (1979) 2610
- [5] L.D. McLerran and B. Svetistky, Phys. Lett. B 98 (1981) 195; J. Kuti, J. Polónyi and K. Szlachányi, Phys. Lett. B98 (1981) 199; Engles et al, Phys. Lett. B 101 (1981) 89
- [6] F. Karsch, Lect. Notes Phys. 583 (2002) 209; F. Karsch, J. Phys. G 30 (2004) S887
- [7] E. Laermann and O. Philipsen, Ann. Rev. Nucl. Part. Sci. 53 (2003) 163
- [8] S.D. Katz, Nucl. Phys. Proc. Suppl. 129 (2004) 60
- [9] A.D. Linde, Phys. Lett. B 96 (1980) 289
- [10] M. Fukugita, M. Okawa, A. Ukawa, Phys. Rev. Lett. 63 (1989) 1768
- [11] CP-PACS, M. Okamoto et al., Phys. Rev. D60 (1999) 094510
- [12] S. Necco, Nucl. Phys. B 683 (2004) 137
- [13] CP-PACS, Y. Namekawa et al., Phys. Rev. D 64 (2001) 074507
- [14] G. Boyd, J. Engels, F. Karsch, E. Laermann, C. Legeland, M. Lütgemeier and B. Petersson, Nucl. Phys. B 469 (1996) 419
- [15] C. Alexandru et al., Phys. Rev. D60 (1999) 034504
- [16] F. Karsch et al., Nucl. Phys. B (Proc. Suppl.) 129-130 (2004) 614
- [17] N. H. Christ and X. Liao, Nucl. Phys. Proc. Suppl. 119 (2003) 514
- [18] F. Karsch, E. Laermann and A. Peikert, Nucl. Phys. B 605 (2001) 579
- [19] M. D’Elia, A. Di Giacomo and C. Pica, hep-lat/0408011, hep-lat/0408008
- [20] A. Ali Khan et al. [CP-PACS Collaboration], “Phase structure and critical temperature of two flavor QCD with Phys. Rev. D 63 (2001) 034502
- [21] Z. Fodor, S. D. Katz and K. K. Szabo, JHEP 0408 (2004) 003; N.H. Christ and L.L. Wu, Nucl. Phys. B (Proc. Suppl.) 106 (2002) 438; P. Chen et al., Phys. Rev. D 64 (2001) 014503
- [22] S. Aoki et al. [JLQCD Collaboration], Nucl. Phys. Proc. Suppl. 73, 459 (1999)
- [23] Z. Fodor and S. D. Katz, JHEP 0404, 050 (2004)
- [24] C. Bernard et al. [MILC Collaboration], arXiv:hep-lat/0405029.
- [25] C. Bernard et al. [MILC Collaboration], hep-lat/0409097
- [26] C. Bernard et al. [MILC Collaboration], Nucl. Phys. Proc. Suppl. 129 (2004) 626
- [27] C. Bernard et al. [MILC Collaboration], Nucl. Phys. Proc. Suppl. 119 (2003) 523
- [28] C. Aubin et al., arXiv:hep-lat/0402030.
- [29] A. Hasenfratz, Nucl. Phys. Proc. Suppl. 119 (2003) 131
- [30] S. Gottlieb et al., Phys. Rev. D35 (1987) 3972, ibid. D40 (1989) 2389; Gavia et al., Phys. Lett. B232 (1989) 491, ibid. B241; J. Engles et al., Phys. Lett. B396 (1997) 210
- [31] S. Gottlieb, Nucl. Phys. Proc. Suppl. 20 (1991) 247
- [32] A. Hasenfratz and F. Knechtli, arXiv:hep-lat/0105022.
- [33] A. Hasenfratz and F. Knechtli, Nucl. Phys. Proc. Suppl. 106 (2002) 432
- [34] P. Petreczky, J. Phys. G 30 (2004) S1259; Z. Fodor, A. Hasenfratz, S.D. Katz, P. Petreczky, Phase diagram in 2+1 flafor QCD with HYP staggered action, in preparation
- [35] Z. Fodor, S.D. Katz, Phys. Lett. B 534 (2002) 87
- [36] Z. Fodor and S. D. Katz, JHEP 0203 (2002) 014
- [37] C. R. Allton et al., Phys. Rev. D 66 (2002) 074507
- [38] C. R. Allton et. al, Phys. Rev. D 68 (2003) 014507
- [39] P. de Forcrand and O. Philipsen, Nucl. Phys. B 642 (2002) 290
- [40] P. de Forcrand and O. Philipsen, Nucl. Phys. B 673 (2003) 170
- [41] M. D’Elia and M.P. Lombardo, Phys. Rev. D 67 (2003) 014505
- [42] C. W. Bernard et al., [MILC Collaboration], Phys. Rev. D 55 (1997) 6861
- [43] A. Ali Khan et al., [CP-PACS Collaboration], Phys. Rev. D 64 (2001) 074510
- [44] U. M. Heller, F. Karsch and B. Sturm, Phys. Rev. D 60 (1999) 114502
- [45] F. Karsch, E. Laermann and A. Peikert, Phys. Lett. B 478 (2000) 447
- [46] F. Karsch, Nucl. Phys. A 698 (2002) 199c
- [47] F. Csikor, G. I. Egri, Z. Fodor, S. D. Katz, K. K. Szabo and A. I. Toth, JHEP 0405, 046 (2004)
- [48] . Digal, E. Laermann and H. Satz, Eur. Phys. J. C 18 (2001) 583; A. Mócsy, F. Sannino and K. Tuominen, J. Phys. G 30 (2004) S1255, Phys. Rev. Lett. 92 (2004) 182302; Y. Hatta and K. Fukushima, Phys. Rev. D 69 (2004) 097502, hep-ph/0311267; A. Dumitru, D. Roder and J. Ruppert, arXiv:hep-ph/0311119.
- [49] F. Karsch, K. Redlich, A. Tawfik, Eur. Phys. J. C 29 (2003) 549
- [50] F. Karsch, K. Redlich, A. Tawfik, Phys. Lett. B 571 (2003) 67
- [51] S. Ejiri, these proceedings
- [52] S. Kratochvila, these proceedings
- [53] Phys. Rev. D 24 (1981) 450.
- [54] L.S. Brown, W.I. Weisberger, Phys. Rev D 20 (1979) 3239
- [55] S. Nadkarni, Phys. Rev D 33 (1986) 3738
- [56] O. Philipsen, Phys. Lett. B 535 (2002) 138
- [57] O. Kaczmarek, F. Karsch, P. Petreczky and F. Zantow, Phys. Lett. B 543 (2002) 41
- [58] F. Zantow, O. Kaczmarek, F. Karsch and P. Petreczky, arXiv:hep-lat/0301015.
- [59] O. Kaczmarek, F. Karsch, P. Petreczky and F. Zantow, Nucl. Phys. Proc. Suppl. 129 (2004) 560
- [60] K. J. Juge, J. Kuti and C. Morningstar, Phys. Rev. Lett. 90 (2003) 161601, hep-lat/0103008
- [61] G. S. Bali, Phys. Rept. 343 (2001) 1
- [62] O. Jahn and O. Philipsen, arXiv:hep-lat/0407042
- [63] O. Kaczmarek, F. Karsch, F. Zantow and P. Petreczky, arXiv:hep-lat/0406036.
- [64] O. Kaczmarek, S. Ejiri, F. Karsch, E. Laermann and F. Zantow, Prog. Theor. Phys. Suppl. 153 (2004) 287
- [65] P. Petreczky and K. Petrov, Phys. Rev. D 70 (2004) 054503
- [66] A.I. Toth, these proceedings
- [67] S. Digal, P. Petreczky and H. Satz, Phys. Rev. D 64 (2001) 094015, Phys. Lett. B 514 (2001) 57
- [68] E. V. Shuryak and I. Zahed, arXiv:hep-ph/0403127.
- [69] C. Y. Wong, arXiv:hep-ph/0408020.
- [70] E. Braaten, R. D. Pisarski and T. C. Yuan, Phys. Rev. Lett. 64 (1990) 2242
- [71] F. Karsch, E. Laermann, P. Petreczky and S. Stickan, Phys. Rev. D 68 (2003) 014504.
- [72] Y. Nakahara, M. Asakawa and T. Hatsuda, Phys. Rev. D 60 (1999) 091503; Prog. Part. Nucl. Phys. 46 (2001) 459
- [73] T. Yamazaki et al. [CP-PACS Collaboration], Phys. Rev. D 65 (2002) 014501
- [74] T. Blum and P. Petreczky, arXiv:hep-lat/0408045
- [75] F. Karsch, E. Laermann, P. Petreczky, S. Stickan and I. Wetzorke, Phys. Lett. B 530 (2002) 147
- [76] F. Karsch, S. Datta, E. Laermann, P. Petreczky, S. Stickan and I. Wetzorke, Nucl. Phys. A 715 (2003) 701
- [77] M. Asakawa, T. Hatsuda and Y. Nakahara, Nucl. Phys. A 715 (2003) 863
- [78] P. Petreczky, J. Phys. G 30 (2004) S431
- [79] T. Umeda, K. Nomura and H. Matsufuru, arXiv:hep-lat/0211003
- [80] M. Asakawa and T. Hatsuda, Phys. Rev. Lett. 92 (2004) 012001
- [81] S. Datta, F. Karsch, P. Petreczky and I. Wetzorke, Phys. Rev. D 69 (2004) 094507
- [82] T. Matsui and H. Satz, Phys. Lett. B 178 (1986) 416.
- [83] F. Karsch, M.T. Mehr, H. Satz, Z. Phys. C 37 (1988) 617