QCD Phase Diagram at small Baryon Densities from Imaginary : Status Report
Abstract
We summarize our recent results for the ()-phase diagram of QCD. Finding a strong variation of the critical endpoint with the quark mass , we point out that an endpoint within reach of experiment requires fine-tuned quark masses. We further discuss the strategy and first data towards extending our results to the physical theory.
1 Introduction
Currently, several approaches are used to side-step the sign problem of lattice QCD in attempts to compute the low density QCD phase diagram. These are based on multi-parameter reweighting [1], Taylor expansions [2] and analytic continuation from simulations at imaginary [3], for which there is no sign problem [4]. While reweighting is exponentially difficult on large volumes, calculation of Taylor coefficients becomes increasingly complicated with growing order. By contrast, a simulation at imaginary is no more difficult than one at . Moreover, it is the only approach for which two simulation parameters are varied, resulting in uncorrelated statistical errors for different values of . Monte Carlo results for imaginary thus involve no approximations. Within the circle of analyticity around , they can be fitted by truncated Taylor series in and analytically continued to real . While truncating the series introduces an approximation, it is well controlled because it can be compared to the full result at imaginary .
The task for lattice simulations is to first map out the phase diagram in the quark mass plane at , i.e. to find the critical line of second order transitions, separating the first order region from the crossover region. In a second step, we wish to know the surface emanating from this line in the direction [6]. So far, even at we know only one point of the critical line, corresponding to degenerate quark masses, , and only for one coarse lattice spacing, . In a recent paper we have computed the phase diagram for the theory and determined the quark mass dependence of the critical endpoint [5]. Here we summarize these results and extend them to the physical case of . The general properties of QCD with complex chemical potential as well as analyticity properties of observables are discussed in the literature [3, 5].
2 The pseudo-critical line for
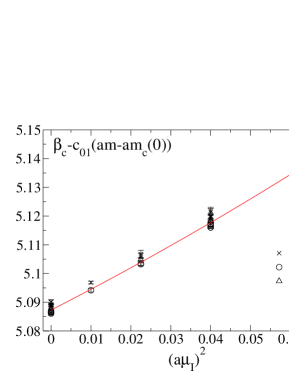
For , we computed the pseudo-critical gauge couplings at the phase boundary, and their dependence on imaginary chemical potential as well as the quark mass. The data are shown in Figure 1 for different lattice sizes. They are well fitted by a polynomial of degree one in the and two in . We have explicitly checked that additional polynomial terms are statistically insignificant. The figure shows that, to good approximation, the leading -term suffices over the interval considered, but our accuracy is good enough to also determine the next-to-leading coefficient. Analytic continuation and conversion to physical units yields
| (1) | |||||
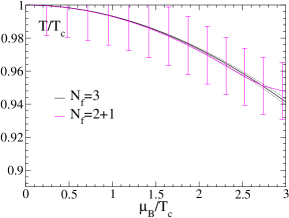
Note that the natural expansion parameters are , leading to Taylor coefficients of order one. This is understood in terms of the finite temperature Matsubara modes , which set the energy scale. Since the strange quark mass and its difference with are small compared to , the critical temperature is fairly insensitive to quark masses in the light quark regime. It is then sensible to compare our results with the curve of Fodor and Katz [1] (Figure 1 right), and excellent agreement is found. Note that decreases only at the percent level over the whole range of baryon chemical potentials considered here, which thus has a very weak effect. This is a natural consequence of the smallness of the effective expansion parameter with Taylor coefficients of order one.
3 The critical endpoint and its quark mass dependence
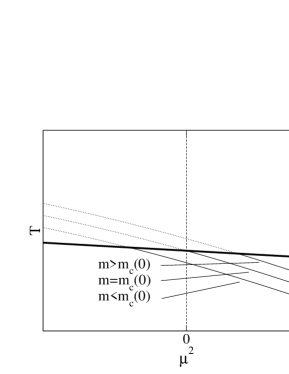
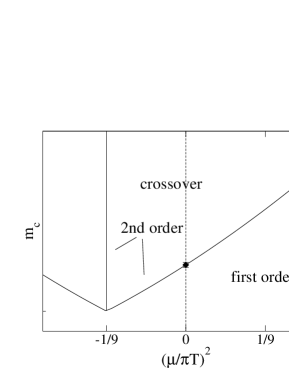
In the three flavor theory, we have a 3d parameter space, . The pseudo-critical temperature, , represents a surface in this space. On this surface there is a line of critical points, , separating first order transitions from crossover. Projections of this situation to the planes are shown in Figure 2. As the quark mass is increased from , the critical endpoint moves to a finite , while a decrease moves it to imaginary . The change of with , or vice versa, is best seen in the -plane, where it forms a critical line separating regions of first order transitions and crossover. We determine this line around by measuring the Binder cumulant of . In the infinite volume limit it assumes a universal value at a 3d Ising critical point,
| (2) |
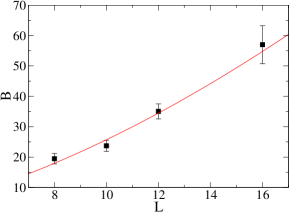
while it is smaller or larger in first order and crossover regions, respectively. Data for various quark masses, as well as its universal finite size scaling, are shown in Figure 3.
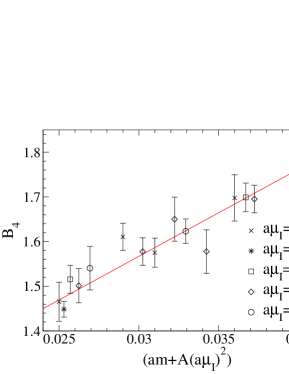
Fitting the data to a Taylor expansion about the critical point, , the parameter represents the first coefficient of the series
| (3) |
Like for , the leading Taylor coefficient is of order one. This implies that the change in is very weak up to chemical potentials of MeV. Conversely, is extremely sensitive to the precise value of the quark mass. We believe that this statement holds for all discretizations, because the -independent multiplicative mass renormalization drops out of the ratio in (3), which should have only additive corrections. This means that for growing quark masses , the critical point will rapidly shoot to very large values. Hence a small requires a fine-tuned quark mass.
4 Towards the phase diagram
In the case of physical interest, we have a 4d parameter space . The critical surface can be determined in a two-step procedure. First, we need to complete the phase diagram at , i.e. find the line . The results of this step are shown in Figure 4.
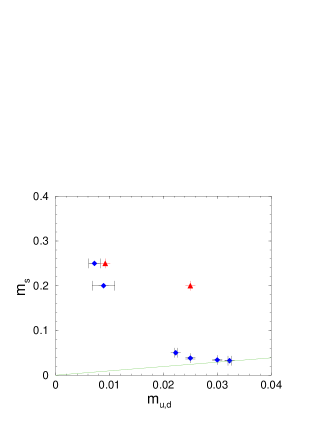
As the light quark mass is decreased, strongly non-linear behavior is encountered, and linear extrapolations from the result to the physical point are clearly ruled out. In a second step in progress, we compute the change of this line with finite , leading to the critical surface . It is intriguing to consider the simulation point of Fodor and Katz [1] for physical quark mass values (FK2) in this diagram. This point is only slightly displaced from our critical line , but corresponds to MeV. This is consistent with our observation of a rapid change of for small variations of the quark masses. Since quark masses are very cut-off sensitive, one thus has to expect large shifts of the critical point in physical units as the continuum limit is approached.
References
- [1] Z. Fodor and S. D. Katz, JHEP 0404, 050 (2004); JHEP 0203, 014 (2002).
- [2] C. R. Allton et al., Phys. Rev. D 66, 074507 (2002).
- [3] P. de Forcrand and O. Philipsen, Nucl. Phys. B 642, 290 (2002); M. D’Elia and M. P. Lombardo, Phys. Rev. D 67, 014505 (2003).
- [4] For a comparative review, see E. Laermann and O. Philipsen, Ann. Rev. Nucl. Part. Sci. 53, 163 (2003).
- [5] P. de Forcrand and O. Philipsen, Nucl. Phys. B 673, 170 (2003).
- [6] See the contribution of C. Schmidt, these proceedings.
- [7] F. Karsch, E. Laermann and C. Schmidt, Phys. Lett. B 520, 41 (2001).