Improved Measure of Local Chirality††thanks: Presented by T. Draper at Lattice 2004.††thanks: This work is supported in part by the U.S. Department of Energy under grant numbers DE-FG05-84ER40154 and DE-FG02-02ER45967.
Abstract
It is popular to probe the structure of the QCD vacuum indirectly by studying individual fermion eigenmodes, because this provides a natural way to filter out UV fluctuations. The double-peaking in the distribution of the local chiral orientation parameter () has been offered as evidence, by some, in support of a particular model of the vacuum. Here we caution that the -distribution peaking varies significantly with various versions of the definition of . Furthermore, each distribution varies little from that resulting from a random reshuffling of the left-handed (and independently the right-handed) fields, which destroys any QCD-induced left-right correlation; that is, the double-peaking is mostly a phase-space effect. We propose a new universal definition of the parameter whose distribution is uniform for randomly reshuffled fields. Any deviations from uniformity for actual data can then be directly attributable to QCD-induced dynamics. We find that the familiar double peak disappears.
1 Introduction
The use of eigenmodes to probe the structure of the QCD vacuum is fairly old, but the recent resurgence of interest is the result of the focus on local properties [1] and the use of chiral fermions [2, 3]. The space-time chiral structure of the eigenmodes reflects the space-time topological structure of the underlying gauge fields. Our work [4] has involved a detailed study of the space-time geometric structure and we have argued that this is inconsistent with the instanton liquid model (ILM). Many others [5] have studied the behavior of the low lying eigenmodes and have argued in favor of the ILM, but their conclusion relies solely on the interpretation of the observed double-peaked behavior of the probability distribution of the local chiral orientation parameter. To help resolve this, here we revisit the local chiral orientation parameter.
2 Local Chirality Parameter
The local chiral parameter, , measures the tendency of a field at a space-time point to be left or right handed. It was originally [1] defined in terms of the polar coordinate . Many definitions of are possible (including several from the literature [5]):
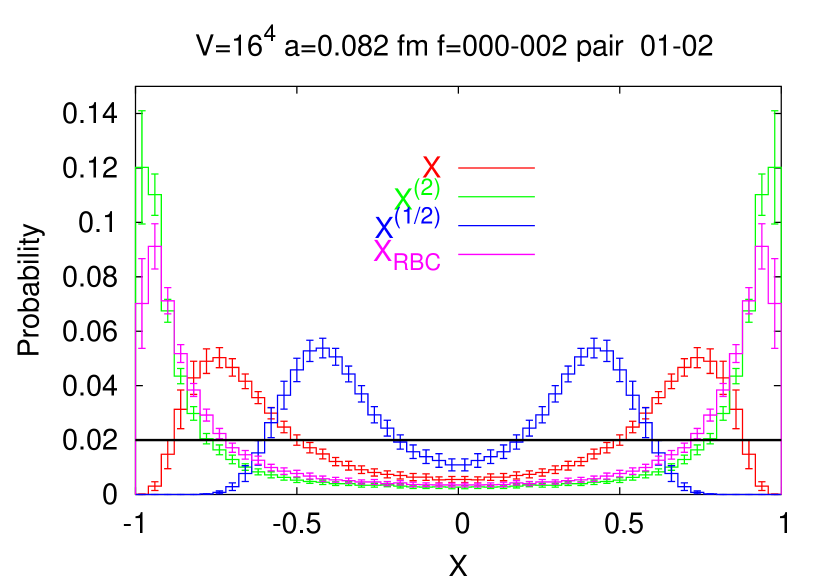
for a purely left (right) handed field. However, as we see in Fig. 1, the double peaking depends strongly on the definition of . We need a universal measure which will produce a constant distribution for random, uncorrelated data.
3 A Test: Randomly Reshuffling Fields
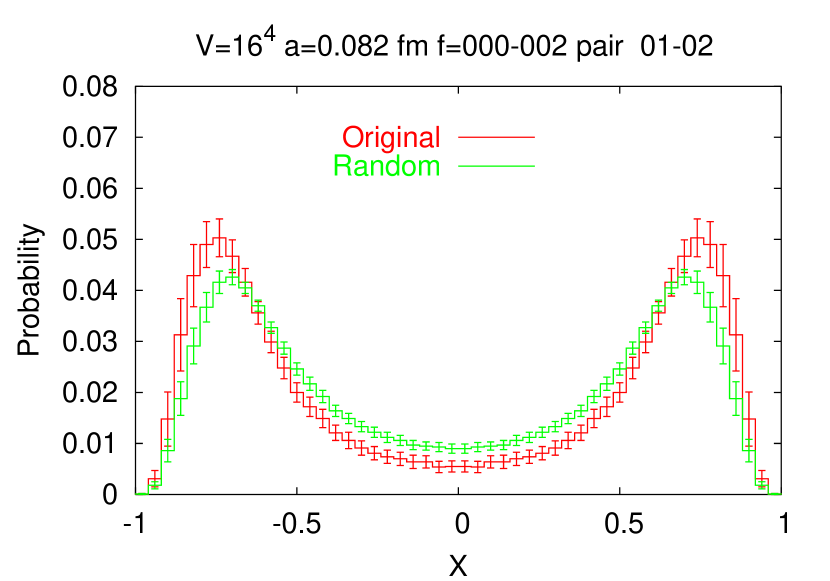
To determine how much of the double peaking in the -distribution is due to dynamics of the QCD vacuum, we make the following test: Compute the distribution from and . Then randomly reshuffle the fields: , where is a random permutation. Use an independent random reshuffle for . Now any QCD-dynamically-induced correlation between and at site is destroyed. Recompute the -distribution. We see in Fig. 2 that the randomized distribution looks very similar.
To understand how there can be so little difference between original and randomized -distributions, consider the marginal probability of the actual (non-randomized) Monte Carlo data (Fig. 3). The key is that the marginal distribution has a long tail.
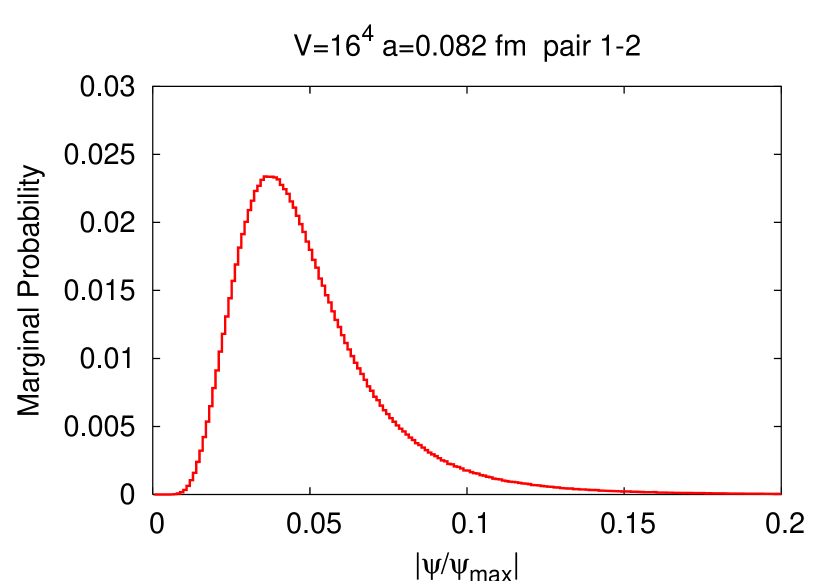
To construct an distribution, one first cuts the data, selecting the most intense points, i.e. the top 2% (or 5% or 10%) of the density . For and chosen randomly from this distribution, it is likely that either or is large (to make the cut). Given this pre-selected data, and one of these large components (say ) in the tail of the distribution, it is very likely that the randomly chosen is much less than the selected (since the bulk of the marginal distribution is in the peak at smaller values). But such a pair (large and smaller , or vice versa) result in a value of much different than , leading to the “double peak”.
4 A New Universal Definition of
The “-distribution” is a histogram of the probability of a given value of . With generic coordinates and ,
But if the components and were uncorrelated (supposing there were no dynamics), then one would obtain a different histogram,
Clearly, to expose the true correlation we need to “subtract” the phase space background. Consider the cumulative distribution function . Then . For uncorrelated components, what is the probability density of obtaining a particular value of ?
That is, this probability density is uniform for uncorrelated data, which is what we seek! We can rescale and rename this quantity so that as for . is the improved quantity against which we should plot our distributions. It will be constant for uncorrelated data. Deviations from uniformity will appear for correlated data.
5 Results
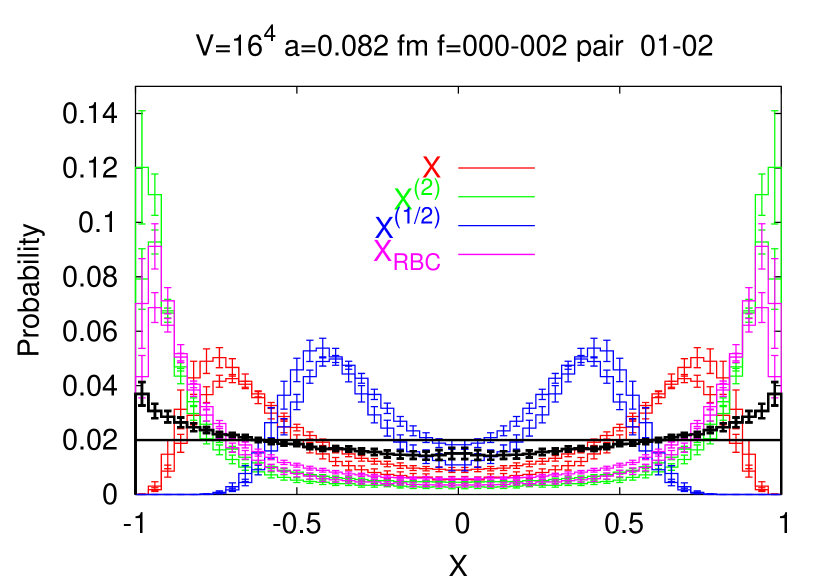
In Fig. 4 for each of four definitions of , we plot the original data and its randomization versus , and their “difference” (in thick black) versus the new variable . Compare to the baseline of no correlation (thin black line) at 0.02 (50 histogram bins). Note that the new improved definition is universal; that is, the black curves are exactly the same. Thus the “Double-Peak” is exposed as a phase-space effect, which is removed with the new .
6 Summary
Fermion eigenmodes (which filter UV fluctuations) are useful probes of the structure of the QCD vacuum. Observation of a double peaking in the local chirality parameter (“ distribution”) is a necessary but not sufficient condition for the viability of the instanton liquid model (ILM) [4]. The double-peaking depends strongly on the definition of . Moreover, after the fields have been randomly reshuffled (thus destroying any QCD-dynamics correlations), the distribution looks very similar to the original distribution! That is, most of the double peaking is due to phase space and does not reflect the dynamics of QCD. Accordingly, we have constructed a new universal measure (“”) of local chirality against which one should plot probability distributions. It is uniform for uncorrelated data. Deviations from uniformity appear for correlated data. The “double-peak”, exposed as mostly a phase-space effect, is flattened with the new improved , leaving little evidence in support of the ILM.
References
- [1] I. Horváth et al., Phys. Rev. D65 (2002) 014502.
- [2] H. Neuberger, Phys. Lett. B417 (1998) 141.
- [3] R. Narayanan, H. Neuberger, Nucl. Phys. B443 (1995) 305.
- [4] I. Horváth et al., Phys. Rev. D66 (2002) 034501; I. Horváth et al., Phys. Rev. D67 (2003) 011501; I. Horváth et al., Phys. Rev. D68 (2003) 114505.
- [5] C. Gattringer et al., Nucl. Phys. B618 (2001) 205; T. DeGrand, A. Hasenfratz, Phys. Rev. D65 (2002) 014503; R.G. Edwards, U.M. Heller, Phys. Rev. D65 (2002) 014505; I. Hip et al., Phys. Rev. D65 (2002) 014506; T. Blum et al., Phys. Rev. D65 (2002) 014504; N. Cundy, M. Teper, U. Wenger, Phys. Rev. D66 (2002) 094505; C. Gattringer, Phys. Rev. Lett. 88 (2002) 22160; P. Hasenfratz et al., Nucl. Phys. B643 (2002) 280; C. Gattringer, Phys. Rev. D67 (2003) 034507.