Dimensional reduction and a Z(3) symmetric model
Abstract
We present first results from a numerical investigation of a symmetric model based on dimensional reduction.
1 The Model
In this note we will describe some of the properties of a symmetric generalization of dimensional reduction, applied to gauge theory in dimension. The motivation is to construct an effective action, which is constrained by perturbative dimensional reduction at high temperature, but which can be applied all the way down to the confinement phase transition. The partition function is defined as follows:
| (1) |
| (2) | ||||
| (3) | ||||
| (4) |
The matrices and are defined on the sites and the links respectively of a two dimensional lattice. The matrices represent the Polyakov loops of the full theory. Similar models have been proposed in [1]. Here we discuss the phase structure of the above model, and compare with results obtained within the standard reduction recipes [2, 3]. For simplicity we set and discuss the phase structure in the plane. The number of time slices in (2+1)D, which enters as a parameter in is fixed to 4 throughout this paper.
2 Numerical simulations
The model (1) was studied using conventional lattice QCD Monte-Carlo techniques. The multi hit metropolis algorithm was used both for updating the gauge fields and Polyakov loops fields . Lattices of sizes ranging from to were studied. The main quantities measured were the traces of Polyakov loops
| (5) |
and their two–point correlators.
3 Results
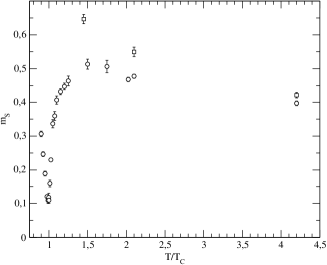
We started with simulations at for a range of values and got the expected signal of the phase transition between the low-temperature confined symmetric phase (Ia) and a broken high temperature phase (II). Screening masses were obtained by fitting the two point Polyakov loop unconnected correlators with the formula
| (6) |
We plot the result of the fit in figure 1. On the same plot we show the results obtained in [2] with the naively reduced model (no Higgs potential). At sufficiently large temperature (large ) the agreement is good, but the symmetric model also describes the vanishing of the screening mass associated with restoration at lower temperatures.
We then performed a series of scans in the – plane on lattices and looked for peaks in the susceptibility
| (7) |
as indications of phase transitions, while the associated distributions of were used to characterize the phases. After so identifying a tentative phase diagram (see figure 2),
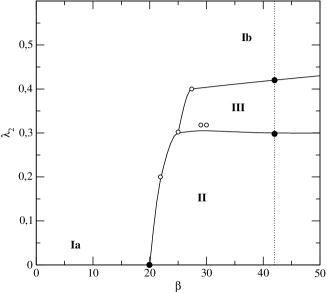
we made a more precise study on larger lattices along the line . The results for the susceptibility are plotted in figure 3.
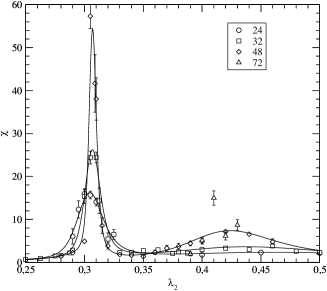
One sees a strong transition signal just above . There the size dependence of at its maximum, as well as the time history of and its doubly peaked histogram clearly indicate that the transition is first order.
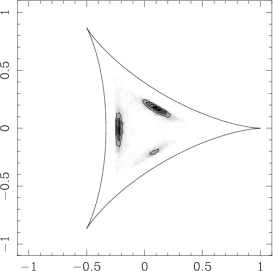
The evidence for a second phase transition, slightly above is considerably weaker. The peak is less pronounced and we had to go to lattices (with much poorer statistics) to make sure that it grows with the lattice size. In order to study the nature of the phases, we looked at the distributions of the Polyakov loops . The regions marked Ia and II on figure 2 are easily identified with standard symmetric and broken phases, with data concentrated respectively around and . At larger in region III, a new pattern shows up, with again breaking peaks, but the argument of is now close to , as illustrated on figure 4. Finally, when is further increased (region Ib), the histogram is located around , no particular argument is selected, and we conjecture that the phase is the same as the low temperature confined one (Ia).
Expanding the -fields to second order in the SU(3) algebra and integrating over the latter support the phase structure just outlined. This will be described elsewhere.
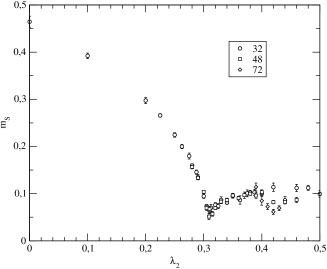
Along , we have used the projected (0–momentum) correlators to extract the masses, by fitting them to the formula :
| (8) |
Our results are summarized in figure 5. The mass value is found to coincide with that measured at , in the original(2+1) model [2] for close to 0.2. This point in parameter space is a stable point of the phase diagram, at variance with what happens in the conventionally reduced model, where the physical situation corresponds to a metastable point [2].
In conclusion, the symmetric model opens a possibility to extend dimensional reduction down to the temperature where confinement is restored. It exhibits an interesting phase diagram, with a new phase whose connection to QCD at finite temperature and/or chemical potential should be investigated. For this purpose, a study to constrain the model parameters is under way.
References
- [1] R. D. Pisarski, Phys. Rev. D 62, 111501 (2000) [arXiv:hep-ph/0006205].
- [2] P. Bialas, A. Morel, B. Petersson, K. Petrov and T. Reisz, Nucl. Phys. B 581 (2000) 477 [arXiv:hep-lat/0003004].
- [3] P. Bialas, A. Morel, B. Petersson, K. Petrov and T. Reisz, Nucl. Phys. B 603, 369 (2001) [arXiv:hep-lat/0012019].